Health
Vol. 4 No. 8 (2012) , Article ID: 22006 , 4 pages DOI:10.4236/health.2012.48084
Community effects on public health in India: A hierarchical model
![]()
1Department of Biostatistics, All India Institute of Medical Sciences (AIIMS), New Delhi, India; *Corresponding Author: dwivedi7@hotmail.com
2National Institute of Medical Statistics, Indian Council of Medical Research, New Delhi, India
Received 29 February 2012; revised 29 March 2012; accepted 10 April 2012
Keywords: Community Effects; Public Health; Multilevel Analysis; Hierarchical Model; Traditional Regression Model
ABSTRACT
The data on any aspect of public health, including that on infant mortality, has inbuilt hierarchical structure. Using traditional regression approach in data analysis, i.e., ignoring hierarchical structure, either at micro (individual) or at macro (community) level will be avoiding desired assumption related to independence of records. Accordingly, this may result into distortion in the results due to probable underestimation of standard error of the regression coefficients. To be more specific, an irrelevant covariate may emerge as an important covariate leading to inappropriate public health implications. To overcome this problem, the objective of the present work was to deal with multilevel analysis of the data on infant mortality available under second round of National family Health Survey and notify changes in results under traditional regression analysis that ignores hierarchical structure of data. This method provides more accurate results leading to meaningful public health implications. In addition, estimation of variability at different levels and their covariance are also obtained. The results indicate that the community (e.g., state) level characteristics still have major role regarding infant mortality in India. Further, if computational facilities are available, multilevel analysis may be preferred in dealing with data involving hierarchical structure leading to accurate results having meaningful public health implications.
1. INTRODUCTION
The public health research (e.g., outcomes like child survival; contraceptive adoption), the data structures are often hierarchical in nature especially those available at national/state/district-/village/household/ individual level. Till recently, there have been generally two traditional statistical procedures to deal with them: 1) the first procedure is to disaggregate all higher order variables to the individual level and carry out the analysis at individual level. Here, assumption of independence of observations cannot be ensured that is basic for the classical statistical techniques and hence can provide distorted results [1,2]; and 2) the second procedure is to aggregate the individual level variables to the higher level and do the analysis at higher level. Under this approach, all the within group information (variation) are thrown away which may be as much as 80% or 90% of the total variation before we start the analysis. As a consequence, relations between aggregated variables are often much stronger giving distorted interpretation at individual level [1,2].
In view of the above mentioned brief facts, if data is of hierarchical structure, there is need to deal with comparatively new approach in data analysis (i.e., hierarchical/multilevel analysis) that: 1) takes hierarchical structure into account which also makes it possible to incurporate variables from all levels and retain them at their own levels; 2) satisfies assumption of independence and considers total variation which obviously lead to correct analysis and proper interpretation of the data; 3) provides the relative importance of an individual’s characteristics and those of the community in which he/she lives; 4) helps in working out importance of variables across the levels through partition of variance; and 5) facilitates ranking of communities that obviously provides important clues strengthening ensuing public health programs.
Child survival has been reported as one of the important components of reproductive health. The survival and health of children, especially in developing countries, have been of central concern [3]. An appropriate epidemiological understanding of regional child survival from time to time may be helpful to policy planners for an appropriate public health program not only in that region but also in other regions. Nowadays, efforts are being made to carry out more appropriate analytical work through micro level studies, instead of relying entirely on the literature available on this topic. It is believed that such an attempt is likely to provide more accurate results, which would lead to more appropriate intervention. Child survival is an important public health indicator [3,4] and plays a vital role in population change. Child survival analysis may also help in testing many hypotheses related to population issues and generate various important clues towards public health programs.
For analysis of child survival, the data collected under retrospective surveys on the mortality history of children are used in the present study. These data may inherently suffer from certain types of bias viz truncation, selectivity, and censoring. Researchers have found that child survival depends on various socioeconomic and demographic factors in addition to the availability and use of health facilities. The problem of censoring can be effectively handled with the application of hazards life tables with covariates (hazards models analysis) for time to event or survival data that has provided a means for assessing simultaneously the effects of several factors on the child survival [5-7]. In contrast to usual life tables, hazard models analysis assumes that the risk varies among children according to individual characteristics [6-9]. Hazard models also provide alternative ways of handling censored and incomplete data on mortality histories without information loss and yield unbiased estimates [10,11].
Birth spacing and child survival are intricately linked, both affecting each other. A short birth interval affects the child survival adversely primarily because of two prominent reasons. Firstly, the mother does not get sufficient time for physical and nutritional recovery, particularly in conditions of malnutrition and poor maternal care which is likely to cause premature and low birth weight babies. This, for obvious reasons, leads to poor survival probability. Secondly, under poor socio-economic conditions, all the siblings may be at a greater risk because of having to share the limited resources available to them [12]. Rapid subsequent pregnancy may also compel the woman for an early termination of breastfeeding with consequent deleterious effects on survival of the preceding child [13]. Maine and McNamara [14] have also emphasized the importance of birth spacing and its potentiality for improving child survival. Recently, UNFPA [15] have defined four ways to save a life that is one: delay the first birth; two: space births by at least two years; three: avoid too many pregnancies and four: stop in time. In view of the linkage between birth spacing and child survival, it may be worthwhile to assess the existing relationship (between birth spacing and child survival). To be more specific, while analyzing data on child survival, previous birth spacing may be included as one of the independent variables. This may help in better understanding of how birth spacing affects child survival. On account of similar linkage between breastfeeding and child survival, inclusion of breastfeeding in analysis is also unavoidable. Further, for better epidemiological understanding, birth order should also be included in the analysis.
Among the studies on child survival that have mainly dealt with hazards models analysis, Trussell and Hammerslough [9] used World Fertility Survey data for hazard models analysis of the covariates of infant and child mortality in Sri Lanka. Mother’s and father’s education, place of residence, sex of the child, birth order and age of mother were found to be strongly associated with infant and child mortality. Khorshed, Mozumder and Phillips [16] considered data from longitudinal demographic database to examine the effects of social and economic variables on neonatal and infant mortality in rural Bangladesh. They found that maternal education had no effect on neonatal or post neonatal mortality but mother’s age was inversely related to post neonatal mortality. The social and economic status was reported to be poor indicators of infant mortality. On the other hand, Swenson et al. [17] used the data from Vietnam Demographic and Health Survey. They found that rural child in birth orders five and higher had the greatest risk, birth order one had intermediate and birth order 2 - 4 had lowest risk of early childhood death. They also concluded that neither age, nor education of mother, nor gender of the child had impact on early childhood survivorship. Further, Bloland et al. [18] used the data from rural Malawian community and found that low education and low socio-economic status of the mother were the predominant risk factors for mortality during infant period as well as during the second year of childhood.
The relationship between birth intervals and child mortality was studied using longitudinal data from rural Bangladesh [19]. Previous short birth interval had comparatively lower impact on childhood mortality than those reported in earlier studies. However, previous birth interval of less than 24 months had a greater association with neonatal mortality. Miller et al. [20] analyzed data from Bangladesh and Philippines to demonstrate the relationship between birth spacing and child mortality. They demonstrated that children who were born within fifteen months of a preceding birth are 60% to 80% more likely to die than other children in the first two years of life, once the confounding effect of prematurity were removed. Further, this risk was confined to children of high birth order.
Mturi and Curtis [21] investigated the determinants of infant and child mortality in Tanzania using Tanzania Demographic and Health Survey data (1991-1992). They found that short birth interval was associated with increased risk of death. Ronsman [22] used longitudinal data in a cohort of children born between 1983 and 1989 in rural Senegal to examine the association between short birth spacing and child mortality. He concluded that short birth intervals were a consequence rather than a cause of child mortality. It was, however, reported that the risk of dying in the neonatal and post-neonatal period is more than two times higher for children born after preceding birth intervals of one year or less compared to children born after longer intervals. He further observed that children born within two years of a subsequent birth are at four times higher risk of dying in the second year of life than children whose mothers gave birth more than two years after the index birth. Further, Manda [23] analyzed the data from Demographic and Health Survey (DHS) of Malawi. The result showed that the substantial birth interval and maternal age effects regarding child survival were largely limited to the infant period. Consideration of breastfeeding status of child did not alter effects of preceding birth interval on mortality risk. Recently, Choudhary et al. [24] used data from Bangladesh Demographic and Health Survey (1993-1994). They found that breastfeeding was the prime factor influencing infant, second year, and early childhood survival, and previous birth interval had no impact on mortality. But, Palloni and Millman [25] studied World Fertility Survey data of 12 Latin American countries and reported that breastfeeding did little to explain early childhood survivability.
Recently, Nath, Land, and Singh [4] analyzed the data on scheduled caste population of Assam to investigate the inter-relationship between breastfeeding, birth spacing and child mortality. They reported that breastfeeding mediated the effect of the preceding birth interval on survival of the index child. Nath, Land and Singh [12], using data from a traditional society of eastern Uttar Pradesh (UP), India, also found that breastfeeding duration or breastfeeding status has a strong impact in reducing the relative risk of early child mortality (death during the first two years of life). However, the effect of length of preceding birth interval on early child mortality could not be explained. These studies also did not carry out birth order specific analysis of data on child survival, rather they considered birth order as a covariate.
Pandey et al. [26] further analyzed the data of National Family Health Survey (1992-1993) and provided state specific estimates of neonatal, post-neonatal, infant and child mortality rates in India. In contrast to Choudhary et al. [24], they did not consider some of the important covariates like breastfeeding in the analysis. They carried out birth order specific analysis by subdividing the sample into children of first birth order and those of birth order two or higher. They concluded that birth order, short birth interval, and mother’s age at childbirth have substantial effects on mortality before the age of five years. Further, they suggested that other important covariates should be considered in the analysis e.g. antenatal care, and guidance on home care about well being of babies, immunization, and treatment of common childhood illness. For this, they further analyzed data on children born during the four years before the NFHS, and examined the effects of number of antenatal care visits, immunization of pregnant women against tetanus, and delivery in a medical facility on neonatal mortality. But, they did not consider important variables like breastfeeding and birth order. They concluded that the mother’s full tetanus immunization had a significant protective effect on neonatal survival. Arnold, Choe and Roy [27] also analyzed child mortality with different objectives and considered a limited number of covariates. They neither considered important covariates like breastfeeding nor reported the underlying parameter estimates. In summary, studies on child survival in India have been mostly reported either as analysis regardless of birth order [4,12] or as birth order specific analysis without taking into account important covariates like breastfeeding/status of receiving colostrum [26].
As a matter of fact, to our knowledge, there is no study on child survival/infant mortality especially from India that has taken into account hierarchical structure of data. In other words, most of these studies have been carried out at individual level and higher-level community variables have been disaggregated at individual level that may obviously distort the analytical results. Keeping in view of these observations, involving more parameters of the utilization of reproductive and child health (RCH) services, the main objective of the present study was to work out some hierarchical models for infant mortality in India, which incorporates community effects providing more accurate and useful epidemiological understanding. In addition, traditional models were also worked out, just for providing comparative feel.
2. MATERIALS AND METHODS
2.1. Materials
The data used in the present study are from the National Family Health Survey (NFHS), 1998-1999, conducted for the second time in India. The sample design adopted for the NFHS was a systematic, two-stage, stratified sample of households. The main objective of the NFHS was to collect reliable and up-to-date information on mortality, fertility, family planning, maternal and child health, and infant feeding practices providing state and national level estimates. As described in the national level final report, another important objective was to provide high quality data to academicians and researchers for carrying out analytical research [28]. For the present study, data at the national level has been analyzed. This sample covers 99% of India’s population living in all 26 states. Other than Tripura, period of survey was from November 1998 to March 1999. More than 90,000 households, covering more than 90,000 ever-married women of age 15 - 49 years were surveyed. In addition, the survey collected information on more than 30,000 children born in the three years preceding the survey. The detailed reports covering sampling methods and all other aspects mentioned above are prepared and documented [28].
Under the NFHS, three questionnaires were used—one for villages (administered only in rural areas), one for households, and one for ever-married women. In addition to all other information, detailed maternity history was collected for all the ever-married women aged 15 - 49 years. Extensive health related information including breastfeeding and utilization of RCH services was collected on the children of (ever) married women, who were born during the three years preceding the survey. All ever-married women of reproductive age group were asked to provide information on complete birth history, which includes sex of the child, status of birth, month and year of birth, and survival status of birth. For children who had died, age at death was recorded in days for children dying in the first month of life, in months for children dying after the first month but before their second birthday, and in years for children dying at later ages. The detailed information was also obtained on antenatal, delivery and postnatal care for the two most recent births that occurred to eligible women during the three years preceding the survey. For analysis, to restore the correct proportion in view of no self-weighting of the sample design, the country-level weight was used.
In present analysis, the dependent variable was infant mortality (i.e., child who died before his/her first birthday) in the last three years preceding the survey (0 = alive, died = 1). A total of 33,026 births were recorded in the last three years preceding the survey. Out of them, a total of 221 children who died after their first birthday were considered as alive. Further, a total of 10,617 children who had not completed their first birthday and were alive were excluded from the analysis. The problem of missing information also resulted into exclusion of some of the children: religion + caste (173), standard of living index (292), place of delivery (105), size of child at birth (113), squeeze milk from breast (120), mother’s education level (3), father’s education level (57), and consumed all given tablets (78). Finally, complete information on 21,751 children was available for analysis.
A set of independent/explanatory variables was selected for the analysis. After exploratory analysis, among the qualitative variables, some of them were retained in their existing forms: place of residence (urban/rural), standard of living index (high/low/medium), sex of the child (girl/boy), consumed all given iron tablets (yes/no), and child received colostrums (yes/no). Further, to enable a meaningful analysis, some of the variables available in the form of nominal scale were categorized as dichotomous variables after exploratory analysis: size at birth (averge + large/small), status of birth (single/multiple), mother received at least 3 antenatal visits (yes/no), received at least 2 TT dose (yes/no), place of delivery (institutional/non-institutional). To get the meaningful information, continuous variables were converted into categorical variables, like preceding birth interval (≥24 months/first birth/≤24 months), mother education level (9& above/0 - 5/6 - 8), father’s years of schooling (9& above/0 - 5/6 - 8), and birth order (2 - 3/1/4+). Further, some of the variables were generated using available information in multiple forms. For example, exposure to radio, television, newspaper and poster in the last month preceding the survey were collected separately. Mothers were categorized as positive if they were exposed to any of the media listed above, otherwise no and variable was named as exposure to mass media (yes/no). Further, mothers age at birth was computed by subtracting date of birth of child and date of birth of mother, and recoded as (20 - 29/<20/30+). Religion and caste were pooled to derive another variable religion-caste (non-Hindu/SCST-OBC Hindu/other Hindu).
At state level, percentage of women aware of ORS (<63/≥63); percentage of births of order 4 and above (<28/≥28); percentage of women with middle school & above (<20/≥20); Government expenditure on health per head (<29/≥29) and percentage of women with any anemia (<48/≥49), were considered. For such considerations, confidence interval (CI) of each of the considered covariates’ national level estimate was calculated and the lower limit of CI was used as threshold for categorization.
2.2. Methods
For each of the two data sets, to begin with, the distribution of children in relation to various covariates and also corresponding infant mortality were tabulated. Since outcome variable “infant mortality” is binary, as obvious under traditional data analysis, logistic regression analysis was used to find out the individual factors associated with infant mortality. Hence, as a result of consideration of single covariate in logistic model, unadjusted rate ratio and its 95% confidence interval were worked out in relation to each covariate and presented in the corresponding tables.
The sets of covariates in data analysis were considered in view of both statistical and public health relevance. Further, assessment of possible presence of co-linearity and also effects modification among the considered covariates revealed no such problem in the data sets. Obviously, as appropriate under traditional data analysis, stepwise logistic regression analysis was used to find out the factors associated with infant mortality, of course after a series of explorations. For appropriate comparison, the covariates that were retained in the traditional logistic regression model were included in the hierarchical model. Again, adjusted rate ratio and its 95% confidence interval were worked out and presented in the corresponding tables.For the present analysis of infant mortality in India, as used by earlier studies [29,30], exploration of data structure revealed appropriateness of consideration of only two-level structure in the analysis, conceptualized as children (at level-1) nested within states (at level-2). In other words, 21,751 children nested within 26 states. In addition to traditional multivariable stepwise logistic regression analysis (TLR), the multilevel analysis was carried out twice: first as random intercept model (MLR1) and second as random intercept as well as slope model (MLR2). In other words, all the community level variables were retained at fixed level under MLR1 where as at random level under MLR2. The used models are described below.
2.3. Statistical Analyses
2.3.1. Traditional Logistic Regression Analysis (TLR)
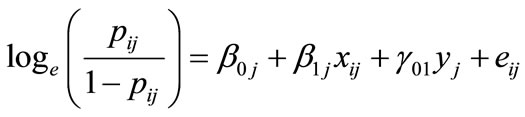
In case of two level data structure, if pij is the probability of infant mortality, we can define
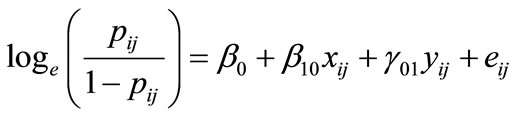
wherei = 1 to nj; j = 1 to j;
 is the intercept;
 ’s are the coefficients for individual (e.g., children/ mothers) level covariates;
 ’s are the coefficients for second (e.g., States) level covariates;
 ’s are the individual level covariates;
 ’s are the second level covariates but considered at individual levels; and
 ’s are the residuals at individual levels.
Also,
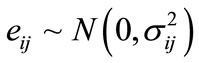
where 0 indicates mean and  as its variance.
2.3.2. Multilevel Logistic Regression Analysis
1) Random Intercept Model (MLR1)
In case of two level data structure, if pij is the probability of infant mortality, we can define
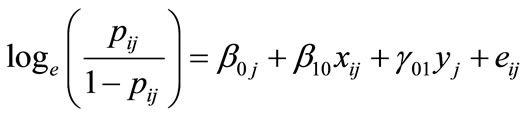
wherei = 1 to nj; j = 1 to j;
 is the random intercept; and
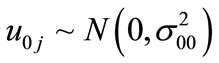
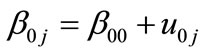 where β00 is the fixed intercept and u0j is the unique increment to the intercept associated with second level unit j; and
 , where 0 is the mean; and
 is the unconditional variance in the individual level intercepts;
 ’s are the coefficients for individual (e.g., children/ mother) level covariates;
 ’s are the individual level covariates;
 ’s are the coefficients for second (e.g., States) level covariates;
 ’s are the second level covariates considered at second level;
 ’s are the residuals at individual level.
Also,

where 0 indicates mean and  is its variance.
2) Random Intercept and Random Coefficients Model (MLR2)
In case of two level data structure, if pij is the probability of infant mortality, we can define
wherei = 1 to nj; j = 1 to j;
 is the random intercept;
 where β00 is the fixed intercept and u0j is the unique increment to the intercept associated with second level unit j; and
 , where 0 is the mean; and
 is the unconditional variance in the individual level intercepts;
 ’s are the random coefficients for individual level (e.g., children/mother) covariates; and
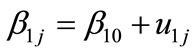 where β10 is the fixed slope at individual level and u1j is the unique increment to the coefficient associated with second level unit j; and
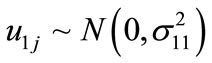 , where 0 is the mean; and
 is the unconditional variance in the individual level coefficient.
Further, the variance of second level random effects is normally described in the form of variance covariance matrix:
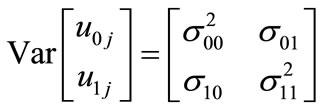
where,
 and
and  = unconditional variance in the Level-1 intercepts and slopes respectively;
 =
=  = unconditional covariance between the intercept associated with second level unit j and the coefficient associated with second level unit j;
 ’s are the coefficients for second (e.g., States) level covariates;
 ’s are the individual level covariates;
 ’s are the second level covariates considered at second level;
 ’s are the residuals at individual levels.
Also,

where 0 indicates mean and is its variance.
To emphasize again, the multilevel models correctly assume that children/mothers in same state/community are correlated in terms of community effects, which is not true under traditional logistic regression model.
2.4. Estimation Procedures
Under the traditional discrete response logistic regression models, usually maximum likelihood estimation is computationally friendly. However, for discrete response multilevel models, this procedure becomes intensive. Therefore, the multilevel models were estimated using either the iterative generalized least squares (IGLS) or reweighted IGLS using MLwiN program version 1.1. For this, Marginal Quasi Likelihood (MQL) approximation with a first order Taylor linearization followed by the 2nd order PQL procedure was applied. The coefficients were transformed to obtain rates ratio and its 95% CI, since an association was considered significant at 5% level of significance. The Walt test was used to assess significance of the coefficients. However, other than multilevel models, all analyses were carried out using STATA (version 9) and SPSS (version 14). The results related to infant mortality in India are presented in tables 1 and 2.
3. RESULTS
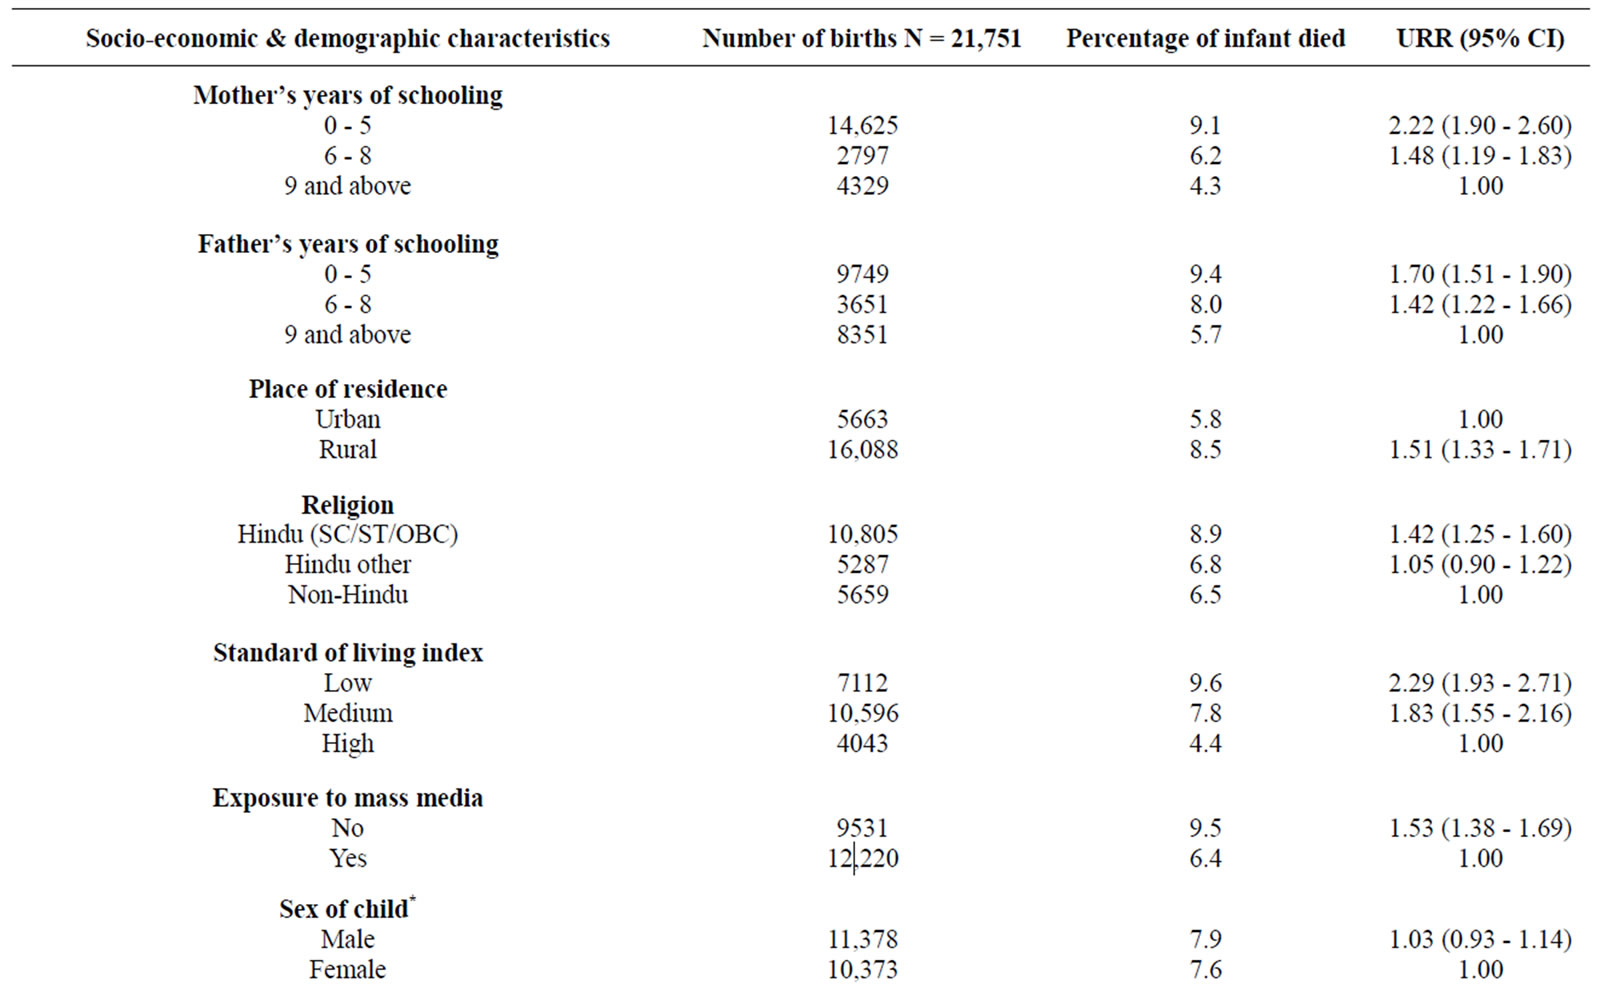
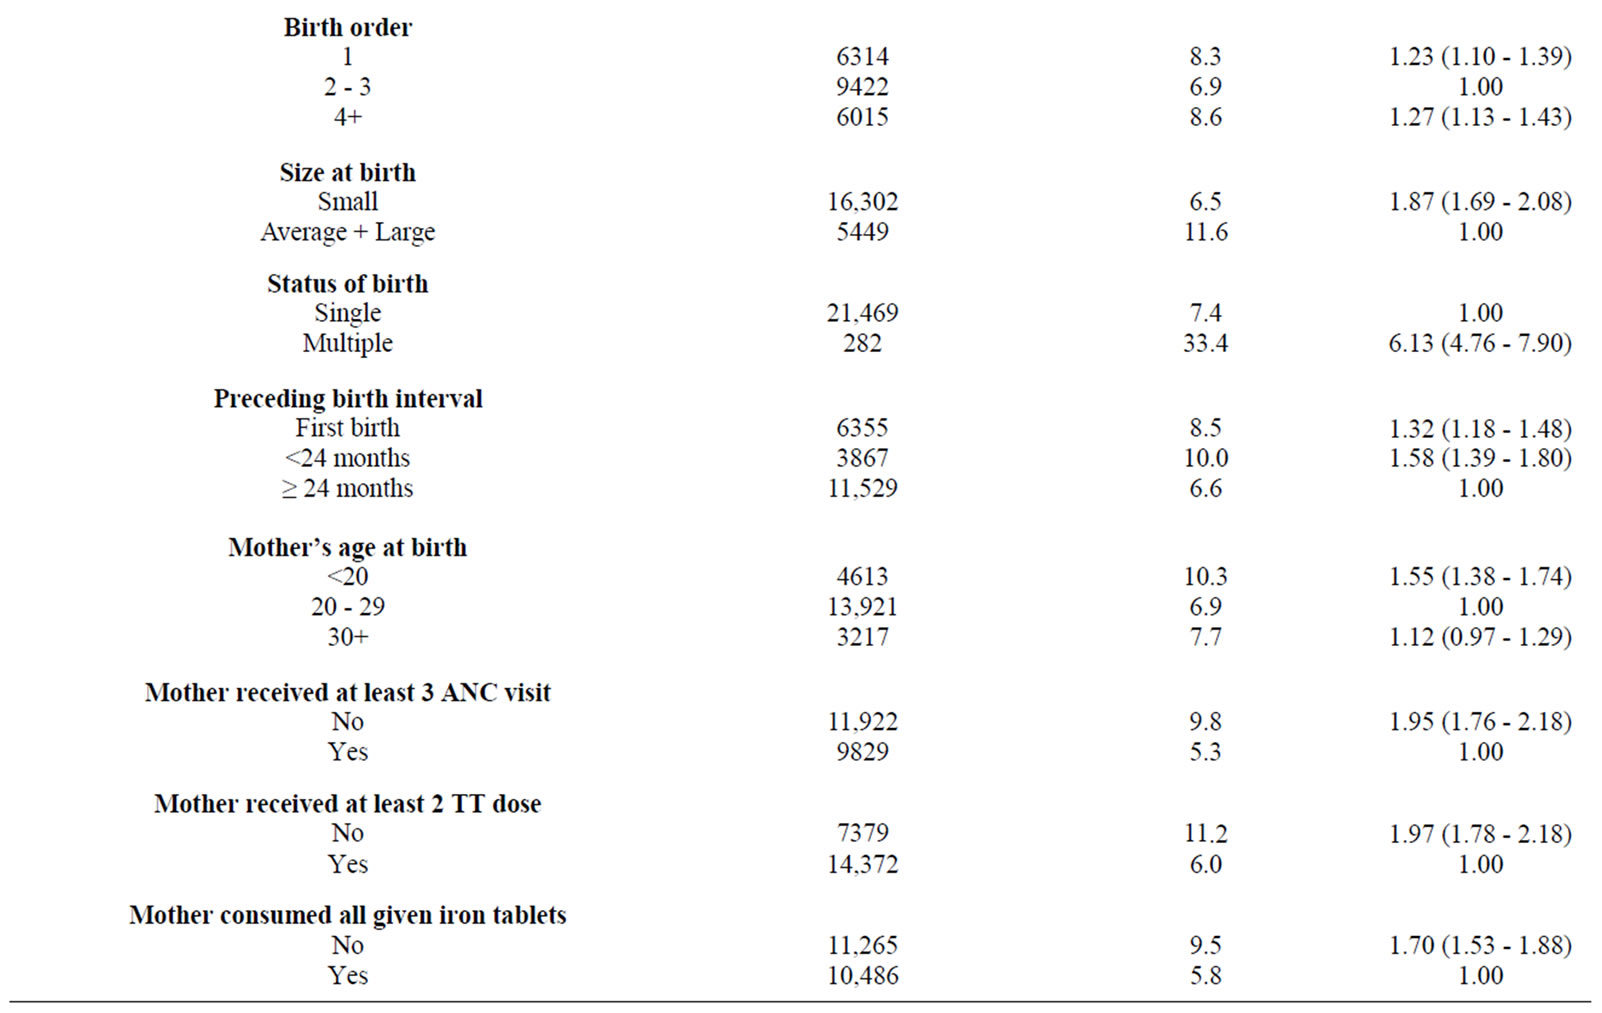
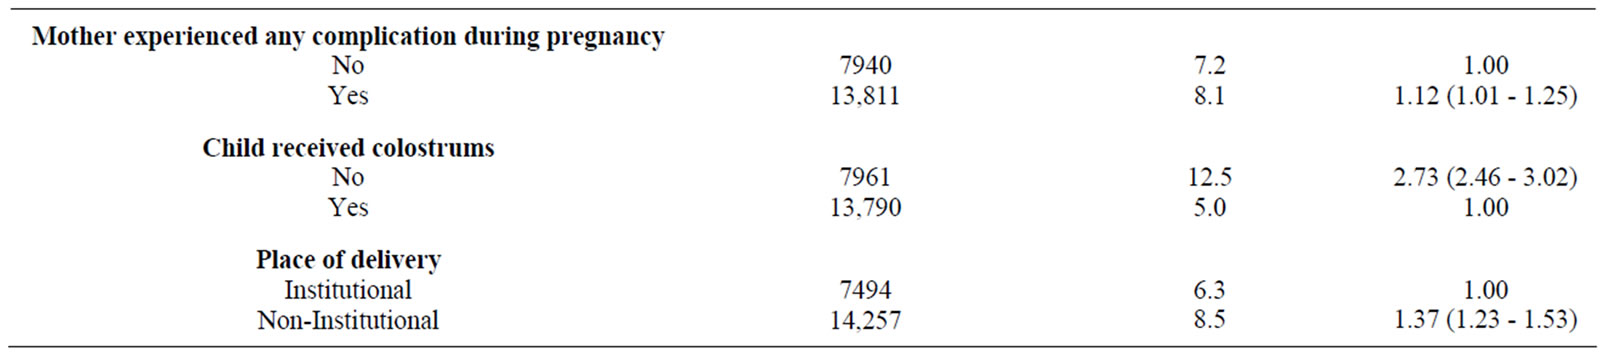
Under assessment of the community effects on infant mortality in India, the distribution of infant deaths in the relation to various socio-economic and demographic characteristics (table 1) reveals that those children are more likely to die before celebration of their first birthday; whose mothers/fathers are having low level of education [2.22 (1.90 - 2.60), 1.70 (1.51 - 1.90)]; who come from rural area [1.51 (1.33 - 1.71)]; belong to SC/ST/OBC categories [1.42 (1.25 - 1.60)]; come from families with low and medium standard of living index [2.29 (1.93 - 2.71)]; whose mothers do not have exposure to mass media [1.53 (1.38 - 1.69)]; whose mothers are with one and also four and above birth order [1.23 (1.10 - 1.39)]; who have small size at birth [1.87 (1.69 - 2.08)]; are multiple births [6.13 (4.76 - 7.90)]; are either first birth or born before 24 months of age of previous child [1.32 (1.18 - 1.48)]; whose mothers are youngsters below 20 years of age [1.55 (1.38 - 1.74)]; whose mother did not receive three ANC check-up visits [1.95 (1.78 - 2.18)]; whose mothers did not receive two tetanus (TT) dose [1.97 (1.78 - 2.18)]; whose mothers experienced any kind of complication during pregnancy [1.12 (1.01 - 1.25)]; who did not receive colostrums [1.37 (0.23 - 1.53)] and those who were delivered at non-institutional places [2.73 (2.46 - 3.02)]. Likewise, those children are more likely to die before completing one year of age; whose State of residence involves lower level of awareness about use of ORS among mothers [1.68 (1.52 - 1.86)]; higher percentage of births of order four and above [1.56 (1.41 - 1.73)]; lower percentage of women with middle schools and above education [1.69 (1.52 - 1.87)]; and government’s per capita expenditure on health less than average [1.18 (1.06 - 1.31)].
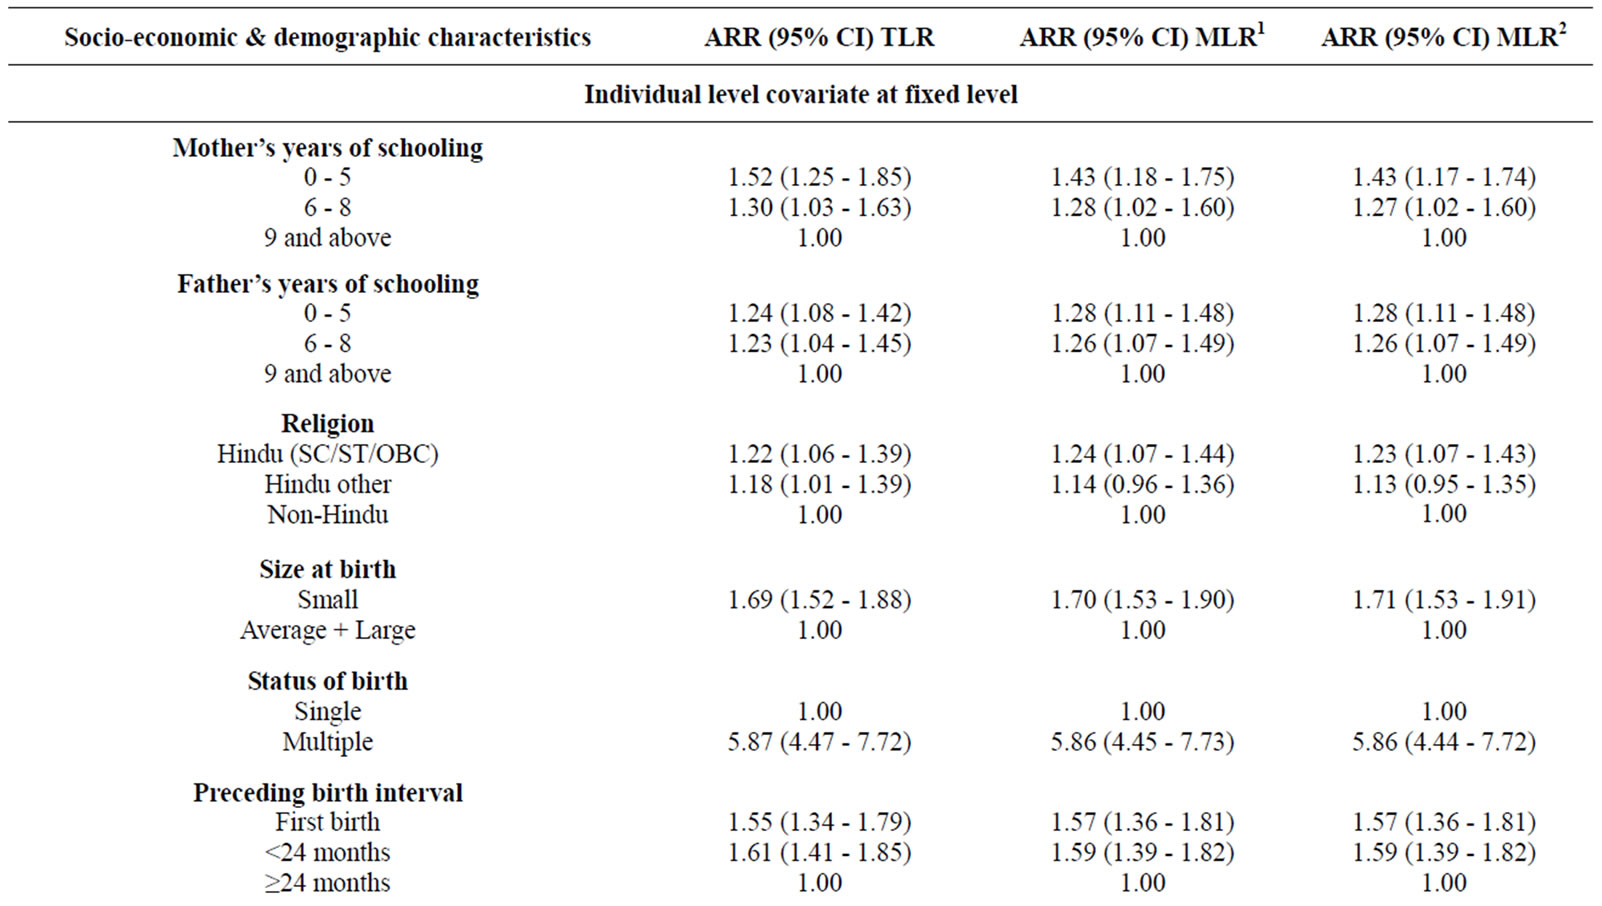
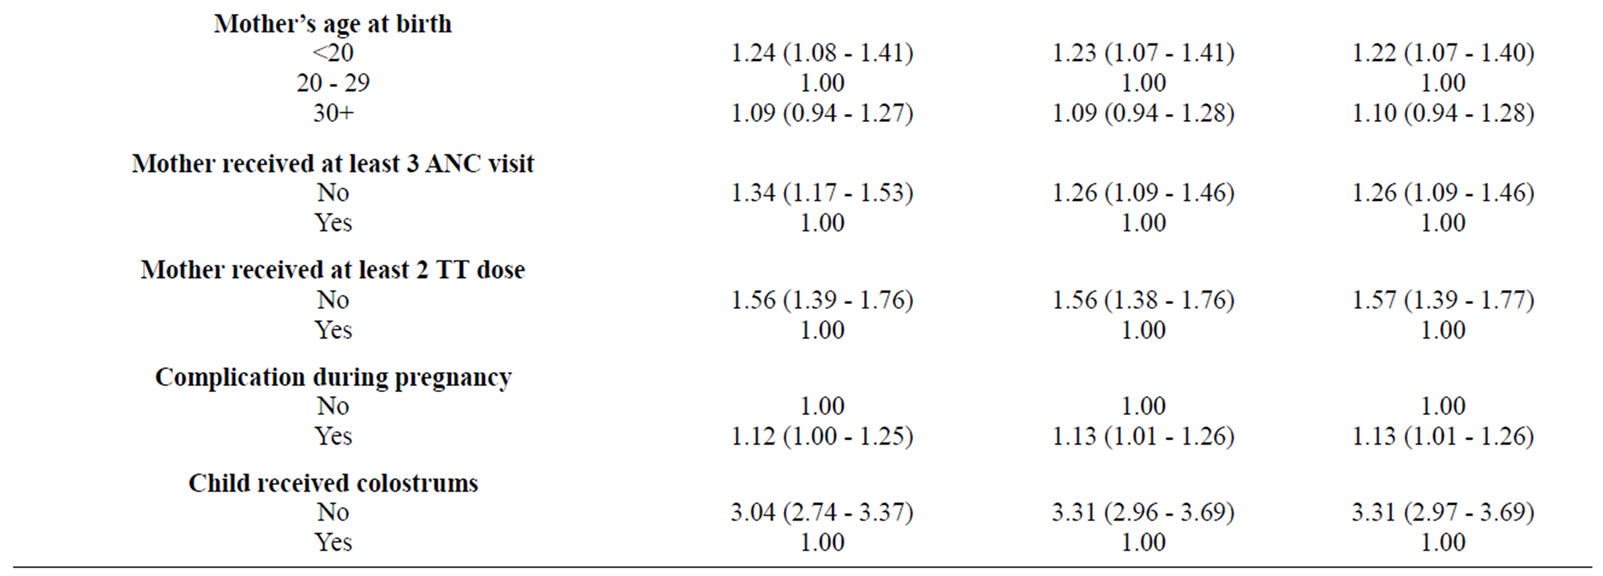
The variables retained in the model through traditional analysis (table 2) include mother’s years of schooling [1.43 (1.17 - 1.74)]; father’s years of schooling [1.28 (1.11 - 1.48)], religion [1.23 (1.07 - 1.43)], size at birth [1.71 (1.53 - 1.91)], preceding birth interval [1.57 (1.36 - 1.81)], mother’s age at birth [1.22 (1.07 - 1.40)], mothers receiving at least three antenatal check-ups [1.26 (1.09 - 1.46)], mothers receiving at least two TT doses [1.57 (1.39 - 1.77)], complication during pregnancy [1.13 (1.01 - 1.26)], and children receiving colostrums [3.31 (2.97 - 3.69)]. In addition, among community (i.e., State) level covariates, only % of woman with middle school and above [1.56 (1.26 - 2.18)] and % of woman with any anemia [0.85 (0.56 - 1.30)] entered in the model. For comparison purpose, the same sub-set of covariates was included while carrying out multi level analysis.
As evident from table 2, in general, the results under multilevel analysis (MLR1) and (MLR2) involve comparatively broader confidence interval in comparison to traditional logistic regression analysis (TLR). The results in relation to individual level covariates seem to be almost identical under both models. The community level covariates were retained at fixed level under random intercept model (MLR1) where as at random level under random coefficient model (MLR2). However, the results in relation to community level characteristics like % of woman with middle school and above education and that of with any anemia in the States were slightly different
 (a)
(a)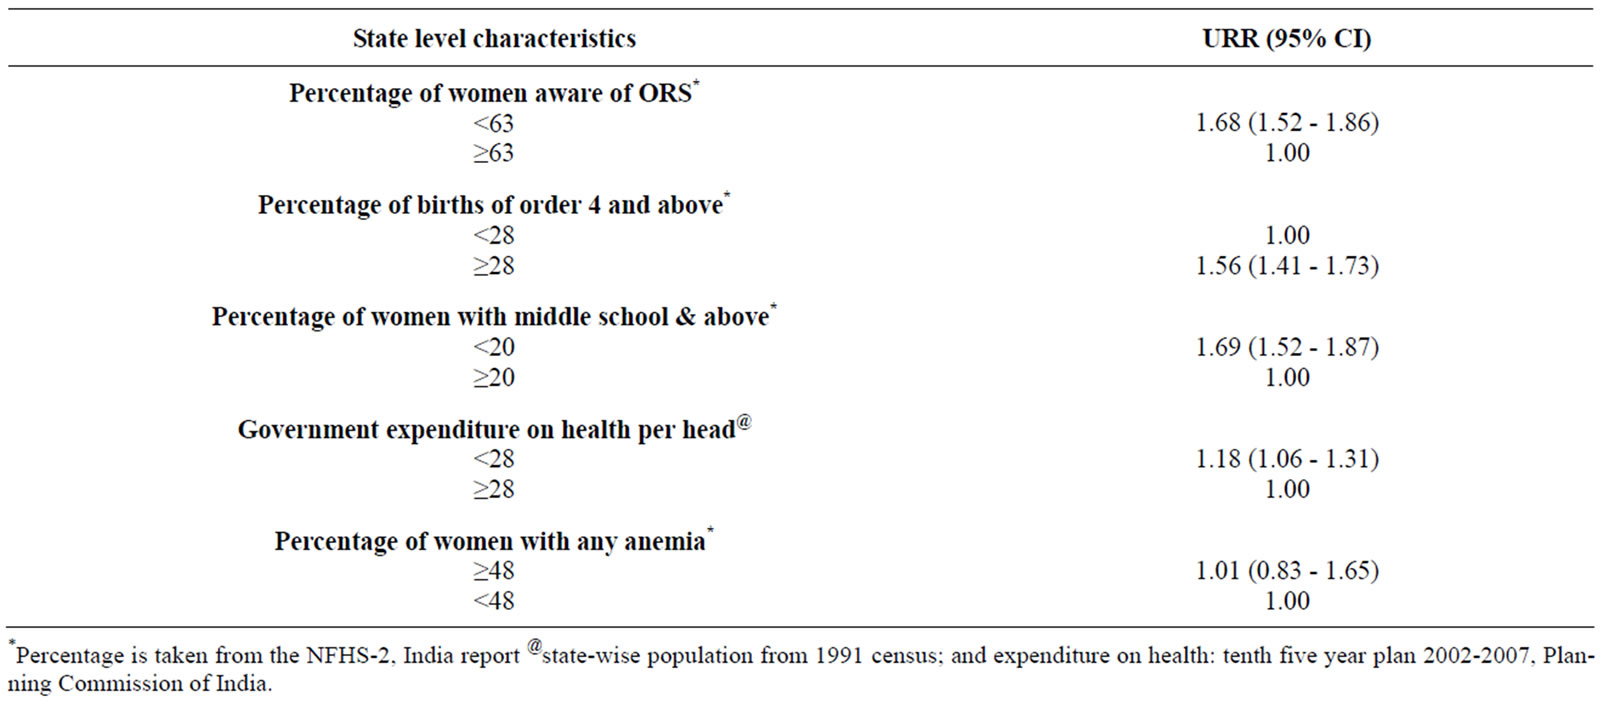 (b)
(b)
Table 1. Percentage of infant died according to their socio-economic & demographic characteristics in India and related unadjusted risk ratio (URR) and corresponding 95% confidence interval (95% CI).
under these two analyses especially in relation to confidence intervals. Further, to be specific, the children whose mothers were having low level of education of 0 - 5 years schooling were at 43% more chance to die before celebrating their first birthday [1.43 (1.17 - 1.74)]. Likewise, children whose fathers were having low level of education with 0 - 5 years of schooling also had 28% more chance to die during infancy [1.28 (1.11 - 1.48)]. The children whose parents were from SC/ST/OBC categories had 23% more chance of experiencing infant mortality [1.23 (1.07 - 1.43)]. Also, the children whose size at birth was comparatively small had 71% more chance of dying before reaching to first birthday [1.71 (1.53 - 1.91)]. Similarly, the children born as a first birth after return marriage had 57% more chance [(1.57 (1.36 - 1.81)]; the children born before 24 months of previous birth had 59% more chance [(1.59 (1.39 - 1.82)]; whose mothers were comparatively younger of age below 20 years had 22% more chance [1.22 (1.07 - 1.40)]; whose mothers did not receive at least three ANCs had 26% more chance [1.26 (1.09 - 1.46)]; whose mothers did not receive at least two TT dose had 57% more chance [1.57 (1.39 - 1.77)]; whose mothers experienced complication during pregnancy had 13% more chance of dying before completing their one year of age [1.13 (1.01 - 1.26)]. Surprisingly, even after adjusting other covariates, the children born multiple at birth had almost six times more chance of dying before celebration of their first birthday in comparison to those who born single [5.86 (4.44 - 7.72)]. Likewise the children who did not receive colostrums had more than three fold chance of dying during infancy [3.31 (2.97 - 3.69)]. Among the community level characteristics, as per random coefficient model, the children who belong to a community having low level of middle school and above education had 56% more chance of dying during infancy [1.56 (1.12 - 2.18)]. However, extent of any anemia among women did not turn up to be statistically associated with infant mortality [0.85 (0.56 - 1.30)].
In contrary to single level analysis [i.e., traditional logistic regression (TLR)], if covariates belong to more than single level, the multilevel logistic regression analysis not only provides accurate results but also provides some more useful information. The random intercept model (MLR1) assumes that every State has its own intercept, but all States share a common coefficient (with respective standard error) for each of the covariates. Thus, as such, only the intercepts vary across the States.
 (a)
(a)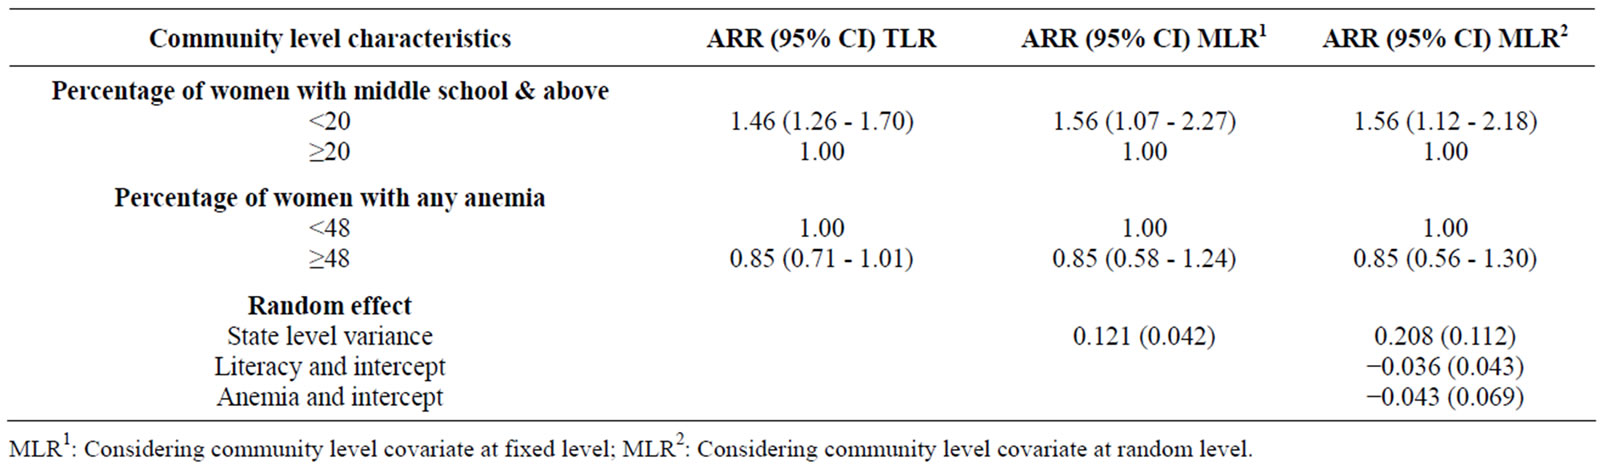 (b)
(b)
Table 2. Adjusted risk ratio (ARR) and corresponding 95% confidence interval (95% CI) for the infant death in India by socio economic and demographic characteristics using traditional (TLR) and multilevel logistic regression (MLR) analysis.
The intercept for State j is −4.699 + u0j, where the variance of u0j is estimated as 0.121 (with standard error of 0.042). Hence, even after consideration of these covariates, variation in infant mortality between States remains significant. Such genuine exploration is not possible under TLR.
Under the above model, the probability of infant mortality was allowed to vary across States, however, the effects of the explanatory variables were assumed to be same for each State. Under random coefficient model (MLR2), as a modification in this assumption, the coefficients related to % of women with middle education & above and % of women with any anemia were also assumed to vary across the States. The results indicate that the effect of % of women with middle school and above does indeed vary across States. As obvious, the results further indicate that State level variation in the probability of infant mortality is higher in communities having low % of women with middle school and above than their counterparts. Likewise, State level variation in the probability of infant mortality is likely to be higher in communities having high % of women with any anemia than their counterparts.
4. SUMMARY AND CONCLUSIONS
Keeping into account the findings under the present study, for a data involving hierarchical structure, there is need to emphasize the use of hierarchical models (i.e., multilevel models) instead of compromising with traditional models. To further emphasize, using traditional models in such circumstances, may result not only distortion in results but also distortion in policy implications. As a result of distortion in public health/family welfare programs, because of obvious reasons, economy of the community may also get adversely affected.
The variation in infant mortality between States still remains significant. Further, the effect of % of women with middle school and above does indeed vary across States. Also, State level variation in the probability of infant mortality is higher in communities having low % of women with middle school and above than their counterparts. Likewise, State level variation in the probability of infant mortality is likely to be higher in communities having high % of women with any anemia than their counterparts. In summary, community level developmental indicators still vary significantly across the communities and also their effects on public health. To optimize the use of available resources, these results still suggest the need of focusing more public health programs in areas having comparatively poor status.
5. ACKNOWLEDGEMENTS
The authors are thankful to the Indian Council of Medical Research to support this analytical research as a Task Force Project in Statistics. Further, they are equally thankful to the All India Institute of Medical Sciences for extending needful timely support in all respects.
![]()
![]()
REFERENCES
- Bryk, A.S. and Raudenbush, S.W. (1992) Hierarchical linear models (applications and data analysis methods). Sage Publications, New York.
- Goldstein, H. and Healy, M.J.R. (1995) The graphical presentation of a collection of means. Journal of the Royal Statistical Society Series A, 158, 175-177. doi:10.2307/2983411
- Mosley, W.H. (1984) Child survival: Research and policy. Population and Development Review, 10, 3-23. doi:10.2307/2807953
- Nath, D.C., Kenneth, C.L. and Talukdar, P.K. (1994) Most recent birth interval in a traditional society: A life table and hazards regression analysis. Canadian Studies in Population, 21, 149-164.
- Kalbfleisch, J.D. and Prentice, R.L. (1980) The statistical analysis of failure time data. John Wiley and Sons, New York.
- Cox, D.R. (1972) Regression models and life tables (with discussion). Journal of Royal Statistical Society, B34, 187-220.
- Menken, J., Trussel, J., Stempel, D. and Bahakol, O. (1981) Proportional hazard life table models: An illustrative analysis of socio-economic influences on marriage dissolution in the United States. Demography, 18, 181-200. doi:10.2307/2061092
- Retherford, R.D. and Minja, K.C. (1993) Statistical models for casual analysis. John Wiley & Sons, Inc., New York. doi:10.1002/9781118033135
- Trussell, J. and Charles, H. (1983) A hazards model analysis of the covariates of infant and child mortality in Sri Lanka. Demography, 20, 1-24. doi:10.2307/2060898
- Namboodiri, N.K. and Suchindran, C.M. (1987) Life table techniques and their applications. Academic Press, Orlando.
- Kleinbaum, D.G. (1996) Survival analysis. Statistics in health sciences. Springer-Verlag, New York.
- Nath, D.C., Land, K.C. and Singh, K.K. (1994) Birth spacing, breastfeeding, and early child mortality in a traditional Indian society: A hazard model analysis. Social Biology, 41, 168-180.
- Hobcraft, J.J., McDonald, W. and Rustien, S. (1983) Childspacing effects on infant and early child mortality. Population Index, 49, 585-618. doi:10.2307/2737284
- Maine, D. and McNamara, R. (1985) Birth spacing and child survival. Center for Population and Family Health, School of Public Health, Faculty of Medicine, Columbia University, New York.
- UNFPA (1997) Reproductive rights, reproductive health and family planning: Population issues.
- Khorshed, A.B.M., Alam, M. and James, F.P. (1990) A multivariate analysis of social and economic determinants of neonatal and infant mortality in four rural thanas of Bangladesh. Demography India, 19, 167-182.
- Swenson, I.E., Nguyen, M.T., Pham, B.S., Vu, Q.N. and Vu, D.M. (1993) Factors influencing infant mortality in Vietnam. Journal of Biosocia Science, 25, 285-302. doi:10.1017/S0021932000020630
- Bloland, P., Slutsker, L., Steketee, R.W., Wirima, J.J., Heymann, D.L. and Breman, J.G. (1996) Rates and risk factors for mortality during the first two years of life in rural Malawi. American Journal of Tropical Medicine and Hygiene, 55, 82-86.
- Koeing, M.A., Phillips, J.A., Campbell, O. and D’Souza, D. (1990) Birth intervals and childhood mortality in rural Bangladesh. Demography, 27, 251-265. doi:10.2307/2061452
- Miller, J.E., Trussell, J., Anne, R.P. and Barbara, V. (1992) Birth spacing and child mortality in Bangladesh and the Philippines. Demography, 29, 305-316. doi:10.2307/2061733
- Mturi, A.J. and Curtis, S.L. (1995) The determinants of infant and child mortality in Tanzania. Health Policy Plan, 10, 384-394. doi:10.1093/heapol/10.4.384
- Ronsman, C. (1996) Birth spacing and child survival in Rural Senegal. International Journal of Epidemiology, 25, 989-997. doi:10.1093/ije/25.5.989
- Manda, S.O. (1999) Birth intervals, breastfeeding and determinants of childhood mortality in Malawi. Social Science Medicine, 48, 301-312. doi:10.1016/S0277-9536(98)00359-1
- Chaudhary, S.B., Ibrahim, K.R. and Md. A.M. (2000) Impact of some biosocial variables on infant and child mortality. Demography India, 29, 211-221.
- Palloni, A. and Millman, S. (1986) Effects of inter-birth intervals and breastfeeding on infant and early childhood mortality, population. Studies, 40, 215. doi:10.1080/0032472031000142036
- Pandey, A., Minja, K.C., Norman, Y.L., Damodar, S. and Jagdish, C. (1998) Infant and child mortality in India. National Family Health Survey Subject Reports No. 11, IIPS, Bombay and East West Centre Program on Population, Honolulu.
- Arnold, F., Minja, K.C. and Roy, T.K. (1998) Son preference, the family-building process and child mortality in Inida. Population Studies, 52, 301-315. doi:10.1080/0032472031000150486
- International Institute for Population Sciences (IIPS) (2000) National family health survey, India, 1992-1993.
- Dwivedi, S.N. and Sundaram, K.R. (2000) Epidemiological models and related simulation results for understanding of contraceptive adoption in India. International Journal of Epidemiology, 29, 300-307. doi:10.1093/ije/29.2.300
- Steele, F., Diamond, I. and Wang, D. (1996) The determinants of contraceptive use in China: A multilevel multinomial discrete hazards modelling approach. Demography, 33, 12-24. doi:10.2307/2061710