Health
Vol. 4 No. 4 (2012) , Article ID: 18864 , 7 pages DOI:10.4236/health.2012.44039
The difference in enteral nutrition (EN) versus total parenteral nutrition (TPN) in acute pancreatitis by etiology and disease severity
![]()
1Division of Internal Medicine, Department of Internal Medicine, Cooper University Hospital, Camden, USA;
*Corresponding Author: mok-shaffer@cooperhealth.edu
2Division of Gastroenterology, Department of Internal Medicine, Cooper Digestive Health Institute, Camden, USA
Received 19 December 2011; revised 8 January 2012; accepted 29 January 2012
Keywords: Nutrition; Pancreatitis; TPN; Enteral; BISAP
ABSTRACT
Background: Supplemental nutrition improves long-term outcomes/mortality in acute pancreatitis, with Enteral Nutrition (EN) superior to Total Parenteral Nutrition (TPN). Differences in EN/TPN based upon etiology or disease severity have never been established. Methods: We performed a randomized retrospective case control on subjects admitted to Cooper University Hospital from 06/2007 to 01/2010 with acute pancreatitis who received supplemental nutrition (n = 161). These subjects were examined for caloric and protein demands. Subjects were matched for demographics, weight, albumin, prealbumin eliminating confounders. Demands among disease etiology/severity subgroups and statistical significance were determined. The incidence of EN v.TPN was determined. Results: Significant differences were found in total caloric demands, namely gallstone (n = 50) and alcohol (n = 36) (p = 0.04). Differences in protein demand were not established between these two groups (p = 0.24). Differences in caloric demand were found in bed-side index for severity in acute pancreatitis (BISAP) of 1, 2 and 3 versus 5. Protein demands were different between BISAP of 0 versus all others. 24% of the sample received EN. Conclu: sion: There are significant differences in total caloric demands for subjects with acute pancreatitis by disease severity and in gallstone versus alcohol-induced pancreatitis. These differences are not variations in the sample populations. Finally, EN is under-utilized despite knowledge of its value.
1. INTRODUCTION
The first reported review of acute pancreatitis was a 53-subject case series in 1889, by Reginald Huber Fitz, at Massachusetts General Hospital [1-4]. Since the time of Fitz we have defined several etiologies and formulated numerous methods for staging the disease severity of acute pancreatitis [5,6]. Although there are thousands of studies on acute pancreatitis, the treatment of etiologybased subpopulations has remained somewhat less understood and uniform [7]. One homogenous treatment is that of supplemental nutrition in subjects with acute pancreatitis.
Researchers have examined the impact of carbohydrates, lipids and proteins on pancreatic secretion. The conclusion of these animal studies is that intravenous (IV) nutrition through Total Parenteral Nutrition (TPN) increased pancreatic enzyme secretion and exacerbated the autodigestive process, while enteral nutrition (EN), decrease pancreatic secretion [8-13]. The result of these findings has led to a significant difference in mortality, multiple organ failure (MOF), operative intervention, systemic infection and septic complication, favoring EN when compared to TPN [14-20].
The value of lower mortality, decreased incidence of MOF, operative intervention, systemic illness and local septic complications when using EN versus TPN in patients with acute pancreatitis appears to be substantiated. However, none of the 779 studies performed have truly examined the difference in these benefits based upon the etiology or disease severity of acute pancreatitis. Additionally, EN is still underutilized in the setting of acute pancreatitis as a means of supplemental nutrition, despite its defined benefits [21,22].
In this study we shall demonstrate a statistically significant difference in the total caloric and total protein requirements of supplemental nutrition in acute pancreatitis patients. This difference will be based upon disease etiologies and severity, defined by BISAP score. Moreover, this study shall set out to demonstrate that despite the conclusive data favoring EN versus TPN, that a large percentage of the study population will still receive TPN.
2. METHODS
2.1. Study Design
This retrospective case series study was approved by the IRB at Cooper University Hospital and protocol was consistent with all ethical guideline set forth by the declaration of Helsinki. Eligible subject data was screened by admission diagnosis of acute pancreatitis to Cooper University Hospital from June 2007 to January 2010.
Subjects were included by the following criteria; the initiation of EN or TPN during the course of their hospital admission, performance of vital signs, mental status examination, subject weight within 24 hours of admission, albumin, prealbumin levels, blood urea nitrogen (BUN) testing, white blood cell count (WBC), radiographic imaging to examine for pleural effusions. Subjects were excluded if they were under the age of 18 years old, did not receive alternative nutrition, did not meet the necessary components for determining BISAP score or systemic inflammatory response syndrome criterion (SIRS) (Appendix 1 and 2 respectively) [5,6]. This yielded a sample size of 161 (n = 161) for the etiology based group with one subject excluded for the severity based group as there was not sufficient data to perform the BISAP score (Appendix 1.0).
2.2. Subgroups Analysis
Initial subgroup analysis separated subjects into etiologybased categories. Secondary subgroup analysis divided subjects based upon disease severity. To determine disease severity, the Bedside Index for Severity in Acute Pancreatitis or BISAP score was utilized “Appendix 1” [5]. Age of subjects enrolled was entered in a data sheet to meet the BISAP criterion of age greater than or equal to 60. To establish the Systemic Inflammatory Response Syndrome (SIRS) criterion, subject temperature, heart rate, respiratory rate, white blood cell count and percent immature forms on admission were recorded “Appendix 2.0” [6]. Subjects that met 2 or more of these criteria were considered to meet the criteria for SIRS. Blood Urea Nitrogen (BUN) was recorded and if greater than or equal to 25 was considered positive. Finally the presence of impaired mental status on admission and pleural effusions was recorded as the final 2 criteria for the BISAP score. Subject BISAP Scores were scaled on a basis of zero to five, with five being the most severe form of pancreatitis.
2.3. Calculating Nutritional Requirements
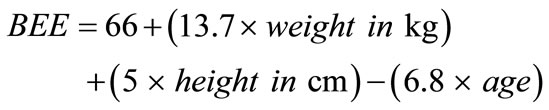
Of the 161 subjects enrolled in this study, the data were analyzed for etiology of pancreatitis, date of initiation of alternative nutrition, type of alternative nutrition initiated. After alternative nutrition was initiated, subjects mean total caloric demands in kilocalories (kCal) and mean total protein demands in grams (gm) were calculated. The caloric demands were computed first based upon subject age, height and weight and sex utilizing the Harris-Benedict basal energy expenditure (BEE) [15]. This formula in males is:
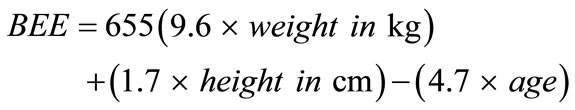
In females:
To calculate the Total Energy Expenditure (TEE), the BEE was then multiplied by the stress/activity factor (Appendix 3.0). Initial Protein demands were calculated by evaluating subject stress/activity level by factors estimating 10% - 15% of TEE as protein demand (Appendix 4.0).
After the initial baseline was calculated, daily weight, serum albumin every 18 to 20 days and prealbumin every 2 - 3 days measurements were performed to assess improving nutritional status. Disease states such as end stage renal disease, cardiovascular disease, diabetes and chronic obstructive pulmonary disease were accounted for, as these states are known to alter nitrogen elimination.
2.4. Statistical Analysis
Sample size was calculated based upon population prevalence of patients with acute pancreatitis utilizing a Z score of 1.96 and Confidence interval of 95%.
The subjects were separated based upon disease etiology and severity defined as BISAP score “Appendix 1.” This group analysis was examined, as above, for date of alternative nutrition initiation, total caloric demands and total protein demands. Mean, standard deviation and standard error of mean for this data were calculated and p values were extrapolated utilizing standard t-Test analysis. Appropriate CI was calculated based upon Z-score analysis utilizing 1.96 when p values were under 0.05, but 2.25 when p values were under 0.01. The incidence of TPN and EN was determined by the number of occurrences of TPN/EN divided by the total sample population (n = 161). Sample population data were plotted on linear xy scatter plots. Total caloric and protein demands were graphed on double y-axis linear charts.
3. RESULTS
3.1. Study Population
The sample population (n = 161) was matched by sex, age and race “Table 1 and Table 2.” The average age, weight, albumin and prealbumin levels of the gallstone (n = 50) and alcohol (n = 36) induced groups showed no statistically significant differences (p = 0.53, 0.59, 0.81 and 0.42 respectively). Similar trends were seen amid all etiology-based subgroups. Correspondingly, the severity based subgroups showed no statistically significant difference when comparing the average age, weight, prealbumin and albumin. Linear xy data plot showed clustering of this data between both the etiology and severity based sub populations indicating low variability amongst these population components.
3.2. Nutritional Demands of Etiology Based Subpopulation
The most prevalent populations observed were the gallstone (n = 50) and alcohol induced (n = 36) subgroups. A significant difference in the total caloric demands was detected for subjects with gallstone-induced pancreatitis, when compared with alcohol-induced pancreatitis (1916.02 mean kCal v. 2071.00 mean kCal, p < 0.040. Comparing other study subpopulations, statistically significant differences were found, sample sizes were small.
The protein demands were also compared amongst the etiology sub groups, showing no statistically significant difference between the gallstone and alcohol induced subpopulations (97.84 gm versus 106.08 gm, p value = 0.24). Again, significant differences were shown among the other etiology-based subgroups, however the sample sizes were small.
3.3. Nutritional Demands of Severity/BISAP Score Based Subpopulation
The total sample size (n = 160) was also subdivided by disease severity using BISAP score. One subject was excluded, as all of the criterion was not met to establish a BISAP score. When the data were analyzed diseased with respect to severity via the BISAP score, the results showed significant differences between the mean caloric demands of BISAP score of 1 (2061.80 kCal), BISAP score 2 (2026.96 kCal) and BISAP score 3 (2053.64 kCal) when compared to the total caloric demands of a BISAP score of 5 (1676.00 kCal) (p < 0.04, p < 0.05 and p < 0.05).
Protein demand of the subpopulation showed that the BISAP score of 0 (85.41 kCal) was significantly different when compared to the protein demands of BISAP scores of 1 (102.78 kCal, p < 0.01), 2 (109.30 kCal, p < 0.003),
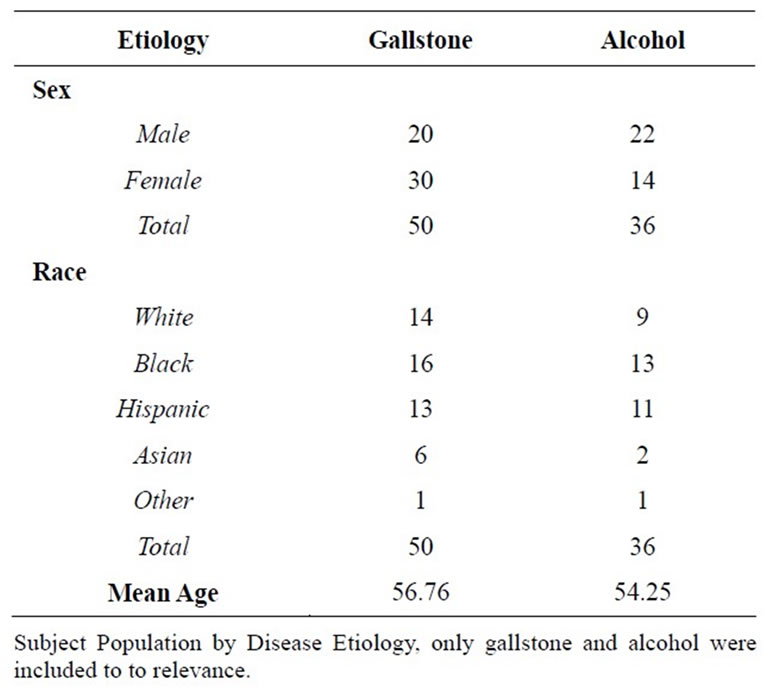
Table 1. Study population by disease etiology.
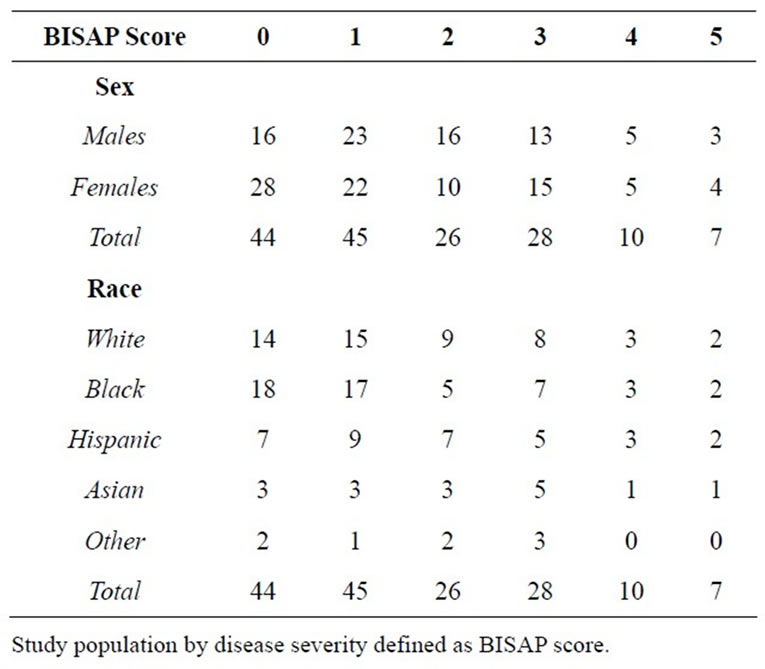
Table 2. Study population by disease severity.
3 (119.89 kCal, p < 0.00), 4 (110.30 kCal, p < 0.02), and 5 (109.86 kCal, p < 0.04). Finally the protein demand of a BISAP score of 1 (102.78 mean kCal) was significantly different when compared to the protein demands of a BISAP score of 3 (119.89 mean kCal, p < 0.04).
3.4. Enteral Nutrition Versus Total Parenteral Nutrition
In the etiology-specific sample population, of the 161 subjects, 37 subjects (n = 161, 22.98%) received EN (Table 3). Similarly, in the disease severity subgroup, only 37 of 160 (n = 160, 23.13%) received EN (Table 4). The only subgroup in which a larger number of subjects received EN versus TPN was that of infectious etiology (7 out of 12, 58.33%).
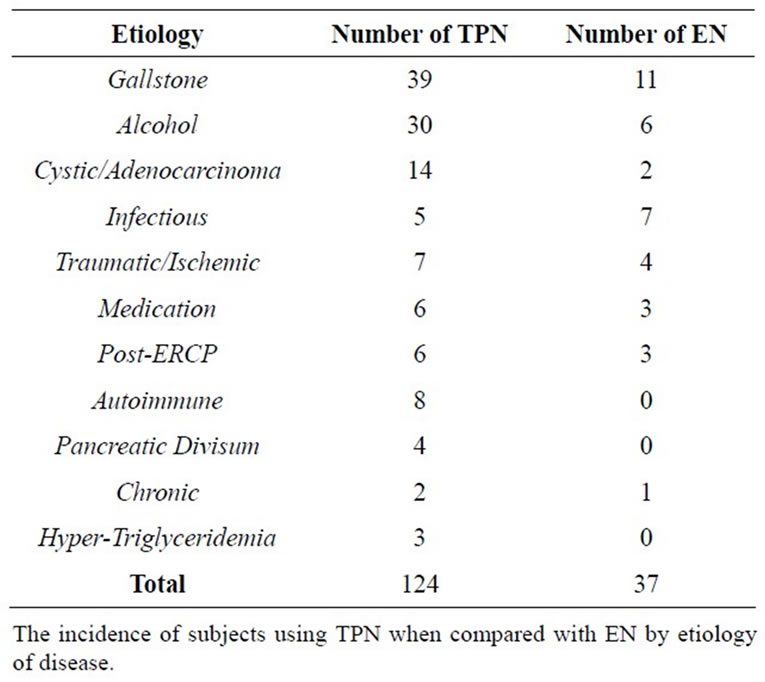
Table 3. Total parenteral nutrition versus enteral nutrition in pancreatitis by disease etiology.
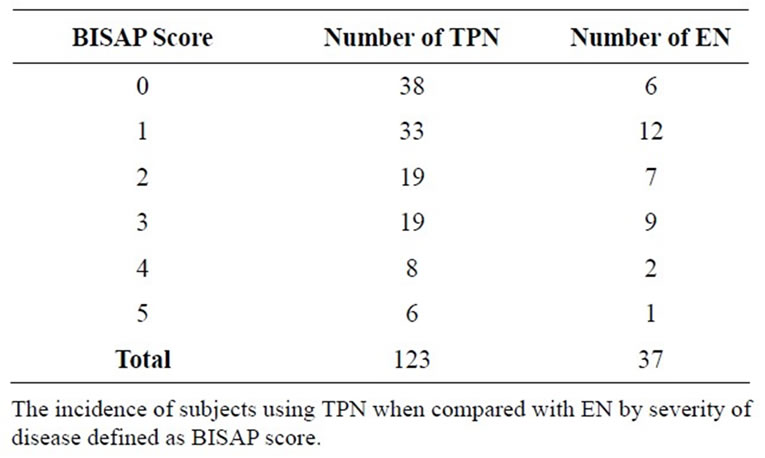
Table 4. Total parenteral nutrition versus enteral nutrition in pancreatitis by disease severity.
4. DISCUSSION
In this study, a significant proportion of the total sample size was composed of both gallstone (n = 50) and alcohol induced pancreatitis (n = 36). This composition was consistent with patient populations found in most hospitals in the United States. Analysis between the gallstone and alcohol induced subgroups showed a statistically significant difference in the total caloric demands (p < 0.04) Figure 1. Based upon the calculations used for TEE, we then set out to determine if this difference is based upon disease etiology or whether the components of this calculation were confounders to our data.
Included in the TEE calculation are subject weight, age and sex to calculate BEE and stress/activity factors [15]. When matching our sample population for these parameters, the study showed no significant difference between the subject age, weight, prealbumin and albumin levels, along with similar sex and race distributions among all sample populations. Therefore differences in the total caloric demands of the alcohol and gallstone subgroups likely were due to inherent distinctions in catabolic stress and not variability within the sample population. Additionally, the differing catabolic states of these etiologyspecific subgroups may have indicated variation in their pathophysiology, though not confirmed by our data.
When examining the protein demands of the gallstone and alcohol subpopulations, no significant difference was found (p = 0.24) Figure 1. In this case, calculating protein demand required the measurement of prealbumin and albumin over time. The measurement of prealbumin and albumin were not found to have statistically significant differences (p = 0.81, 0.42 prealbumin and albumin respectively), which is the likely explanation for the findings among mean protein demands of the etiologybased subgroups. Other differences were seen between the protein and total caloric demands of the etiologybased subgroups, however the size of the subpopulations may limit extrapolation of study data into clinical practice.
Another practical application of our study was to determine if a difference exists in total caloric and protein nutrition among varying degrees of disease severity. In this study, we defined disease severity via the BISAP score [5,6]. As expected, BISAP scores of 0 had a lower total caloric demand when compared with BISAP scores of 1 - 3. Analysis of the total caloric demands concluded statistically significant differences between the BISAP score of 1 - 3 (p < 0.04, p < 0.05, and p < 0.05 respectively) when compared with the most severe BISAP score of 5. An interesting trend in BISAP sub-groups is that scores of 1 - 3 showed higher total caloric demands when compared to BISAP scores of 4 - 5 Figure 2. One possible hypothesis is that with progressive pancreatic tissue necrosis, the unit-based catalytic process may be high but with less viable tissue remaining.
Within the BISAP sub group analysis were trends in protein demands. BISAP scores of 0 showed significant differences in mean protein demands when compared with all other BISAP scores. This may have indicated that protein demands increase from less severe acute pancreatitis and then plateau as severity increases Figure 2.
In addition finding differences amongst nutrition by disease etiology and severity, this study also illustrated trends in the method of supplemental nutrition delivery. Early animal models using intravenous nutrition have shown an increase in pancreatic secretion via stimulation with amino acids such as L-tryptophan and L-phenylalanine, as well as with high fat content infusions [8-10]. As a result, TPN can cause an increase in pancreatic secretion that further exacerbates the autodigestive processes in acute pancreatitis [11-13]. Conversely, a decrease in pancreatic secretions through feedings distal to
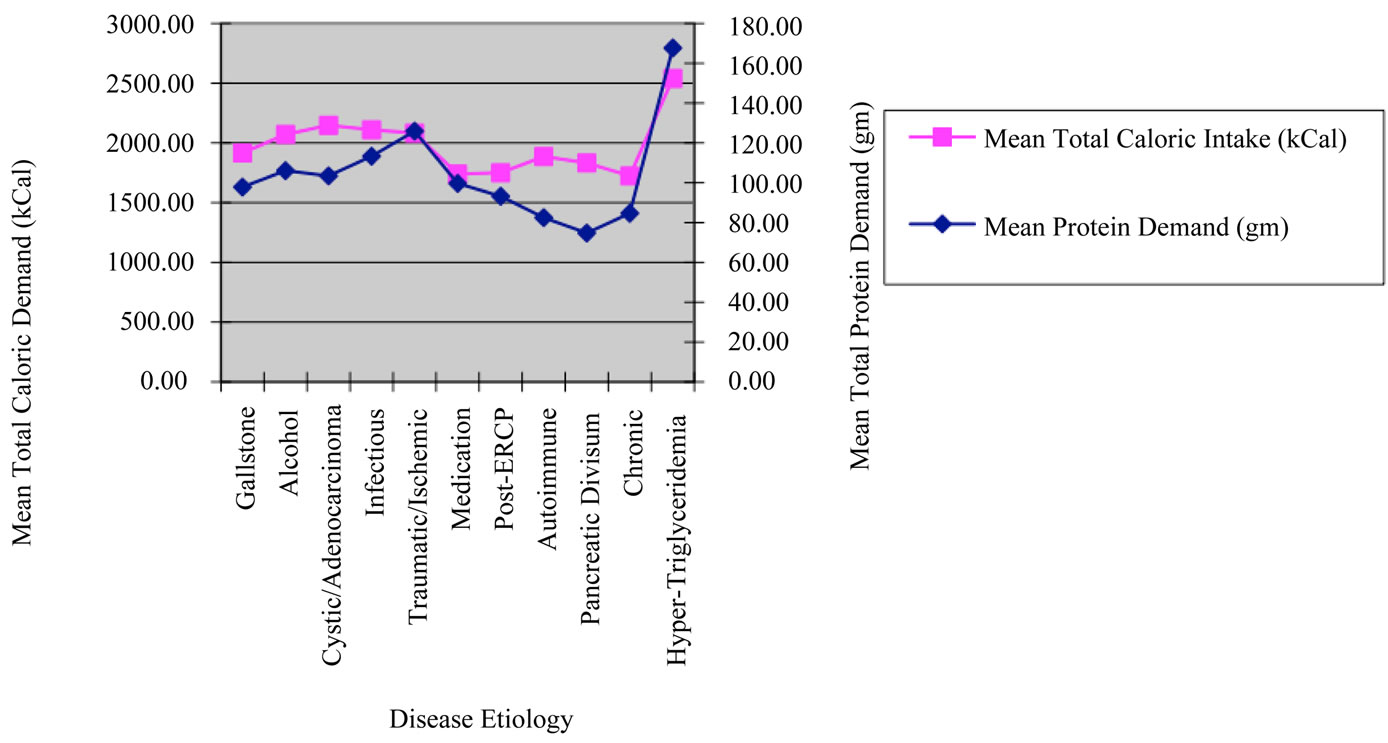
Figure 1. Mean caloric and protein demands of sample population by disease etiology.
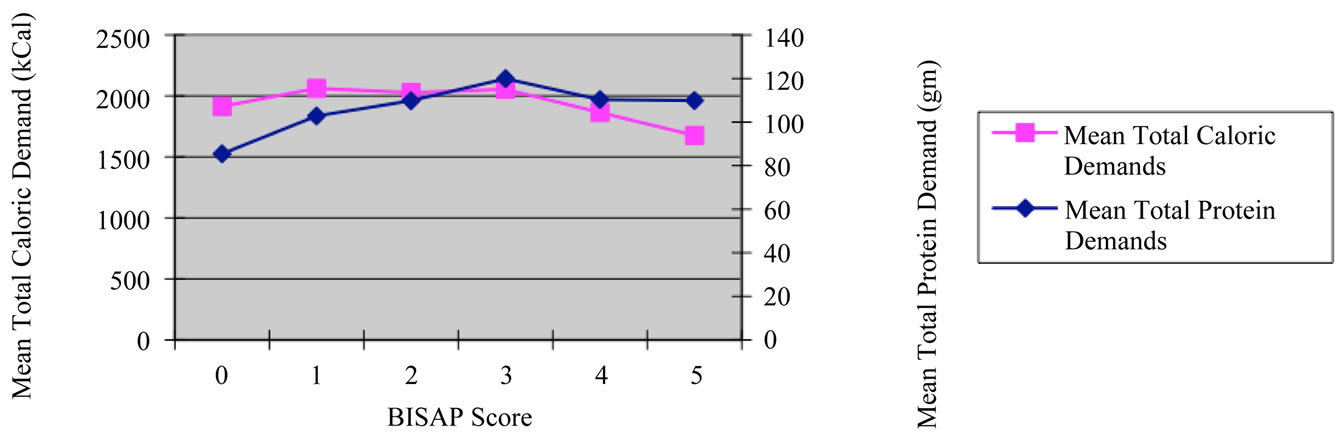
Figure 2. Mean caloric and protein demand of sample population by disease severity/BISAP score.
the ligament of Treitz (LOT) has also been established [23,24]. Therefore, early EN through feedings distal to the LOT may lessen disease progression or complications.
The first notable advantage of EN is that of mortality. In a review of 8 significant studies, 7.9% of subjects receiving EN, and 15.8% of subjects receiving TPN demonstrated mortality. Subjects with severe pancreatitis demonstrated mortality in 3.1% receiving EN and 23.6% receiving TPN. Further studies examined the impact of EN and TPN on the incidence of Multiple Organ Failure (MOF), operative intervention, systemic infections and septic complications [14-20]. With this in mind, it is questionable why a small proportion of subjects (22.98% of the etiology based subgroup, and 23.13% of the BISAP subgroup) received EN Tables 3 and 4.
Recent international studies have examined the frequency of EN with an estimated incidence of 20% - 50% [21,22]. These large international studies demonstrated that at other institutions, it is common to use nil per os (NPO) regimens, consistent with our study results. Of these sample groups, the initiation of EN was limited by; 1) A lack of specific skills for tube placement or 2) A general opinion that placing enteral feeding tubes is complicated [25-27]. To counteract these beliefs, additional studies have suggested techniques for positioning feeding tubes beyond the ligament of Trietz. Techniques utilized in these studies occurred at bedside and included; fluoroscopic advancement with serial radiographic images and the use of IV metoclopramide to ease tube placement.
To further simplify the initiation of enteral feedings, studies examined nasogastric tube (NGT) placement in comparison with jejunal feedings and TPN in acute pancreatitis [28-30]. The culmination of these studies demonstrated no difference in long term outcomes, diseaserelated mortality or morbidity when comparing NGT feeding with TPN or jejunal feeding. Furthermore, EN was shown by Eckerwall, et al. to improve glycemic control when compared with TPN. Regardless, it appears that further education must be implemented about the benefits of EN versus TPN in subjects with acute pancreatitis.
Potential limitations of this study may have been in limited sample size of certain sub-group analysis. Some of the more rare causes of acute pancreatitis may have failed to show statistical differences, as they failed to show significant study power. Increasing future sample size may potentiate future analysis of nutritional requirement in less common etiologies of acute pancreatitis. Additionally, the analyses were primarily retrospective and have limitations on long-term outcomes. To counteract this potential limitation, our group will prospectively use calorimetric measurements or urine nitrogen measurements to further analyze the metabolic demands.
5. CONCLUSIONS
This study demonstrated significant differences in mean total caloric demands between the gallstone and alcohol induced subgroups. Protein demands of the gallstone and alcohol induced subgroups were not statistically significant.
Analysis of total caloric demands showed a statistical difference between BISAP scores of 0 and 1, 2, 3. Protein demands were significantly different when comparing BISAP scores of 0 with all other BISAP scores. Finally, our study demonstrated poor use of EN in patients with acute pancreatitis receiving alternative nutritional support.
6. ACKNOWLEDGEMENTS
We would like to thank the staff of Cooper University Hospital Department of Medical Records. No financial input was needed for the completion of this study.
![]()
![]()
REFERENCES
- Sharounis, C.N. (1997) Did Alexander the great die of acute pancreatitis? Journal of Clinical Gastroenterology, 24, 294-296. doi:10.1097/00004836-199706000-00031
- Leach, S.D., Gorelick, F.S., et al. (1990) Acute pancreatitis at its centenary: The contribution of Reginald Fitz. Annals of Surgery, 212, 109-113. doi:10.1097/00000658-199007000-00014
- Fitz, R.H. (1889) Acute pancreatitis: A consideration of pancreatic hemorrhage, hemorrhagic, supportive and gangrenous pancreatitis and of disseminated fat necrosis. Boston Medical Surgical Journal, 120, 181-187, 205-207, 229-235. doi:10.1056/NEJM188902211200801
- O’Reilly, D.A., Kingsnorth, A.N. (2001) A brief history of pancreatitis. Journal of the Royal Society of Medicine, 94, 130-132.
- Singh, V.K., Wu, B.U., Bollen, T.L., et al. (2009) A prospective evaluation of the bedside index for severity in acute pancreatitis score in assessing mortality and intermediate markers of severity in acute pancreatitis. American Journal of Gastroenterology, 104, 966-971.
- Rangel-Frausto, M.S., Pittet, D., Costigan, M., et al. (1995) The natural history of the systemic inflammatory response syndrome: A prospective study. JAMA, 273, 117-123. doi:10.1001/jama.1995.03520260039030
- Woods, K.E. and Willingham, F.F. (2010) Endoscopic retrograde cholangiopancreatography associated pancreatitis: A 15-year review. World Journal of Gastrointestinal Endoscopy, 2, 165-178.
- Konturek, S., Tasler, J., et al. (1979) Intravenous amino acids and fat stimulate pancreatic secretion. American Journal of Physiology, 236, 676.
- Stabile, B.E., Borzatta, M., et al. (1984) Intravenous mixed amino acids and fats do not stimulate exocrine pancreatic secretion. American Journal of Physiology, 246, 274.
- Shnebaum, K.E., et al. (1983) Effects of total parenteral nutriation on exocrine pancreatic secretion. American Journal of Gastroenterology, 78, 31.
- Hamilton, R., Clayton, W., et al. (1971) Effects of Parenteral Hyperalimentation on Upper Gastrointestinal Tract Secretion. Archives of Surgery, 102, 348. doi:10.1001/archsurg.1971.01350040110022
- Boivon, M., Lanspa, S., et al. (1990) Are diets associated with different rates of human interdigestive and postpradial pancreatic enzyme secretion. Gastroeneterology, 99, 1763.
- Fried, G.M., Ogden, W.D., et al. (1982) Pancreatic protein secretion and gastrointestinal hormone release in response to parenteral amino acids and lipids in dogs. Surgery, 92, 902.
- McClave, S.A. and Chang, W. (2006) Nutritional support in acute pancreatitis: A systematic review of the literature. Journal of Parenteral and Enteral Nutrition, 30, 143-156. doi:10.1177/0148607106030002143
- Dickerson, R., Vehe, K., et al. (1991) Resting energy expenditure in patients with pancreatitis. Critical Care Medicine, 19, 484. doi:10.1097/00003246-199104000-00005
- Abou-Assi, S. and O’Keefe, S.J. (2002) Nutrition support during acute pancreatitis. Nutrition, 18, 938-943. doi:10.1016/S0899-9007(02)00991-7
- Di Carlo, V., Nespoli, A., et al. (1986) Hemodynamic and metabolic impairment in acute pancreatitis. World Journal of Surgery, 204, 665.
- Shronts, H.T., et al. (1989) Nutritional support in acute pancreatitis. Gastroenterology Clinics of North America, 18, 525.
- Pisters, P. and Ranson, J. (1992) Nutritional support for acute pancreatitis. Surgery Gynecology & Obstetrics, 175, 275.
- Al-Omran, M., AlBalawi, Z.H., et al. (2010) Enteral versus parenteral nutrition for acute pancreatitis (review). The Cochrane Collaboration, John Wiley & Sons, Ltd., Hoboken, 1-5.
- Pezzilli, R., Uomo, G., Gabbrielli, A., et al. (2007) A prospective multicentre survey on the treatment of acute pancreatitis in Italy. Digestive and Liver Disease, 39, 838-846. doi:10.1016/j.dld.2007.05.014
- Spanier, B.W., Mathus-Vliegen, E.M., Tuynman, H.A. et al. (2008) Nutritional management of patients with acute pancreatitis: A Dutch observational multicentre study. Aliment Pharmacol Therapy, 28, 1159-1165. doi:10.1111/j.1365-2036.2008.03814.x
- Karsenti, D., Viguier, J., Bourlier, P., et al. (2003) Enteral nutrition during acute pancreatitis: Feasibility study of a self-propeeling spiral distal end jejunal tube. Gastroenterol of Clinical Biology, 27, 614-617.
- Ragins, H., Levenson, S., et al. (1973) Intrajejunal administration of an elemental diet at neutral pH avoids pancreatic stimulation: Studies in dog and man. American Journal of Surgery, 126, 606. doi:10.1016/S0002-9610(73)80007-8
- Abou-Assi, S., Craig, K., et al. (2002) Hypocaloric jejunal feeding is better than total parenteral nutrition in acute pancreatitis: Results of a randomized comparative study. American Journal of Gastroenterology, 97, 2255- 2262. doi:10.1111/j.1572-0241.2002.05979.x
- Gabriel, S.A., Ackerman, R.J. and Castresana, M.R. (1997) A new technique for placement of nasoenteral feeding tubes using external magnetic guidance. Critical Care Medicine, 25, 641-645. doi:10.1097/00003246-199704000-00014
- Heiselman, D.E., Hofer, T. and Vidovich, R.R. (1995) Enteral feeding tube placement success with intravenous metoclopramide administration in ICU patients. Chest, 107, 1686-1688. doi:10.1378/chest.107.6.1686
- Eatock, F.C., Chong, P., Menezes, N., et al. (2005) A randomized study of early nasogastric versus nasojejunal feeding in severe acute pancreatitis. American Journal of Gastroenterology, 100, 432-439. doi:10.1111/j.1572-0241.2005.40587.x
- Kumar, A., Singh, N., Prakash, S., et al. (2006) Early enteral nutrition in severe acute pancreatitis: A prospective randomized controlled trial comparing nasojejunal and nasogastric routes. Journal of Clinical Gastroenterology, 40, 431-434. doi:10.1097/00004836-200605000-00013
- Eckerwall, G.E., Axelsson, J.B. and Andersson, R.G. (2006) Early nasogastric feeding in predicted severe acute pancreatitis: A clinical, randomized study. Annals of Surgery, 244, 959-965. doi:10.1097/01.sla.0000246866.01930.58