Engineering
Vol. 5 No. 1 (2013) , Article ID: 27079 , 9 pages DOI:10.4236/eng.2013.51015
Disadvantage Pressure Changes on the Decline of Water Quality in Water Distribution Systems
Civil and Structural Engineering Department, Faculty of Engineering and Built Environment, Universiti Kebangsaan Malaysia, Bangi, Malaysia
Email: *hsh_8772@yahoo.com, oj@vlsi.eng.ukm.my, ezlin@vlsi.eng.ukm.my
Received October 28, 2012; revised November 26, 2012; accepted December 10, 2012
Keywords: Residual Chlorine; Bacterial Growth (HPC); Pressure Changes; Water Quality; Kw and Water Distribution System
ABSTRACT
Systems that have big transmission line may have problem on changes of pressure in the distribution system. Because pressure rate changes have been too much between water treatment plant and dead ends in distribution system. This study is to analyze the effects pressure changes on the water quality in water distribution systems. It is located in south west of Ahwaz in IRAN. Ahwaz has five water treatment plants. In Ahwaz, two methods will be utilized. In the first method, samples will be taken from different locations in other to examine the quality of water in the distribution systems and the other method involves the use of simulation of models EPANET. Based on the EPANET model analysis of the water distribution system of Ahwaz as shown in result above the systems has large transmission line and extensive networks. So, the distance travelled and residence times have been causing to increase bacterial growth (HPC), chlorine consumption and hydraulic change (pressure) in water distribution system in Ahwaz. Pressure has a reversed relationship with bacterial growth (HPC) and Pressure has a direct relationship with residual chlorine. Pressure change has been causing to increase chlorine consumption more. So, Kw hasn’t any relationship with pressure and bacterial growth (HPC). The result of pressure changes among others can decrease in chlorine content and hydraulic factors, because the systems may be extensive and thus possess complex networks and hangs in quantity cause pressure of flow. Hence hydraulic changes (pressure) could affect of water quality in the water distribution system.
1. Introduction
In the big distribution systems, water needs to travel a large distance with a long water residence time. The problem could affect water quality. This may be due to low pressure, big and multiple reservoir storages, insufficient disinfection in the system, leaking, fracture and loosening of joints, and so on. As a result, the problems of quantity are basic agents in the decay of water quality in distribution systems. One of the parameter that could reason to decrease water quality in distribution system is pressure change in network. Many researchers have been carried out about affects pressure change in the water quality in distribution systems. Some of the results are described as follows [1]. System reads that “if we want to increase water quality, the pressure should be ideal. Also, high residence time and high pressure could cause decay of water quality as it had been responsible for increment in the rate of bacteria growth”. Also, [2] changes of pressures and their effects on water quality. Various pressures and changing the velocity could increase turbidity and corrosion in distribution systems. [3] the important factors that affect water quality is design network. Designers usually prefer to be over designed; this idea could be the reason why detention time in the distribution system is longer than desirable. Therefore, low pressure and residence time have been seen as some of the causes for bacteria growth in distribution systems. [3] carried the control of biofilm in distribution systems; the factors that could cause biofilm growth will be different parameters. Also of the opinion that bacteria could enter the distribution system through different ways. One of the ways is negative pressure or fracture, another factor about bacteria growth and the concentration of nutrient material in distribution. Hence, hydraulics factor could also be a reason for bacteria growth. And, [4] the reasons why biofilm growth in water distribution has increased may be due to environmental factor hydraulic effects (changes in pressure, water demand and the changes in water volume) and over designing of pipe in distribution systems. [5] the control of biofilm growth in drinking water in distribution systems. Their results described bacteria’s growth and turbidity. They found that the increased bacteria growth is influenced by flow velocity, changes of pressure. [6] changes in pressure could cause leakage in distribution systems, and that changes in pressure could lead to a problem of water quality. [7] also investigated bacteria growth. They concluded that changes in hydraulic, could increase bacteria growth in distribution systems. So, [8] turbidity is responsible for taste and odor in potable water and changes of pressure and velocity cause turbidity, so the part of systems that has back flow or high velocity could increase turbidity in distribution systems, it is one of the important parameters for delivering water to customer. The ideal pressure is set (higher than 30 psi). [9] conducted a pilot study on bacteria growth in the distribution systems. They used model of hydraulic and pipe material. The results demonstrated that hydraulic and disinfection materials contribute to the increase of bacteria growth [10]. Decay of chlorine (Kw, Kb), velocity and pipe material. [1] it is necessary for the pressure in the distribution systems to be high. Ideally, pumps are required for this but will shackle the distribution systems. Also that the quality of water in the distribution systems decays over time. In addition, those components of distribution systems with laminar flow will develop deposits that increase corrosion, leakage and breakage and systems with large transmission lines usually have problem with pressure and that customers must utilize pumps to increase pressure to a minimum of 20 - 30 psi. Pump construction within the distribution system itself gives rise to negative pressures, especially when the system increases consumption. [11] one of the important parameters related to bacteria re-growth is hydraulic agents. [7] changes in bacteria growth patterns in the distribution system depend on changes in hydraulics. [6], changes in pressure within the distribution system are important to water quality as well as leakage, the effects of pressure changes with different flow rates, making systematic measurements; also pressure changes decrease water quality and leakage in distribution systems. [12], the effects of biofilm on cast iron pipes and corrosion in drinking water distribution systems, velocity changes and pressure effects cause pipe corrosion and the corrosion increases bacteria growth in drinking water distribution systems. [5], increased bacteria growth in the water distribution systems have been product height volume of water in the water treatment plan it refers to, high velocity flow rates, velocity changes and pressure in the distribution systems, changes in pressure in the system has been about the lack of careful designing, also the height level of the flow in the system. Opening and closing the valves had effects on cross-connections, so that the hydraulics, laminar flow and low chlorine concentration in water distribution systems have given cause for increased bacteria growth. Pressures lower than that of the atmosphere may cause increased bacteria growth because bacteria from outside the system are then allowed to enter the distribution systems. In addition leaking and fractures in the systems permit the entrance of pollutants from outside to the systems. So, water quality which concluded that change of pressure, joints and problems with hydraulics allow pollution to enter the systems, the effects of hydraulics and bacteria growth on biofilm haven’t been easily related and that many parameters involve pipe design, high velocity flow rates and conditions of terminal demands. [13], improved maintenance management of the distribution system with positive pressures, flushing of pipes, coating of pipes to control the entrance of contaminated material, and maintaining disinfection. [14] population growth and greater consumption equals the demand for a greater product so that the loss of water can be avoided utilizing the model EPAENT; reminding us that water supply will be limited for customers. However, with due attention to problems of water quality and quantity in distribution and pressure change could make to decay of water quality in water distribution system. Pressure change is parameter quantity that could affect to water quality in water distribution systems. This study is to analyze the effects pressure changes on the water quality in water distribution systems.
2. Materials and Methods
This study is to analyze the effects pressure changes on the water quality in water distribution systems. Choosing location and sampling time is very important because we need to choose different locations that will be water quality and quantity relative too much. Location of the study has been in Ahwaz of IRAN. Ahwaz City is at the center of the province of Keaston, as shown Figure 1 it is located in south west of IRAN. Ahwaz has five water treatment plants. Two of the plants are major ones while the rest are just minors and it has about 186 km of water transmission line and about 2260 km of water distribution line .
In Ahwaz, two methods will be utilized. In the first method, samples will be taken from different locations in other to examine the quality of water in the distribution systems and the other method involves the use of simulation of models EPANET. Five (5) different locations will be considered in Ahwaz as follows: A1 (water treatment plant), A2 (middle line), A3 (middle line), A4 (finish line) and A5 (end deadline). In addition, the time of taking samples to be considered are during maximum consumption peak, this means, between to 8 am, 11 am to 15 pm and 19 pm to 22 pm. Also, the minimum consumption time; this means, at 8 am to 11 am, between 15 pm to 19
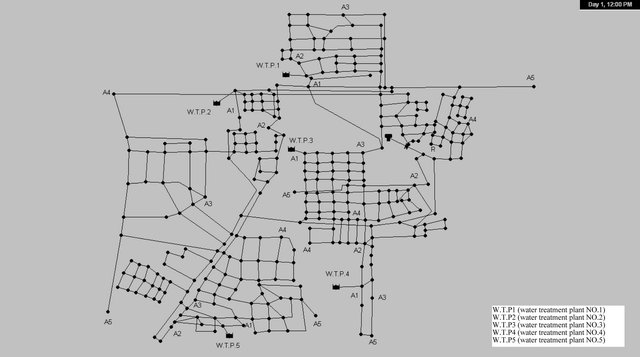
Figure 1. The map of the water distribution in Ahwaz.
pm and 22 pm to 5am. Samples were taken over a period of 60 days (8 weeks) and 450 samples were taken over this period in Ahwaz i.e. 6 (six) times at five locations, 360 samples were taken i.e. 6 (six) times at four locations. There are four reservoirs in Ahwaz and they are in the north eastern part. Three of them are of 50,000 m3 in capacity while the fourth one’s capacity is 10,000 m3. The reservoirs are useful during the period of maximum consumption and they guarantee supply of water to all parts of the town and the adjacent township. The total output of water in Ahwaz is about 637,000 m3/day. And the chlorine concentration of water before leaving the plants is between 1.0 - 1.2 mg/l.
2.1. Analysis and Comparison Experiment
This study also presents experiments based on impact changes on water quality as it affects distribution systems. The parameters to be examined are pressures, velocity, (heterotrophic plate count (HPC), Turbidity, Total coli form Bulk Coefficient (Kb), Wall Coefficient (Kw) and chlorine residual.
2.2. Effect of Area under Analysis
There are two instances for the conduct of this analysis.
1) Local environment;
2) Laboratory Condition.
Effect of parameters such as velocity, Turbidity, residual chlorine and Temperature on a local area will be considered the while the effects of HPC, Kb and Kw under laboratory conditions will also be examined. Some qualitative and quantitative parameters will be considered and a comparative study will be undertaken, this will include local sampling and some laboratory activities and the results will be obtained with the help of analysis involving the use of EPANET model. Comparative qualitative and quantitative study has been selected for Ahwaz region.
3. Result
The result of pressure changes among others can be water aging decrease in chlorine content and hydraulic factors, because the systems may be extensive and thus possess complex networks. One of Changes in quantity causes pressure of flow. As earlier said, area considered in this study, this will include local sampling and some laboratory activities and the results will be obtained with the help of analysis involving the use of EPANET model. According to Figure 2 which shows pressure of the water distribution networks in Ahwaz, the maximum pressure is found to be at height 58 m and the minimum pressure was zero. The pressure had decreased a large the way. There are changes in the level of pressure from A1 to A4, and the pressure at A4 and A5 are 10 m and zero respectively.
3.1. Relationship between Velocity, NTU and Pressure
The results in Figure 3 which shows the relationship between NTU, velocity and pressure in water distribution system in Ahwaz, rate of velocity, pressure and NTU level was decreasing to with distance travelled of water in the system. Pressure was almost zero in distribution
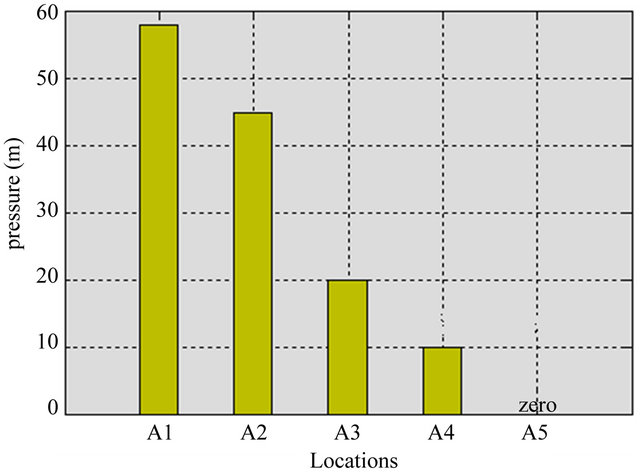
Figure 2. Pressure at various locations in Ahwaz.
system at point A5. The maximum level of velocity is 2.65 m/s in A1, and minimum velocity was 0.3 m/s at A5 (dead end). Many times, pressure has a much lower rate, changing of the pressure in Ahwaz system, between A1 to A5 was 58 m more.
3.2. Relationship between HPC and Pressure
Another of the factor that could cause increasing HPC in Ahwaz system was high hydraulic changes. Figure 4 shows relationship between HPC and pressure. The Figure showed bacterial growth (HPC) has a reverse relationship with pressure nearly. Decreasing pressure in Ahwaz system was cause increasing HPC.
By knowing that HPC don’t effect for healthy of the human. Maybe HPC could have advantage for decreasing
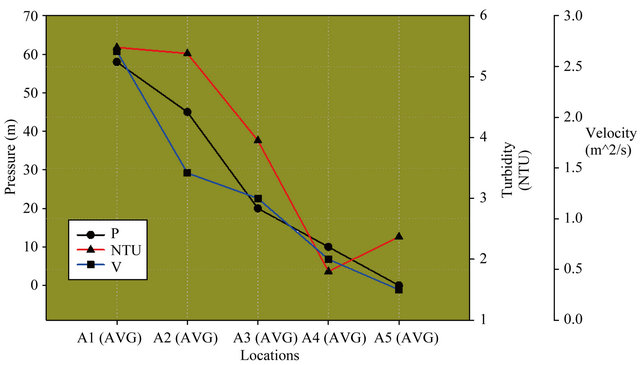
Figure 3. Relationship between velocity, NTU and pressure in Ahwaz.
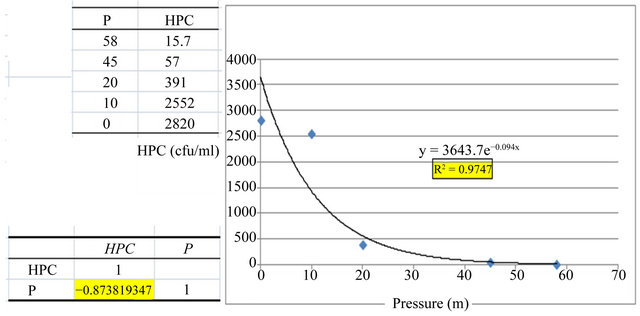
Figure 4. The correlation and regression between HPC and pressure in Ahwaz system.
Total Coli from. Rate of the Total Coli from was very low in Ahwaz system. Acceding to reports and samplings when the Total Coli from have been increasing in Ahwaz system that the system got a problem (fracture, joints’ loosening, leaking and negative pressure). Table 1 showed results rate of the Total Coli from have decreasing due to distance travelled and high residence time in the distribution systems. Figure 5 results, bacterial growth (HPC) hasn’t any a relationship with Total Coli from in Ahwaz system.
3.3. Relationship between the Rate of Residual Chlorine, Kw and Pressure
The rate of residual chlorine in Ahwaz system was ideal, but the level of the residual chlorine couldn’t cause decreasing or controlling bacterial growth (HPC) in the water distribution systems, because rate of the residual chlorine in A1 (upstream) was 1.2 mg/l and in A5 (downstream) was 0.6 mg/l. Acceding to results, rate of the HPC have increasing due to distance travelled and high residence time in the distribution systems. Hydraulic changes were causing others for chlorine consumption effectively. Figures 6 and 7, shows relationship between pressure changes and residual chlorine. The Table 1 showed Hydraulic changes (pressure) have a direct relationship with rate of the residual chlorine, but the pressure was effect more than velocity to decrease residual chlorine Figure 8. Figure 9 the results of this regression that decreasing the residual chlorine when velocity was between 2.65 to 0.6 m/s, and after that increasing the residual chlorine when velocity was between 0.6 to 0.3 m/s. Maybe one of the reason that increasing the residual chlorine was low velocity in the end dead and decreasing Kf in the area.
Based on the EPANET model analysis of the water distribution system of Ahwaz as shown in result (figures and Table) above the systems have large transmission line and extensive networks that will be very difficult to maintain, control and manage. In addition, changes in hydraulics (flow, velocity and pressure) are divided into two parts as discussed:
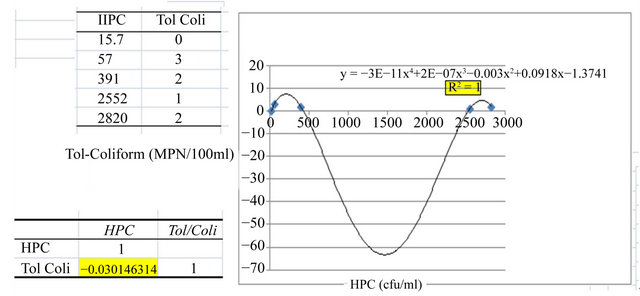
Figure 5. The correlation and regression between HPC and Tol-Coli form in Ahwaz system.
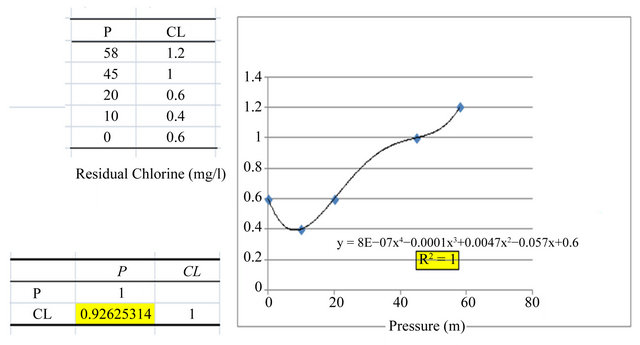
Figure 6. The correlation and regression between pressure and residual chlorine in Ahwaz.
Table 1. Information of in the water distribution system in Ahwaz with due attention to locations in Ahwaz.
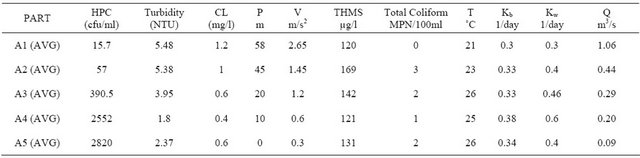
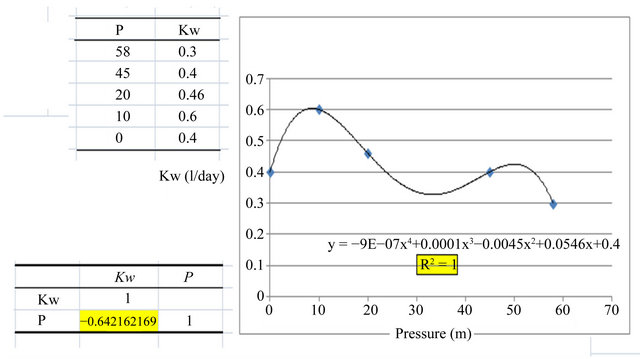
Figure 7. The correlation and regression between Kw and pressure in Ahwaz system.
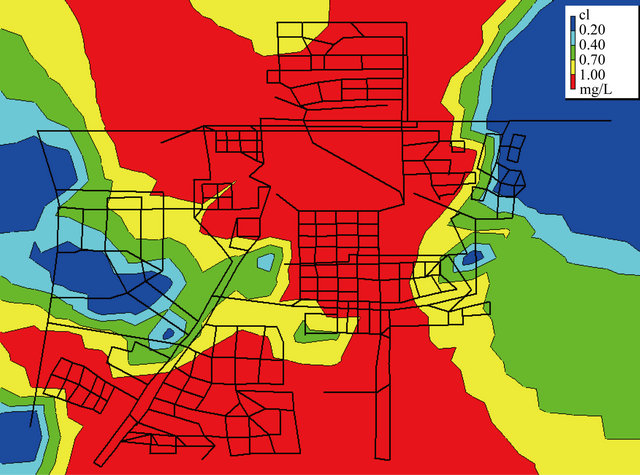
Figure 8. Situation of residual chlorine at the peak time (8 am) in Ahwaz.
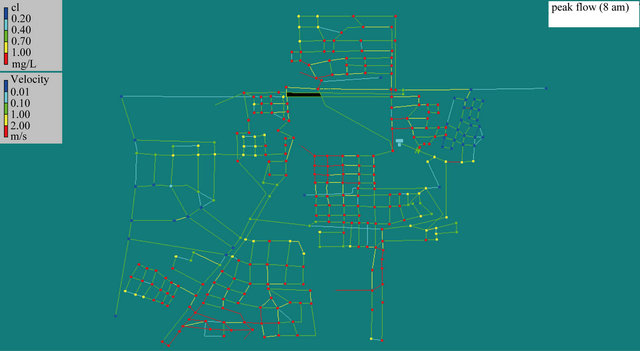
Figure 9. Residual chlorine at the peak time (8 am) in the system in Ahwaz.
1) The distance travelled and residence times have been causing to increase bacterial growth (HPC), chlorine consumption and hydraulic change (pressure) in water distribution system in Ahwaz;
2) Pressure has a reversed relationship with bacterial growth (HPC);
3) Pressure has a direct relationship with residual chlorine. Hydraulic change (pressure) has been causing to increase chlorine consumption more;
4) Kw hasn’t any relationship with pressure and bacterial growth (HPC).
4. Discussion
Systems that have big transmission line may have problem on changes of pressure in the distribution system. Because flow rate changes have been too much between water treatment plant and dead ends in distribution system. So, the systems will have low pressure in the downstream distribution system. High residence time, high pressure and low pressure systems and distribution network will cause a decline in the water quality in the distribution system. [1] declared that systems with high pressure will have problem of pipe fracture in the distribution system. High pressure could induce high residence time and water age in a water distribution system. Systems with big transmission system line, (such as the water network system in Ahvaz) are needed for the network to maintain high Pressure through the system. Designers must therefore use materials that comply with high pressure in the water distribution system in making the pipes, in most cases, iron or steel pipes are used. The same procedure could cause corrosion problems in the system. In case of small systems, they are not required to produce high pressure. And these systems could use pipes that are resistant to corrosion and sediment such as polyethylene pipes. Low pressure could cause deterioration in water quality in distribution systems. [15] observed that low pressure will encourage bacterial growth in water distribution systems, because, when pressure is lower than atmospheric pressure, then microorganism growth will not be inhibited (joints, leaking and loosening) in the distribution system. For drinking water in the distribution system, the minimum pressure should be between 20 (Psi) to 30 (Psi). Due to the long distance associated with the system of Ahwaz, it might be impossible to maintain this high pressure.
The system in Ahwaz has many static points, especially in places where the two lines of the network are under the 90-degree angle for instance; points P1, P2 and P3 (Figure 10). Changes of pressure were zero between two lines, and the water has been static in the distribution system. In many places, lack of control causes static pressure in the system.
Changes in quantity cause pressure fluctuations as well as lack of speed and network control. These systems have many disadvantages, and the disadvantages could be responsible for the deterioration of water quality in distribution system. Some of the disadvantages are high water age, due to long transmission line and an extensive network. Another disadvantage of system with long transmission line and an extensive network is about the quantity of product in the system. In large distribution networks and systems, hydraulic changes are high, there is so much pressure along the distribution lines and this might cause fractures or cracks in pipes even at the dead end areas of the system. Hydraulic changes (pressure) will be too much in the big network and long transmission lines. High hydraulic changes has been responsible for the separation of bacteria from the pipe wall, the volume of bacteria will increase in those parts and once
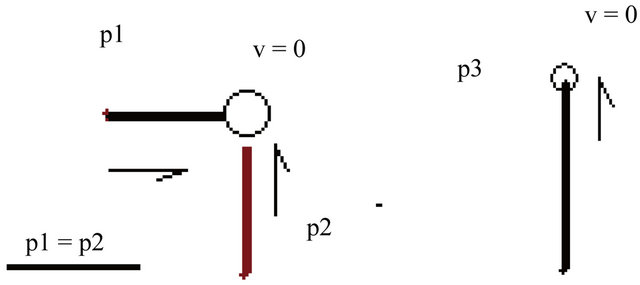
Figure 10. Situation some places in the distribution systems that the water of flow is resident.
this happens, chlorine consumption will be high and may not be enough to be effective over the required area. In the distribution system of Ahwaz, there are two forms of energy; Kinetic and Potential energy. Potential energy has been responsible for the increased deposition in the water distribution system in Ahvaz. And due to the high kinetic energy, there has been increased turbidity in the distribution system caused by the presence of shear force between the flow of water and pipe walls. The high potential energy has been the cause of increased corrosion and growth of bio film and deposits in pipe wall, though these could also be traced to material and age of pipes. And also, if the potential energy is high, velocity will be zero in the water distribution system and this brings about deposits which eventually cause corrosion in the system. Both instances of high and low velocity i.e. kinetic and potential energy respectively can initiate corrosion in the distribution system.
5. Conclusion
Hence hydraulic changes (pressure) could affect of water quality in the water distribution system. The result of pressure changes among others can decrease in chlorine content and hydraulic factors, because the systems may be extensive and thus possess complex networks. Changes in quantity cause pressure of flow. Systems that have big transmission line may have problem on changes of pressure in the distribution system. Because flow rate changes have been too much between water treatment plant and dead ends in distribution system. So, the systems will have low pressure in the downstream distribution system. High residence time, high pressure and low pressure systems and distribution network will cause a decline in the water quality in the distribution system and the distance travelled and residence times have been causing to increase bacterial growth (HPC), chlorine consumption and hydraulic change (pressure) in water distribution system in Ahwaz.
6. Acknowledgements
First and foremost I am very grateful to my supervisor Ir. Dr. Othman Jaafar who supported me all the time during the project. I would also to thank Dr. Noor Ezlin Ahmad Basri for endless support and encouragement during my study.
REFERENCES
- Environmental Hydraulics Group, “Drinking Water Distribution Systems,” 2002, pp. 233-246.
- S. M. Mustonen, S. Tissari, L. Huikko, M. Kolehmainen, M. J. Lehtola and A. Hirvonen, “Evaluating Online Data of Water Quality Changes in a Pilot Drinking Water Distribution System with Multivariate Data Exploration Methods,” Water Research, Vol. 42, No. 10, 2008, pp. 2421-2430. doi:10.1016/j.watres.2008.01.015
- C. Mains, “Biofilm Control in Distribution Systems,” National Environ Service Center, Vol. 8, No. 2, 2008, pp. 1-4.
- Y. Kambam, “Potable Water Treatment,” Biofilms in Water Distribution, 2000, pp. 1-5.
- USEPAO Research, “Control of Biofilm Growth in Drinking Water Distribution Systems,” Office of Research and Development, 1992.
- B. Ulanicki, P. Bounds, J. Rance and L. Reynolds, “Open and Closed Loop Pressure Control for Leakage Reduction,” Urban Water, Vol. 2, No. 2, 2000, pp. 105-114. doi:10.1016/S1462-0758(00)00048-0
- L. Guzzella, F. Di Caterino, S. Monarca, C. Zani, D. Feretti, I. Zerbini, G. Nardi, A. Buschini, P. Poli and C. Rossi, “Detection of Mutagens in Water-Distribution Systems after Disinfection,” Mutation Research/Genetic Toxicology and Environmental Mutagenesis, Vol. 608, No. 1, 2006, pp. 72-81. doi:10.1016/j.mrgentox.2006.05.010
- Y. K.Cohen, “Problems in Water Distribution (Solved, Explained, and Alied),” CRC Press, LLC, Boca Raton, 2002, pp. 133-143.
- P. Piriou, S. Dukan, Y. Levi and P. Jamge, “Prevention of Bacterial Growth in Drinking Water Distribution Systems,” Water Science and Technology, Vol. 35, No. 11, 1997, pp. 283-287. doi:10.1016/S0273-1223(97)00273-4
- N. Hallam, J. R. West, C. Forster, J. Powell and I. Spencer, “The Decay of Chlorine Associated with the Pipe Wall in Water Distribution Systems,” Water Research, Vol. 36, No. 14, 2002, pp. 3479-3488. doi:10.1016/S0043-1354(02)00056-8
- C. Volk, E. Dundore, J. Schiermann and M. Lechevallier, “Practical Evaluation of Iron Corrosion Control in a Drinking Water Distribution System,” Water Research, Vol. 34, No. 6, 2000, pp. 1967-1974. doi:10.1016/S0043-1354(99)00342-5
- H. Tung and Y. F. Xie, “Association between Haloacetic Acid Degradation and Heterotrophic Bacteria in Water Distribution Systems,” Water Research, Vol. 43, No. 4, 2009, pp. 971-978.
- A. J. Whelton, A. M. Dietrich, G. A. Burlingame, M. Schechs and S. E. Duncan, “Minerals in Drinking Water: Impacts on Taste and Importance to Consumer Health,” Water Science and Technology, Vol. 55, No. 5, 2007, pp. 283-291. doi:10.2166/wst.2007.190
- I. Petr, Z. Svitak, A. Pradhan and A. Tarai, “Modelling Intermittent Water Supply Systems with EPANET,” 8th Annual WD Symposium EPA, Cincinnati, 27-30 August 2006.
- Z. M. Lahlou, “Water Quality in Distribution Systems,” A National Drinking Water, Clearinghouse, Fact Sheet, 2002.
NOTES
*Corresponding author.