Circuits and Systems
Vol. 3 No. 1 (2012) , Article ID: 16647 , 7 pages DOI:10.4236/cs.2012.31015
Experimental and Theoretical Considerations of Electrolyte Conductivity in Glucose Alkaline Fuel Cell
1Department of Biotechnology Engineering, Ort Braude College, Karmiel, Israel
2Physics Unit, Ort Braude College, Karmiel, Israel
Email: leamor@braude.ac.il, rubin_zeev@yahoo.com
Received November 5, 2011; revised December 20, 2011; accepted December 30, 2011
Keywords: Alkaline; Fuel Cell; Glucose; Electrolyte; Conductivity; Collision
ABSTRACT
The paper focuses on the conductivity of the fuel cell electrolyte in a membraneless glucose-fueled alkaline fuel cell. The electrolyte conductivity is interpreted using simple physical models, considering either the empirical behavior of the solution’s viscosity, or the consideration of ions and molecules colliding in solutions. The conductivity is expressed as a function of KOH and glucose concentrations. The physical properties of the species (i.e. radii, thermal velocity) and the chemical equilibrium constant of the reaction that glucose undergoes in an alkaline solution can be estimate by comparing the experimental results with the theory.
1. Introduction
Fuel cell resistivity is one of the factors determining cell efficiency. The resistivity affects fuel cell power [1-3], efficiency and stability [4]. The resistivity of a glucosefuelled alkaline fuel cell was previously found to depend linearly on the glucose concentration [5] dissolved in a constant KOH concentration of 0.35 M, and was shown to be seven times higher than the resistivity of a KOHonly solution [6].
The increase in resistivity of the alkaline glucose, or other carbohydrate’s solutions, was also considered previously, to be due to the complexation of alkali ions with reducing and nonreducing carbohydrates [7].
The present study aimed to explain the relationship between the glucose and KOH concentrations and the changes in the fuel cell electrolyte resistivity over time.
The overall fuel cell resistance is defined as the sum of the resistances of the bulk solution (electrolyte), the diffusion layer [8] and the electrodes [3]. The electrolyte resistance was assumed to be larger than the electrodes’ resistance [3]. Various authors have tried to develop theoretical and experimental methods for estimating the various components of fuel cell resistance [3,8]. Among these methods were: a micro-scale model for predicting contact resistance [8], a monodimentional simulation model of the overall electrical resistance due to ohmic losses and polarization phenomena in stationary conditions, assuming equilibrium of the chemical reactions [9], a dynamic model, based on experimental characterizations of the anode and cathode equivalent resistance [3], and a transient model of the cathode catalyst layer [10].
This paper focuses on using experimental and theoretical considerations to study electrolyte conductivity of an alkaline glucose solution.
Two theories, explaining the behaviour of conductivity as function of glucose and KOH concentration, will be presented at the third section. The experimental behaveiour of conductivity in a test tube and in alkaline fuel cell will be introduced in the fourth section. Analysis of the experimental results using both theories is discussed in the 5th section.
2. Materials and Methods
The solutions investigated here were of glucose-KOH with various concentrations ranging from 0.05 M to 1 M for both the glucose and KOH. The solutions were prepared shortly before use by dissolving the glucose in water or in KOH solutions. KOH concentration was monitored before and during the experiments by titration with potassium biphthalate (Carlo Erba). It should be noted that measurement by titration with biphthalate gives the total OH– concentration, but nonetheless, this measurement is referred to as the change in KOH concentration. The KOH is the main source of the ions in solution, and is responsible for the solution conductivity. The experiments include test tubes and open/closed circuit’s fuel cell.
Test tube—A test tube of 50 ml volume, contained 25 ml glucose-KOH solution. The conductivity was measured in the test tube.
Open/closed circuit’s fuel cell—The membraneless alkaline fuel cell, (purchased from Hong Kong University [11,12]), constructed with one reservoir including both the fuel glucose and the electrolyte KOH solution. Its cathode came into contact with the ambient air and its anode, with incorporated platinum particles, was immersed in fuel/electrolyte (25 ml glucose-KOH) solution. For close circuit’s fuel cell experiments, the circuit was closed with a load resistance of 10 Ω. For electrolyte conductivity measurements the solution were temporarily transferred to a 50 ml test tube; after getting the conductivity result, the solution was returned to the fuel cell.
The temperature in both experiments was maintained in a water bath adjusted to 21 C.
Conductivity and KOH concentrations were measured every 20 minutes for the first five hours, and once a day for up to five days. Conductivity was measured with a Cyberscan 510 conductivity meter. Samples for HPLC analysis over time were conducted using an isocratic pump using eluting solvent acetonytrile:water 80:20 (v/v).
3. Theory
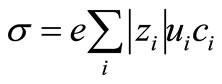
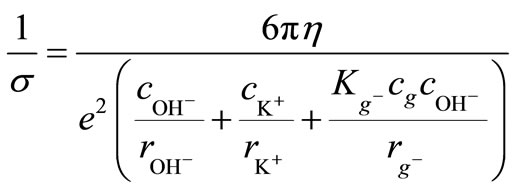
Equation (1) expresses the electrolyte conductivity, derived from the ions present in the electrolyte solution before and during the fuel cell operation, Using simplified kinetic theory considerations [13,14].
 (1)
(1)
here σ is the conductivity and e is the elementary charge. The summation index i refers to the ions that take part in electricity conduction in solution:  and
and generated from the electrolyte,
  generated from the water, and
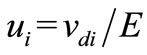
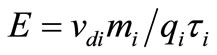
  produced during a chemical reaction of glucose in the alkaline solution. zi is the signed ionic charge of the ith ion, ci is its concentration and ui is its mobility coefficient, defined by:
 . (2)
. (2)
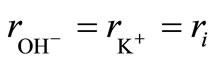
vdi is the drift velocity of the ions, induced by the electric field E. Equation (1) is composed of two parts: properties of the solution (e.g. concentrations and viscosity) and specific parameters of the ions (e.g. charge, velocity and effective size). The concentration of the ions derived from the electrolyte and water were assumed, for this presentation: The concentrations of K+, OH– and KOH are identical, and the concentration of H+ is negligible comparared to the concentration of OH–. The concentration of the ions produced during the chemical reactions (i.e. endiolate (C6H11O6)– or gluconate (C6H11O7)–) were assumed to be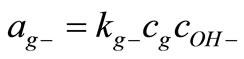 , where Kg– was the equilibrium constant for the ions generated from the glucose in the alkaline solution.
3.1. Conductivity-Viscosity Empirical Evaluation
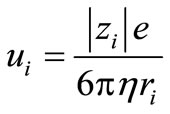
The mobility coefficient is often expressed by the StokesEinstein equation [13]:
 . (3)
. (3)
Here, η is the solvent viscosity (in this case, of an aqueous glucose solution) and ri is customarily called the (hydrated) ionic radius of the ith ion. Equation (3) appears to describe a sphere with charge zie, moving at a terminal velocity vdi under the influence of an electrical field E and a Stokes-Law drag force (i.e., a drag force in a creeping flow around a sphere). However, this is not the physical picture: Given that the ions and the water (and glucose) molecules are of similar orders of magnitude, the ions are not surrounded by an inter-molecular fluid and no drag whatsoever acts on them. Consequently, Equation (3) is used as an empirical approximation, rather than as a statement of a force balance on an ion. In this context, 1/η represents the notion that sluggishly flowing solvents do hinder the mobility of the ions in them and e/(6πri) is a coefficient, characteristic of the ith ion. Consequently, substituting Equation (3) into Equation (1), and introducing all the definitions and assumptions, yields:
 (4)
(4)
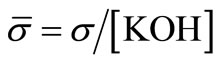
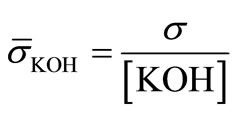
We now introduce the concept of normalized conductivity:
 (5)
(5)
Since KOH is the major contributor to the conductivity, this normalization reveals the changes in conductivity undergone by the other factors in the solution, with the exception of KOH.
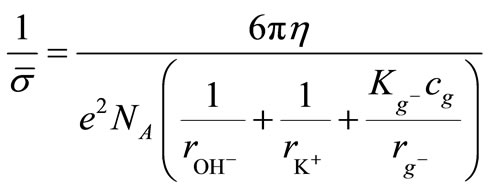
Equation (4) leads to:
 . (6)
. (6)
This completes the inclusion of the Stokes-Einstein Equation (3) in expression (1). Empirical expressions (4) and (6) can be used for processing the measured conductivity values. These two expressions include the assumption in expression (1) of constant ui values, which may prove suitable when only the ionic concentrations affect the conductivity, and the assumption in expression (3), which can handle some of the glucose concentration’s effect, because η varies with the glucose concentration in the solvent [15].
3.2. Conductivity-Collision Evaluation
Let us now define the acceleration under the influence of an electric field, . Introducing Newton’s second law gives:
 . (7)
. (7)
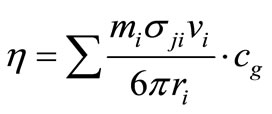
 is the mean average characteristic time of successive collisions between the ith ion and glucose molecules
 .
.  is the cross-section of collision
 [16], vi is the thermal velocity of the ith ion in the solution, cg is the glucose concentration and ri and rg are the hydrated radii of the ions and glucose in the solution. Introducing the definitions and assumptions of Equation (1) yields:
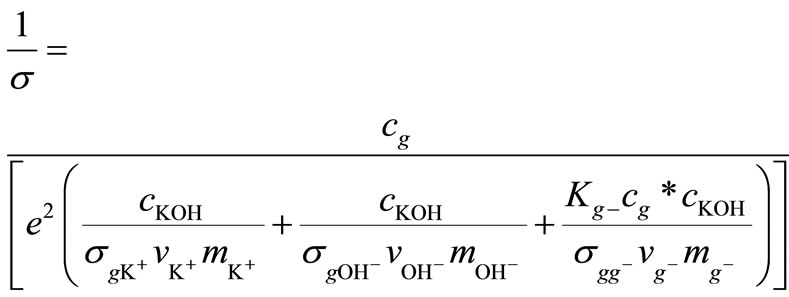 (8)
(8)
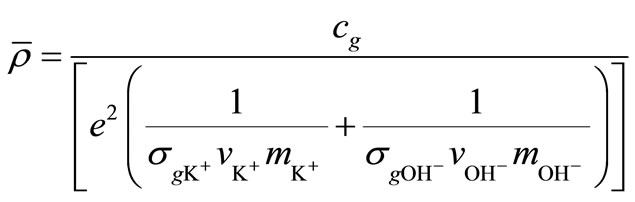
Introducing the normalized conductivity definition (5) to Equation (8) leads to
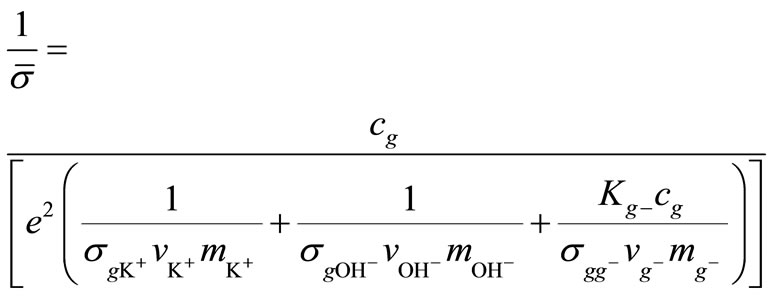 (9)
(9)
The theoretical expressions (8) and (9) can be used for processing of measured conductivity values. They include the assumption in equation (1) of constant ui values, which may prove suitable when the colliding species are hard, not interacting spheres, as in dilute gases [17].
4. Results
4.1. Conductivity Measurements in the Test Tube
Since electrolytes play a major part in fuel cell resistance, the first step in studying glucose-fuelled alkaline fuel cell resistance changes over time is to investigate the instantaneous conductivity of an alkaline glucose solution in a test tube. The conductivity of KOH solutions (0.05 M to 1 M) with various glucose concentrations, up to 1 M, was measured shortly after preparation. The resistivity ρ (the reciprocal of conductivity) for each initial KOH concentration was plotted against the glucose concentration in Figure 1. It can be seen that for each initial KOH concentration the glucose, a nonionic compound, increased the solution’s resistivity (decreased the solution conductivity). To discern the changes in the solutions’ conductivity caused by factors other than KOH— which is the major contributor to the conductivity—the normalized resistivity ρ (reciprocal of normalized conductivity) was plotted against the glucose concentration in Figure 2. Once all the graphs of the different KOH concentrations were combined into one graph, the data indeed showed that the glucose concentration was responsible for the conductivity changes. To demonstrate the effect of time on fuel cell electrolyte conductivity, the conductivity was monitored in three solutions, representing high (0.8 M), medium (0.25 M) and low (0.05 M) KOH concentrations. The data shows that normalized resistivity was linear with the glucose concentration for both instantaneous and subsequent measurements (after 3 - 4 days).
4.2. Changes in Normalized Conductivity over Time
Since the changes in normalized conductivity over time is function of both KOH concentration and solution conductivity, both KOH concentration and solution conductivity were measured over time in two solutions, representing high (0.35 M KOH, 1 M glucose) and low (0.1 M KOH, 0.1 M glucose) concentrations. Two experiments per solution were conducted.
4.2.1. KOH Concentration Changes over Time
The mean KOH concentration decreased with time both in the test tube and in the open/closed fuel cell during the five days of the experiment (Figure 3).
The concentration changes in the test tube were higher
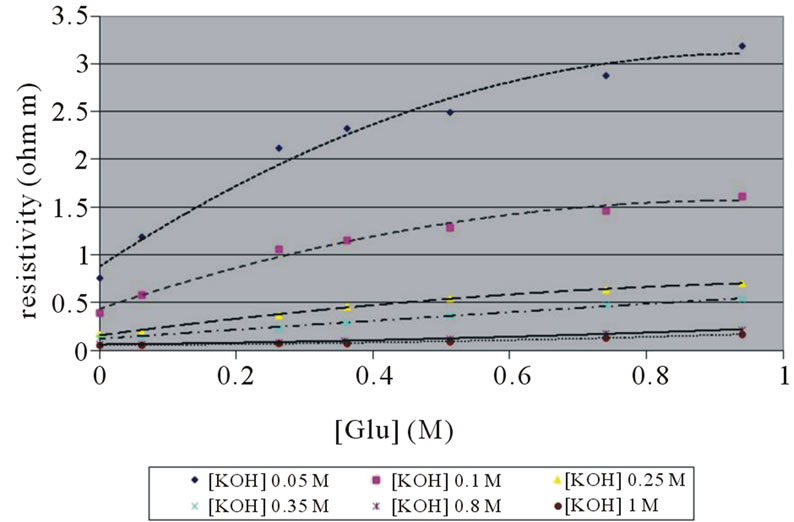
Figure 1. The resistivity of glucose solution in KOH, for each KOH concentration, is plotted against glucose concentration. Measurements were taken in the test tube shortly after preparing the solution.
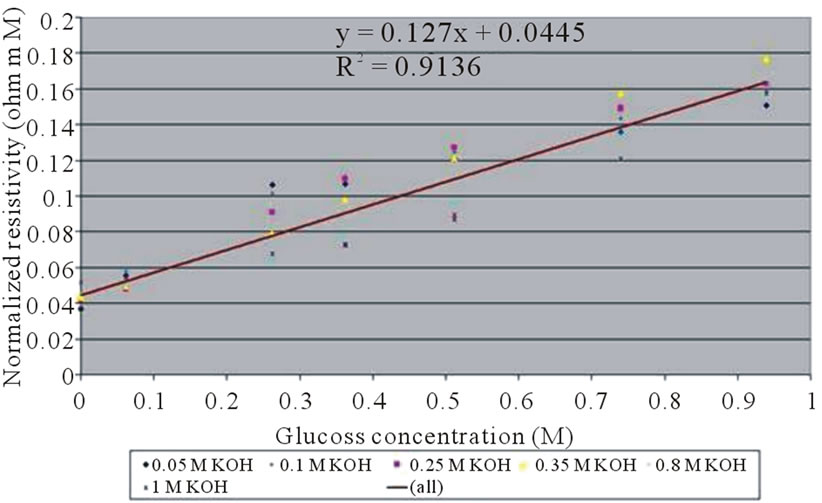
Figure 2. Normalized resistivity, as a function of glucose concentration at various KOH concentrations. Measurements were taken in the test tube shortly after preparing the solution.
when the KOH concentration was high (0.35 M) as opposed to low (0.1M). Significant changes between the KOH concentration in the test tube and in the fuel cell, for both KOH concentrations, were evident. The decrease in KOH concentration over time in the low (0.1 M) KOH concentration resulted from the reaction of KOH with CO2, which already existed, and was continuously dissolving in the water. In the high (0.35 M) KOH concentration, the higher decrease may result from the isomerization reactions of glucose, catalyzed by the high KOH concentration, producing endiolate ions. In the fuel cell, the fuel cell electrode can, in addition, catalyzes electrochemical reaction, in both KOH concentrations, yealding gluconate ions, which contributed to the lower KOH concentration in the fuel cell [18].
4.2.2. Conductivity Changes over Time
4.2.2.1. Test Tube
The reduction of the solution’s mean conductivity measured in the test tube depended on the amount of time that had elapsed (Figure 4). For the first few hours, the effect was high, and thereafter remained stable for the next few days. Comparing changes in the KOH concentration (Figure 3) and conductivity (Figure 4), led to the following inferences: The rate of KOH concentration changed during the first day; at a concentration of 0.1 M KOH, it was similar to the rate of the conductivity change. In opposition, when the KOH concentration was 0.35 M, the rate of the KOH concentration change was much larger than the rate of the conductivity change. This effect can be clearly expressed by the normalized resistivity ([KOH]/σ) (Figure 5). The normalized resistivity in solution was almost constant at 0.1 M KOH, whereas it dropped significantly in a concentration of 0.35M KOH, because of the reaction took place in a solution, catalyzed by a high KOH concentration. Ionic compounds generated by this reaction contributed to the conductivity, and kept it almost constant in spite of the reduction in OH– concentration.
4.2.2.2. Fuel Cell
The situation was different in the fuel cell. Here, under both KOH concentrations, despite the high reduction in KOH concentration over time (Figure 3), the reduction in conductivity is less profound (Figure 4). Consequently, the normalized resistivity (Figure 5) decreased over time for both KOH concentrations. This can be explained by generation of ionized compounds g– by the electrochemical reaction.
4.2.3. Normalized Resistivity Changes with Glucose Concentration
The normalized resistivity in two glucose concentrations are shown in Figure 6(a) for the test tube, and in Figure
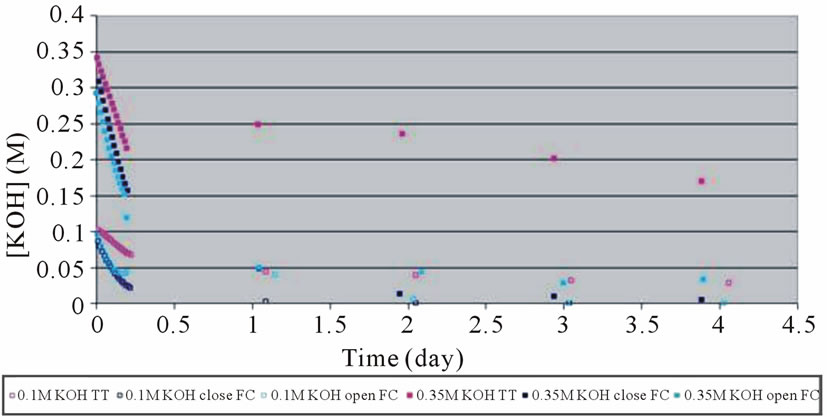
Figure 3. KOH concentration changes in open/closed fuel cell, compared to test tube.
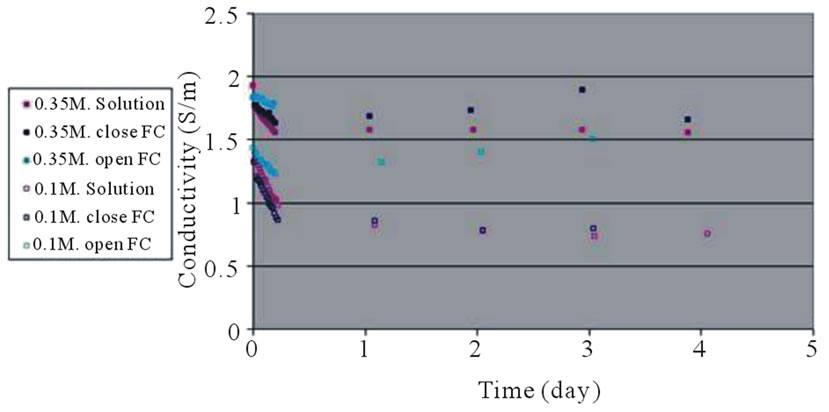
Figure 4. Conductivity changes in open/closed fuel cell, compared to test tube.
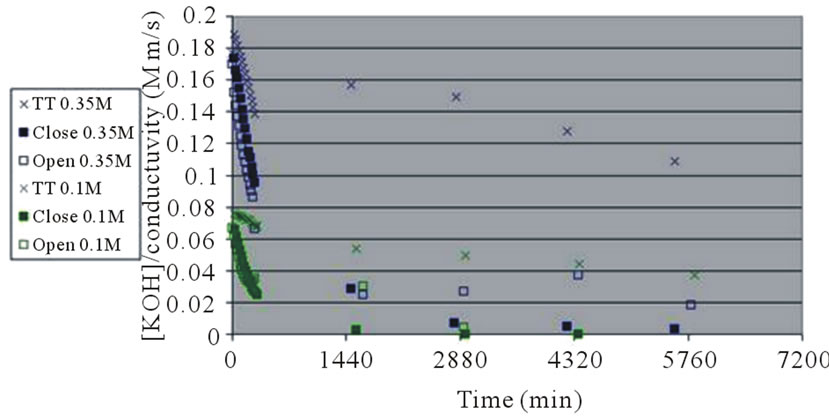
Figure 5. Normalized resistivity ([KOH]/conductivity) changes in open/closed fuel cell, compared to test tube.
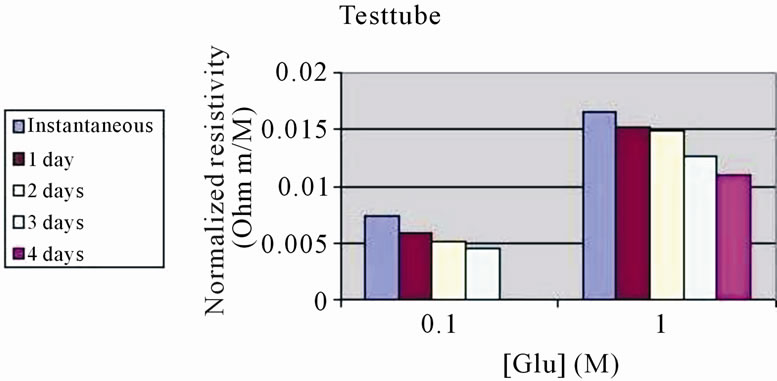 (a)
(a)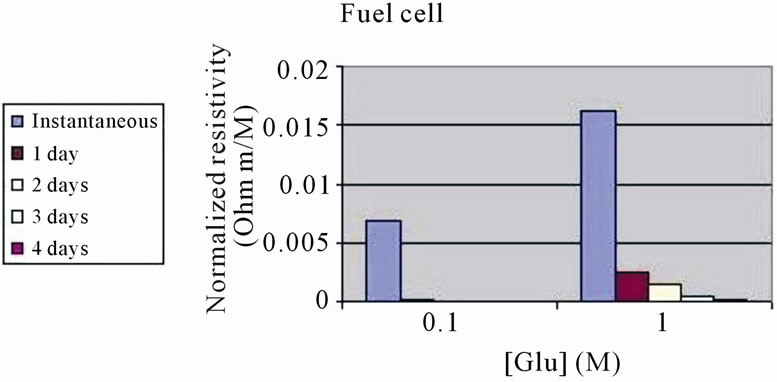 (b)
(b)
Figure 6. Effect of time on normalized resistivity under two glucose concentrations, [Glu]. (a) Test tube; (b) Fuel cell.
6(b) for the fuel cell. It can clearly seen that in the test tube, there was a slow and graduated decrease in normalized resistivity in both glucose concentrations (high and low). In the fuel cell, there was a dramatic drop in normalized resistivity beginning from the first day onward.
4.3. HPLC Analysis of the Glucose-KOH Solution
To observe the chemical changes in an alkaline glucose solution, HPLC analysis of glucose (0.1 M) in KOH (0.1 M) was done (Figure 7). Two dominant species (Rt 9.6 - 9.8 and 13), had no significant change in concentration over time, were evident in the test tube (Figure 7(b)). In the fuel cell, these species concentrations change (either increase or decrease over time). In the fuel cell, there was additional specie (Rt 10.5), which increase in concentration over time (Figure 7(a)). Other species (Rt 7.1, 8 and 8.9), having low concentration, exist in both test tube and fuel cell with no significant changes over time. These findings prove that there are differences between the chemical reactions occurring in the fuel cell (the electrochemical reaction and isomerization) and in test tube (only isomerization).
5. Discussion
5.1. Analysis of the Experimental Results Using the Conductivity-Viscosity Empirical Evaluation for Low Glucose Concentration
Assuming low glucose concentrations
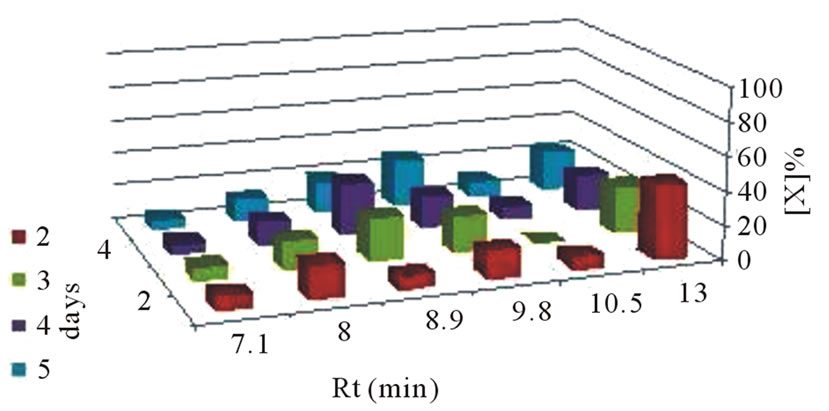 (a)
(a)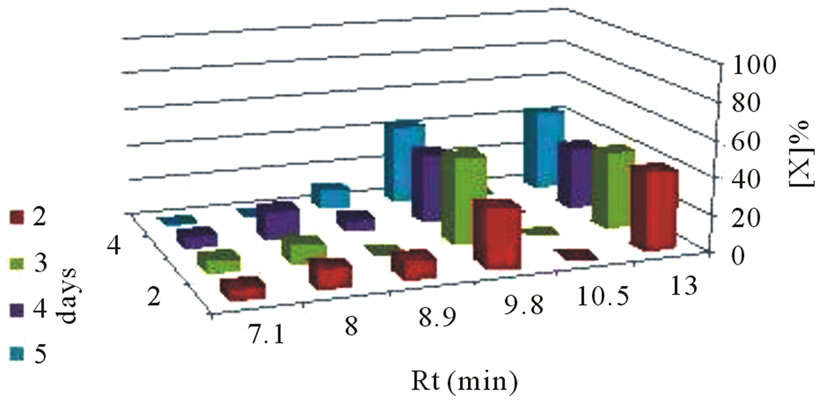 (b)
(b)
Figure 7. Changes in the alkaline glucose solution in: (a) fuel cell, (b) test tube. [Glu] 0.1 M, [KOH] 0.1 M, elution solvent AcN:H2O 80:20.
 , (10)
and assuming
 , (11)
the normalized conductivity (Equation (6)) is simplified to:
 . (12)
The viscosity has a linear dependence on the glucose concentration (Equation (13)) [15]:
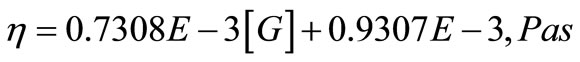 . (13)
Exploring (Equation (13)) and (Equation (12)), it is evidence that the normalized resistivity is a linear function of the glucose concentration, in agreement with the experimental results (Equation (14)), Figure 2):
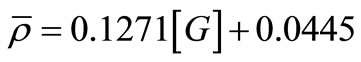 . (14)
By fitting the experimental results (Equation (14)) to Equation (12,13), two values of ri were found: 2.84E–10 m (2.84 Ǻ), and 0.78Ǻ. The error in estimating ri here is approximately 57% relative to its mean value. Both values of  are in agreement with the range of (1.37 - 10) Ǻ obtained from the estimated hydrated and unhydrated ion radii [19]. The minimal value of
 , taking into account the ion radii in crystals and solutions [15], cannot be below 1.37 Å. Hence, the model predicted that the ions were in hydrated form.
The experimental results showed a drop in normalized resistivity over time in a fuel cell (Figure 5).The model explains the experimental time effect by assuming increase in gover time. This finding agrees with the HPLC data showing the production of a chemical species in the fuel cell, which was not present in the test tube.
5.2. Analysis of the Experimental Results Using the Conductivity-Collision Equation Assuming a Low Glucose Concentration
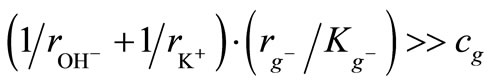
For low glucose concentrations,
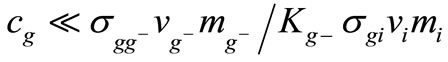 , Equation (9) can be simplified and expressed in Equation (15), in terms of the normalized resistivity as a function of glucose concentration.
 . (15)
Equation (15) shows that the normalized resistivity is linear with the glucose concentration, thus agreeing with the experimental results (Figure 2). However, it does not describe the resistivity of the pure KOH solution, in the absence of glucose, which is expressed by the intercept in Figure 2.
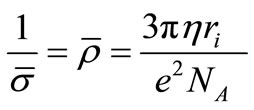
5.3. The Viscosity
The viscosity expression (Equation 16) was evaluated using the mobility definition (Equation (2)) in both the models (Equations (3) and (7)).
 (16)
(16)
Equation (16) shows that the solution’s viscosity, an empirical characteristic of the solution, is basically a function of parameters influencing the collision in the solution, and is linear with the solute (glucose) concentration. This explains the mechanism by which the viscosity influences the solution resistivity.
6. Conclusion
Glucose increases the resistivity of a KOH solution. Two simple physical models were used to explain the contribution of glucose to fuel cell resistivity, based on the solution viscosity or collisions between ions and glucose molecules in solution. The simple collision model proposed here is also applicable to solutions. It predicts the species parameters. Glucose degrades under alkaline conditions in fuel cells, which can increase fuel cell resistivity.
7. Acknowledgements
This study was supported by a grant from the ORT Braude College research committee. The technical assistance of Mrs. J. Bassan and Mrs. R. Asakla are acknowledged.
REFERENCES
- S. V. Alferov, L. G. Tomashevskaya, O. N. Ponamoreva, V. A. Bogdanovskaya and A. N. Reshetilov, “Biofuel Cell Anode Based on the Gluconobacter Oxydans Bacteria Cells and 2,6-Dichlorophenolindophenol as an Electron Transport Mediator,” Russian Journal of Electrochemistry, Vol. 42, No. 4, 2006, pp. 403-404. doi:10.1134/S1023193506040185
- M. Shibazaki and T. Taniuchi, “Jpn. Kokai Tokkyo,” JP Patent No. 2005166356 A2 20050623, 2005.
- X. Xue, J. Tang, N. Sammes and Y. Du, “Dynamic Modelling of Single Tubular SOFC Combining Heat/Mass Transfer and Electrochemical Reaction Effects,” Journal of Power Sources, Vol. 142, 2005, pp. 211-222. doi:10.1016/j.jpowsour.2004.11.023
- K. Nakafuji and A. Muneuchi, “Jpn. Kokai Tokkyo Koho,” JP Patent No. 2006032275 A 20060202 CAN 144: 174271 AN 2006:97621, 2006.
- Z. Rubin and L. Mor, “Electrode Resistance Dependence on Alkaline Glucose Fuel Cell Electrolyte Concentration,” Proceedings of the International Conference of Fundamentals and Developments of Fuel Cells, December 2008, Nancy, pp. 115-116.
- E. Bubis, L. Mor, N. Sabag, Z. Rubin, U. Vaysban, et al., “Electrical Characterization of a Glucose-Fueled Alkaline Fuel Cell,” Proceedings of the 4th International ASME Conference on Fuel Cell Science, Engineering and Technology, FuelCell2006, Irvine, Vol. 2006, 2006, 8 Pages.
- S. P. Moulik and D. P. Khan, “Complexation of Reducing and Nonreducing Carbohydrates with Hydroxides of Some Alkali and Alkaline-Earth Metals,” Carbohydrate Research, Vol. 41, 1975, pp. 93-104. doi:10.1016/S0008-6215(00)87010-X
- Y. Zhou, G. Lin, A. J. Shih and S. J. Hu, “A Micro-Scale Model for Predicting Contact Resistance between Bipolar Plate and Gas Diffusion Layer in PEM Fuel Cell,” Journal of Power Sources, Vol. 163, No. 2, 2007, pp 777-783. doi:10.1016/j.jpowsour.2006.09.019
- P. Costamagna, E. Arato, P. L. Antonucci and V. Antonucci, “Partial Oxidation of CH4 in Solid Oxide Fuel Cells: Simulation Model of the Electrochemical Reactor and Experimental Validation,” Chemical Engineering Science, Vol. 51, No. 11, 1996, pp. 3013-3018. doi:10.1016/0009-2509(96)00190-X
- D. B. Genevey, M. R. Spakovsky, M. W. Ellis, D. J. Nelson, B. Olsommer, et al., “Transient Model of Heat, Mass, and Charge Transfer as Well as Electrochemistry in the Cathode Catalyst Layer of a PEMFC,” Proceedings of the ASME Advanced Energy Systems Division, New York, November 2002, pp. 393-406.
- K. Y. Chan, et al., “Methods and Apparatus for the Oxidation of Glucose Molecules,” United States Patent No. 20020125146, 2002.
- W. Chan, “Fuel Cell Research Laboratory,” Hong Kong University, Hong Kong, 2003. http://chem.hku.hk/%7Efuelcell/demo.htm
- A. J. Bard and L. R. Faulkner, “Electrochemical Methods,” 2nd Edition, John Wiley & Sons Ltd, New York, 2001.
- D. Halliday, R. Resnick and K. Krane, “Physics,” Vol. 2, John Wiley & Sons, New York, 2002.
- D. R. Lide, “Handbook of Chemistry and Physics,” 83rd Edition, CRC Press, Boca Raton, 2002-2003.
- F. Raif, “Statistic Physics, The Berkeley Course of Physics,” Vol. 5, McGraw Hill, New York, 1968.
- J. P. Hansen and I. R. McDonald, “Theory of Simple Liquids,” 3rd Edition, University of Cambridge, Amsterdam, 2007.
- L. Mor, Z. Rubin and P. Schechner, “Measuring Open Circuit Voltage in Glucose Alkaline Fuel Cell Operated as a Continuous Stirred Tank Reactor,” Journal of Fuel Cell Science and Technology, Vol. 5, No. 1, 2008, Article ID 014503.
- T. I. Berlidze and K. L. Magleby, “Probing the Geometry of the Inner Vestibule of BK Channels with Sugars,” Journal of General Physiology, Vol. 126, No. 105, 2005, pp. 105-121. doi:10.1085/jgp.200509286
Nomenclature
Latin Symbols
Ci: Molar concentration of the ith chemical species, kmol/m3
ci: concentration of the ith chemical species, 1/m3
e: Elementary charge, 1.602 × 10⁻¹⁹ C
Kg–: Equilibrium constant for ions generated from glucose, m3/kmol
mi: Ion mass, kg
ri: Length coefficient (also called the “hydrated ion radius”) for the ith ion, m
vdi: Drift velocity, m/sec
vmi: vi is a thermal velocity, m/sec
ui: Mobility coefficient of the ith ion, m2·sec–1·V–1
zi: Signed ionic charge, expressed as the number of elementary charges
Greek symbols
η: Viscosity, Kg·m–1·sec–1
ρ: Electrical resistivity, Ω·m
 : Normalized resistivity, Ω·m·kmol/m3
σ: Electrical conductivity, Ω–1·m–1
σij: Cross section collision between two species i with j, m2
 : Normalized conductivity, Ω–1·m–1·m3/kmol
τij: Time between collisions, sec
Subscripts
g.G: Glucose
I: The ith collide species
J: The jth species collided with
Abbreviations
Å: 10–10 m
g–: Glucose ions (C6H11O6)–
mol: Gram molecular weight
Rt: Retention time, min
TT: Test tube
[X]: Molar concentration (M) of the X chemical species, kmol/m3