Applied Mathematics
Vol.3 No.10(2012), Article ID:23374,7 pages DOI:10.4236/am.2012.310176
Taxpayers Fraudulent Behavior Modeling the Use of Datamining in Fiscal Fraud Detecting Moroccan Case
Applied Mathematics Research Laboratory, Mohammadia Engineering School, Mohammed V University of Agdal, Rabat, Morocco
Email: ameur_farid@yahoo.fr
Received August 3, 2012; revised September 3, 2012; accepted September 10, 2012
Keywords: Tax Fraud; Tax Evasion; Data Mining; Knowledge Discovery in Databases (KDD); Fiscal Policy; Fiscal Reform; Fiscal Control; Fiscal Justice; Taxpayers; Tax Administration
ABSTRACT
The fraudulent behavior of taxpayers impacts negatively the resources available to finance public services. It creates distortions of competition and inequality, harming honest taxpayers. Such behavior requires the government intervention to bring order and establish a fiscal justice. This study emphasizes the determination of the interactions linking taxpayers with tax authorities. We try to see how fiscal audit can influence taxpayers’ fraudulent behavior. First of all, we present a theoretical study of a model pre established by other authors. We have released some conditions of this model and we have introduced a new parameter reflecting the efficiency of tax control; we found that the efficiency of a fiscal control have an important effect on these interactions. Basing on the fact that the detection of fraudulent taxpayers is the most difficult step in fiscal control, We established a new approach using DATA MINING process in order to improve fiscal control efficiency. We found results that reflect fairly the conduct of taxpayers that we have tested based on actual statistics. The results are reliable.
1. Introduction
The behavior of fraudulent taxpayers has a negative impact on the resources available to finance essential public services of the country; it creates distortions of competition and inequality, harming honest taxpayers.
The study of the determinants of fiscal policy has been published by the Organization for Economic Cooperation and Development (OECD), shows that in recent years, tax reforms were implemented to answer not only the need to improve the performance of the economy, but also to banned the phenomenon of evasion and tax fraud.
Concerning Morocco, the government is undergoing many changes in fiscal system. The challenge is to have a competitive and efficient tax system which helps to improve the economic and social environment.
The role of tax administration is to stop such behavior that alters the social contract. In fact, there is always a difference between the methods and tools of tax fraud and tax audit. But to reduce the cost of this unequal conflict, tax administrations have to be interested in understanding the manifestations of this phenomenon and its causes, they should give more attention to the factors that determine the behavior of taxpayers so that they can then design and implement a more effective set of responses that can address the underlying causes of indiscipline and not the symptoms.
In this paper, we examine this phenomenon based on the model of Allingham and Sandmo 1972 [1] improved by Yitzhaki 1974 [2], Koskela 1983 [3] and C. Bazart 2002 [4].
Based on the fact that the detection of fraudulent taxpayers is the most difficult step of fiscal control, We established a new approach using DATA MINING process in order to improve fiscal control efficiency.
This paper is organized as follows:
In the first section, after some generalities about tax fraud, we track the results of some previous studies that have examined the issue of the behavior of fraudulent taxpayers.
In the second section, before outlining the results of our theoretical work, we examine the relationship of tax system parameters and tax fraud decision by explaining the results of some authors who worked on the model of Alligham and Sandmo [1]. After that, we present a new approach which can help to improve tax audit efficiency using Tanagra1 software, based on the data of the companies that have been audited.
We conclude this paper by showing the interests and perspectives of our work in practice.
2. Generalities of Tax Fraud and Some Previous Studies
2.1. Definitions
Tax fraud and tax evasion are evoked to describe any behavior intended to reduce or eliminate the tax debt owed by a taxpayer. This leak is an old phenomenon, common with diverse backgrounds and illustrations.
Strategies of tax evasion and tax fraud are diversifying in an international environment and becoming more complex. Avoiding tax payment become easier in the current context of freedom and speed of flow of funds and the development of electronic commerce.
In its report “Fraud against the tax and its control” of 2007, The Council of compulsory contributions of France, has informed the ambiguity of the distinction between the methods used by taxpayers to evade taxes. To use the definition already stated in this report, the term “fraud” is often used to refer to all cases of non compliance by a taxpayer of his or her tax obligations. But sometimes we confuse between tax fraud and tax irregularities (Figure 1).
Tax irregularities include all cases where the taxpayer does not meet his fiscal obligations. While, tax fraud requires an intentional act by the taxpayer to circumvent the law in order to evade payment of taxes. Therefore, tax fraud is a subset of tax irregularity. Fraud can be generally defined as a form of criminal act of reducing in an illegal way taxes duties2.
Another concept, the tax evasion is seen as the set of behaviors of the taxpayer that aim to reduce the tax which he must normally pay. If he is using legal means, the escape then enters in the category of optimization. However, if it is based on illegal techniques or concealing the true extent of its operations, the escape will be similar to fraud.
2.2. Tax Fraud Causes
In this section we will see the different causes of tax fraud:
Technical causes: The technical causes of fraud are linked to the complexity of the tax system and the difficulty of assessing the tax base by the tax auditor.
Political causes: Policy options for granting tax benefits and the most significant pressure groups in decision-tax fueled the trend to fraud. Recognizing this fact, the Moroccan tax authorities in recent years, work for the gradual reduction of tax exemptions and consolidation of some tax fairness, as actions taken at international level.
Economical causes: The economic situation of tax-
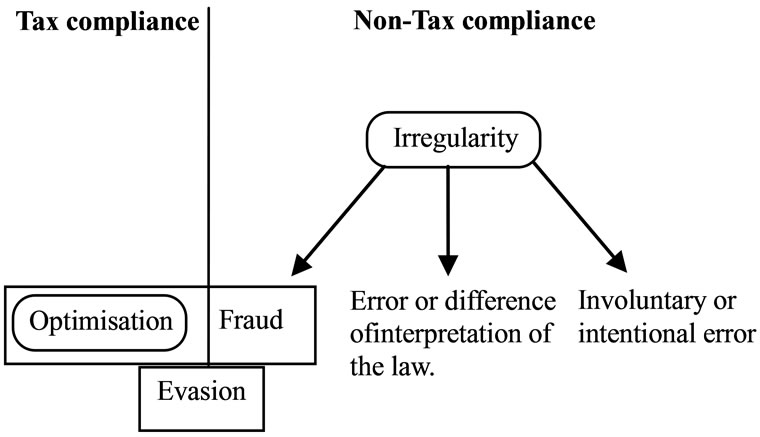
Figure 1. Mapping of different tax escape concepts. Source: Report of “Fraud against the tax and its control”—The Council of compulsory contributions of France—2007.
payers affected by economic conditions often controls their behavior and may encourage tax fraud.
Moral and psychological causes: Many behavioral or psychological factors have been identified to have an impact on the behavior of taxpayers regarding their tax obligations:
- The perception of policy fights against fraud;
- The social and cultural norms and the psychological and moral considerations of taxpayers;
- The interaction with governments and taxpayers to the assessment of tax administration, tax system, see public policy in general.
2.3. Consequences of Tax Fraud
As consequences of tax fraud, we can distinct three dimensions:
- Financial dimension: tax fraud represents a loss of resources for the state or local authorities;
- Social dimension: it is against justice and equity;
- Political dimension: it challenges to the legitimacy of power.
We can note that tax fraud:
- Limit the financial resources of the state;
- Falsify statistics (under evaluation of production, sales ...)
- Disturb the calculation of macroeconomic aggregates;
- Encourage the informal or underground economy;
- Encourage the unfair competition between businesses;
- Block the government actions;
- Cause social tensions;
- Accelerate the weakness of the state and therefore the institutions;
- Destroy the spirit of adventure and risk needed for investment;
2.4. Relationship to the Literatures
The phenomenon of tax fraud was studied by Alling-Ham and Sandmo [1], their work was complemented by Yitzhaki [2], Koskela [3] and C. Bazart [4]. The original assumptions of the model of Allingham and Sandmo [1] were gradually released; however, a consensus remains on some of them. The main characteristic of these assumptions is a methodological choice, based on observation. This methodology argues that tax evasion is a decisionmaking under uncertainty. Besides, the agreement also appears on the parameters that affect the optimal decision of individual taxpayer (The attitude to risk, the tax rate, the actual level of income, the probability of detection, the penalty incurred following the detection).
Another complementary approach to the analytical one for elaboration of Allingham and Sandmo [1] Model, it concerns fiscal fraud detection basing DATA MINING techniques to construct profiles of fraudulent behavior. We based our work of this section on a study established by Fawcett, T. et al. [5] and Bonchi et al. [6].
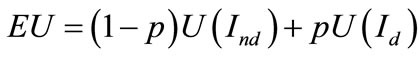
To use the advanced of the model of Allingham and Sandmo 1972 [1], the taxpayer’s behavior is consistent with the axioms of von Neumann-Morgenstern utility function and is solely dependent on disposable income. The individual is assumed to be risk-averse thus this function has a positive marginal utility and strictly decreasing. In order to represent taxpayers’ behavior regarding risk, we use measures of risk aversion of ARROW PRATT which are defined and recorded by:
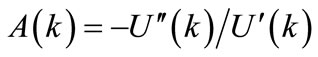 index of absolute risk aversion.
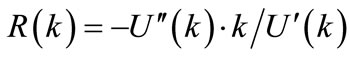 index of relative risk aversion.
With K income level and:  and
and .
.
The model of ALLINGHAM and SANDMO 1972 [1], is given by:
 (1)
(1)
with:  and
and 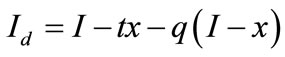
while:
I: Real income of the taxpayer, here is an exogenous variable and is known but ignored by the taxpayer of the tax administration.
Ind: Disposable income where the taxpayer is not found in the fraud.
Id: Disposable income after the tax audit of the taxpayer.
x: Income declared decision variable of the taxpayer.
t: tax rate, constant on the amount of reported income, x.
q: The rate of penalty for unreported income  with
with 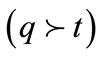 as the penalty rate at the same time includes the repayment of the tax due and the penalty for fraud.
p: The probability of detection. It is assumed that after the fiscal control, tax administration has a comprehensive knowledge of the actual amount of taxpayer’s income.
3. Relationship: Tax Audit-Tax Fraud Detection
3.1. Results and Limits of Allingham and Sandmo Model
The hypotheses of proportional taxation of declared income associated with a penalty on dissimulated income 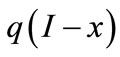 are the founder hypothesis of the model of Allingham and Sandmo [1]. In this context, the taxpayer chooses the amount of income to declare, x, in order to maximize his expected utility.
The results obtained show that increasing the penalty has a positive incentive on taxpayer to be honest in his statement. But the variation in declared income compared to the level of taxation “t” is undetermined in the Model of Allingham and Sandmo [1]. There is the same thing for the question, does the proportion of reported income increases as disposable income.
This indetermination was lifted by Yitzhaki [2] who in 1974, considers the problem of tax fraud as a framework similar to that defined by Allingham and Sandmo [1], but in which the penalty, denoted q, concerns specifically the evaded tax: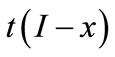 .
.
In the model of Allingham and Sandmo [1], as well as for others models developed thereafter, the hypothesis that after tax audit, tax administration has a comprehensive knowledge on the real value of the chosen taxpayer’s income. But in the reality, tax administration can’t detect all the anomalies or the omissions and the fraud that can be made by a taxpayer in order to minimize his revenue declaration.
3.2. Our Model
3.2.1. Theoretical Study
Let “r” be the coefficient of tax audit efficiency. As we mentioned in 2.1, tax administration can not detect all the anomalies or the omissions and the fraud that may make a taxpayer in order to minimize his revenue declaration. Basing on the assumptions of the model of Allingham and Sandmo 1972 [1], C. Bazart [4] showed that tax fraud decreases when real income rises. This result represents a special case for our proposal model with an efficiency of 100% or r = 1.
The model of Allingham and Sandmo [1] as it is given in Equation (1) (Section 2.4) became:
 (2)
(2)
with: 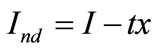 and
and 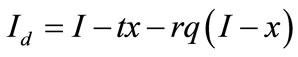
The taxpayer chooses the amount of income to declare, x, in order to maximize his expected utility, and the conditions for maximum are: (the second order condition is denoted D).
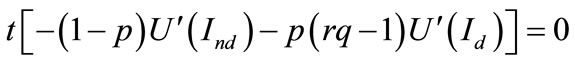 (3)
(3)
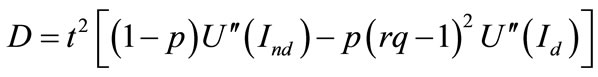 (4)
(4)
Proposal: For a given level of penalty q and given an efficiency of tax audit r, the tax fraud would decline when real income rises if  and it increases in function of income in the opposite case.
Our Model:
Others Models:
From Table 1, we can notice that in others models (Section 3.1), the efficiency “r” is equal to 1 (100%). But in our model (Table 2); the value of “r” is between 0 and 1. In some cases it can be higher than 1.
Taking the case of Morocco, for each correction of the tax base after fiscal control, besides the payment of the tax evaded, the taxpayer will be penalized by 15% for nonreporting, 10% for non-payment, 5% for first months of delay and 0.5% for each month of delay, which gives a minimum value of q = 1.30. So, if the effective control is less than 80%, fraud increases with income. But if we increase the penalty and keep the same level of effecttiveness of tax audits, taxpayers who have high income are more honest than those with lower incomes. This result is quite logical; for a low income, even if we increase the punishment, its effect on disposable income of the taxpayer fraud is minimal.
3.2.2. Empirical Study
In a sample of 187 companies which have been audited.

Table 1. Others Models—Matrix q*r (penality rate *tax audit efficiency).
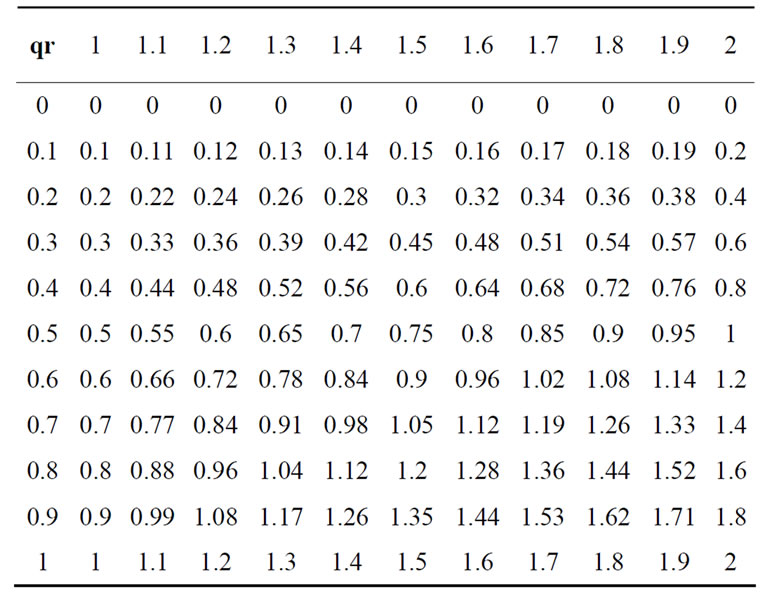
Table 2. Our Model—Matrix q*r (penality rate *tax audit efficiency).
We tried to verify the theoretical result that we obtained.
The determination of real income remains a difficult problem to solve. That’s why we made some scenarios about the effectiveness of tax audits with a view to have an idea on real income. The scenarios considered, reflect actual cases that may occur. We made a simulation for 25 possible scenarios for effective fiscal control:
We took the following values:
r1 = 0%, r2 = 5%, r3 = 10%, r4 = 15%, r5 = 20%, r6 = 25%, r7 = 30%, r8 = 35%, r9 = 40%, r10 = 45%, r11 = 50%, r12 = 55%, r13 = 60%, r14 = 65%, r15 = 70%, r16 = 75%, r17 = 80%, r18 = 85%, r19 = 90%, r20 = 95%, r21 = 100%, r22 = 105%, r23 = 110%, r24 = 115%, r25 = 120%.
The value of the efficiency rate of tax audits “r” varies depending on the companies auditing folders and depending on the skills of the auditor who will conduct the monitoring. The values of the scenarios are assumed as averages for the simulation.
Classification by size of company:
As adopted by the Moroccan tax law, we have the following classification.
For a given enterprise:
• If the turnover is less than 3,000,000 dirhams, it is a very small enterprise.
• If the turnover is between 3 million and 50 million dirhams, it is a small and medium enterprise.
• If the turnover exceeds 50 million dirhams, this is a large company.
Analysis of the population studied by size:
After analyzing the population under study (Figure 2), we found that 65.24% are small enterprises, 31.55% are small to medium size and 3.21% are large companies. This is quite logical that more than 90% of Moroccan companies are small and medium enterprises and very small enterprises.
By studying the correlation between real income calculated for each scenario, and the amount of the adjustment, we found the following graph, Figure 3.
According to Figure 3, we notice that when the efficiency of tax control “r” increases, the correlation coefficient of real income/fraud becomes very small. This result confirms what we found as a theoretical result. It should be noted that for the case of Morocco, the real value of the control efficiency is low due to the limited number of auditors and the complexity of the task of tax audits (taxpayers’ cooperation, availability of the information...).
3.2.3. Proposal Approach for Tax Fraud Detection
In this section, we try to establish a new approach which helps to support audit planning. We are realizing a case study that explains our approach basing on the techniques of DATA MINING on Tanagra Software, especially, the techniques of classification and prediction using decisions

Figure 2. Number of companies depending on their sizes.
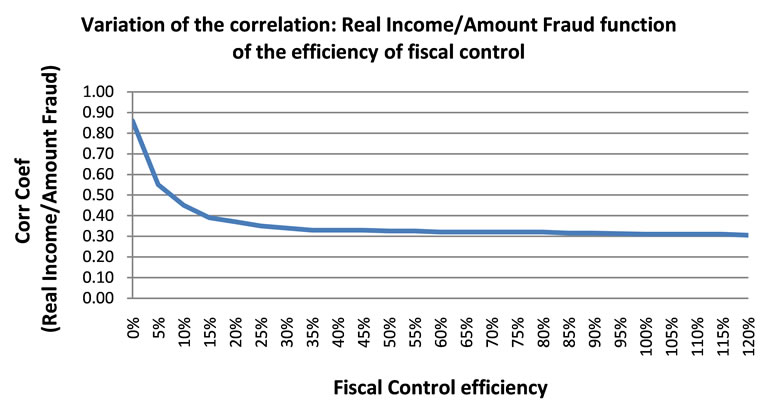
Figure 3. Variation of the correlation between real income and the amount fraud.
trees.
1) Data preparation
It is important to note that due to the confidential data of taxpayers, we conducted a random generation of the data on Excel.
The database contains 3500 companies, including 500 which were submitted to tax audit. Therefore we have the information if the companies are fraudulent or not. We have also a turnover, income tax and tax paid, as well as the activity the region of situation of each company.
For the generation of the data, we considered the variation interval of each variable (Turnover, profit tax, tax paid).
We note: CA: the turnover, RF: Income tax, I: Tax paid.
Our study focuses on small and medium enterprises and very small businesses. Therefore, the turnover varies between zero (0) dirham and fifty million dirhams (50,000,000 DHs). The random function used in Excel is:
= ALEA.ENTRE.BORNES (0; 50,000,000)
Referring to experts from tax department, we have taken as variation interval of taxable income: [–30,000,000, 30,000,000]. The random function in Excel is:
=ALEA.ENTRE.BORNES (–30,000,000; 30,000,000)For the amount of tax, it is a dependent on the turnover and taxable income mentioned above.
According to Moroccan tax law, the tax rate for small and medium enterprises is 30%, while for very small businesses, it is 15%. So the function in Excel is:
Tax = if (CA > 3000000; max (0.005 * CA, * RF 0.30) max(0.005 * CA,* RF 0.15)).
2) Format of database obtained
Using the functions mentioned in a), we obtained the following database:
Explanation of the contents of the Table 3:
The columns (ID, CA, RF and I): We have 3500 companies and we have also turnover, income tax and the tax paid.
Column “Fraud”: for the first five hundred companies, they were submitted to tax audit and we have the information if they are fraudulent or not. For the companies which weren’t submitted to a tax audit, we have no information about fraud and that’s the purpose of this application.
In order to examine our data file with Tanagra, we must add a variable earning or prediction that we called “SAMPLE”, this variable takes the information “LEARNING” for the first 500 companies (Which were submitted to tax audit) and takes the information “TEST” for the remaining 3000 companies.
After importing the data on Tanagra, we introduce DISCRETE SELECT EXAMPLES component (INSTANCE SELECTION tab) into the diagram. Then, we activate the PARAMETERS menu.
The attribute selection is SAMPLE, individuals are learning the value LEARNING.
We click on the VIEW menu. Tanagra tells us that among the 500 observations, 3500 are now reserved for the construction of the model.
3) Decision tree
Using “DEFINE STATUS” component, we clarify the role of different variables. We select Fraud as a TARGET variable, and “AC”, “RF”, and “I” in INPUT.
We insert the component C-RT (SPVLEARNING tab) that implements the method in CART TANAGRA. We activate the context menu Supervised PARAMETERS. We fine the result as detailed below (Table 4 and Figure 4):
The apparent error rate is very small: 1.4%.
It shows that only seven individuals are misclassified; two of the class “no” and five of the class “yes”.
Evaluation of the sample test:
To obtain an unbiased assessment of performance prediction tree, we try to evaluate the prediction.
The components “supervised learning” TANAGRA generates automatically a new column of prediction. The aim is to confront in a confusion matrix that prediction with the real class of individuals.
At first, we introduce a new DEFINE STATUS component in the diagram. We select CLASS as a TARGET CLASS, and the new column in PRED_SPVINSTANCE_ 1 as an INPUT.
Then we insert the TEST component (SPV LEARNING ASSESSMENT tab). We operate the PARAMETERS menu, we find that we can make the assessment on the data previously selected (500) or on those that were set aside (3000).
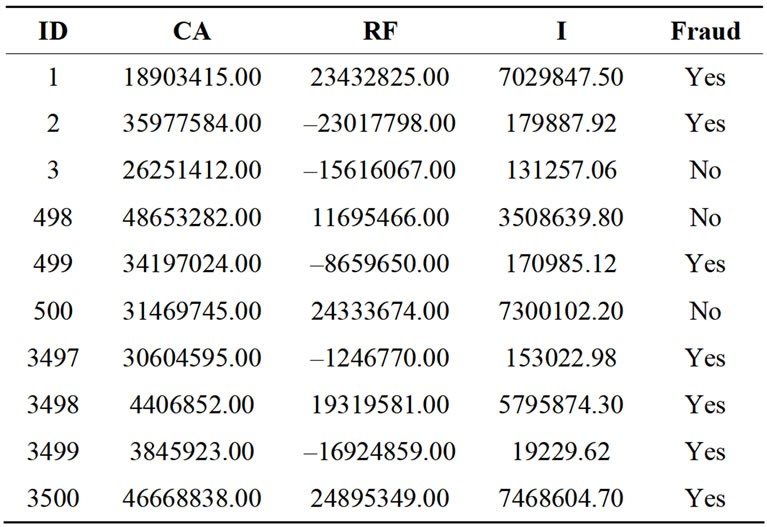
Table 3. Form of DATA.
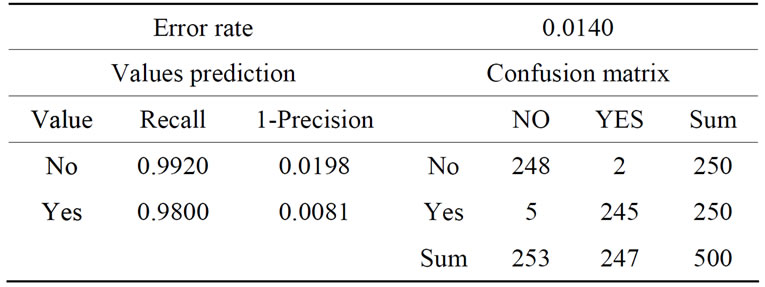
Table 4. Matrix confusion on Tanagra.
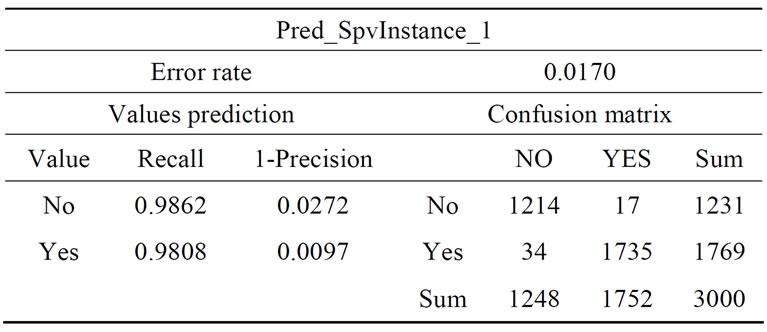
Table 5. Confusion matrix.
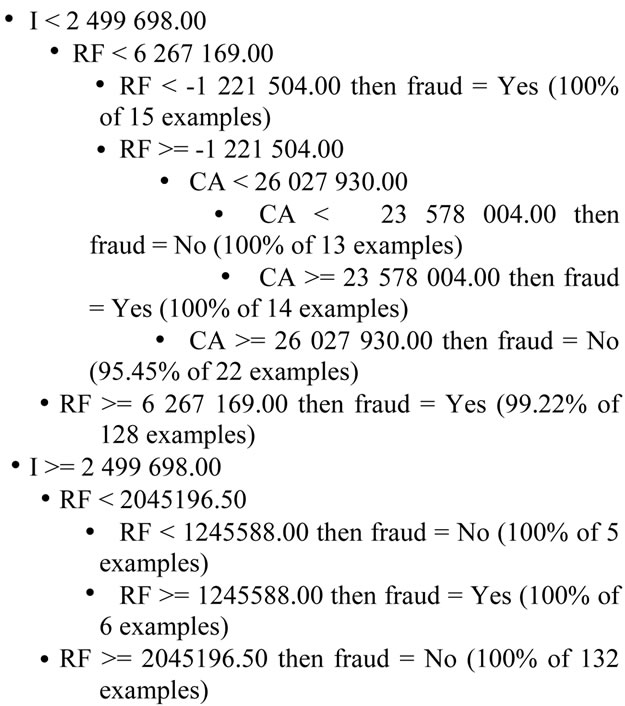
Figure 4. Decision tree.
We click on VIEW, the error rate test of the tree is 1.7% (Table 5). if we use this tree to predict the class membership of a new individual, we have 1.7% of “risks” to achieve an erroneous prediction.
This percentage is very low, which mean that the fraudulent companies are well known from 3500 companies studied.
4. Conclusion
As a comparison between the results of our model and the others models, we can notice that this latter represent a special case of our model.
Where tax audit efficiency is equal to 1 (100%), our model give the same results as others model, but in the reality tax audit efficiency can’t be at its maximal value and this is the main goal of our contribution.
Tax administration is always trying to find and control companies that represent a major risk in terms of tax fraud. The result of our work will be a guide for the selected companies that will be controlled by referring to the parameters of the tax system that is in place. Moreover, based on this finding and by applying it to the Moroccan case that represent a very low efficient in terms of tax audits and that sanction policy are fairly flexible. It is important to address the control to big businesses. Yet, such companies represent a negligible percentage of the overall tax population and a concentrated and continuous auditing will disrupt their development and their growth, especially that their contribution exceeds 80% of total tax revenues. On the other hand, the audit of small and very small enterprises is expensive for the tax administration because it needs to increases the number of files to audit and increase also the number of auditors as well. To sum up, the tax authorities must look for other tools to struggle fraud, especially building trust relationships with taxpayers.
REFERENCES
- M. G. Allingham and A. Sandmo, “Income Tax Evasion: A Theoretical Analysis,” Journal of Public Economics, Vol. 1, 1972, pp. 323-338. doi:10.1016/0047-2727(72)90010-2
- S. Yitzhaki, “A Note on Income Tax Evasion: A Theoretical Analysis,” Journal of Public Economics, Vol. 3, No. 2, 1974, pp. 201-220. doi:10.1016/0047-2727(74)90037-1
- Koskela, “On the Shape of Tax Schedule, the Probability of Detection, and the Penalty Schemes as Deterrents to Tax Evasion,” Public Finance 38, 1983, pp. 70-80.
- C. Bazart, “The Behavior of Tax Fraud: Taxpayers Facing Tax Administration,” French Journal of Economics, Vol. 16, 2002, pp. 171-212. 10.3406/rfeco.2002.1524
- T. Fawcett and F. Provost, “Adaptive Fraud Detection,” Data Mining and Knowledge Discovery, Vol. 1, No. 1, 1997, pp. 291-316. doi:10.1023/A:1009700419189
- F. Bonchi, F. Giannotti, G. Mainetto and D. Pedreschi, “A Classification-Based Methodology for Planning Auditing Strategies in Fraud Detection,” KDD’99 Conference Proceeding of the 5th ACM SIGKDD, San Diego, CA, 15-18 August 1999, pp. 175-184.
NOTES
1Ricco Rakotomalala, “TANAGRA: un logiciel gratuit pour l’enseignement et la recherche”, in Actes de EGC’2005, RNTI-E-3, Vol. 2, pp. 697-702, 2005.
2To borrow a definition used by the council tax in France in 1977, “there is fraud when it comes to criminal behavior deliberate”.