Applied Mathematics
Vol. 3 No. 3 (2012) , Article ID: 18111 , 15 pages DOI:10.4236/am.2012.33045
The Assessment of the Arising of Food Allergy among Antiacid Users Using Mathematical Model
1UNICAMP-IMECC-DMA, Praça Sérgio Buarque de Holanda, Campinas, Brazil
2Division of Allergy, Clinics Hospital of FM-USP, São Paulo, Brazil
Email: *hyunyang@ime.unicamp.br
Received January 4, 2012; revised February 15, 2012; accepted February 22, 2012
Keywords: Deterministic Model; Sensitization of Immune System; Cassava Allergens; Proton Pump Inhibitors; Public Health
ABSTRACT
The first case of a new food allergy, an anaphylactic reaction to Manioc (Manihot esculenta or Manihot utilissima), also called cassava and tapioca, was described in 2001. Cassava is a tuber widely consumed in Brazil, which has been consumed by native Indians, i.e., more than 500 years ago, so why are the first cases just emerging now? We address this question by developing a mathematical model considering the fact that proton pump inhibitors (PPIs) for digestive disorders maintain the cassava allergen intact due to the elevation in pH of gastric juice, thereby facilitating its presentation to the immune system. The model assumed the mass action law including saturation to describe the recruitment of PPIs users, and Hill function to describe the sensitization of immune system by the allergens and the acquisition of full food allergy. Analytical results were obtained from the model, and numerical simulations were done. The estimated period of time elapsed since the introduction of antiacids before the diagnosis of food allergy was 15 years. The food allergy may become a public health problem, if PPIs are being used indiscriminately and irregularly. The results obtained from the analysis of the model suggest that the use of nonprescription antiacids, like PPIs, may be recommended or approved by the physician in order to avoid the rising of food allergy.
1. Introduction
In 2001, Chiron et al. [1] described the first case of a new food allergy, an anaphylactic reaction to Manioc (Manihot esculenta or Manihot utilissima), also called cassava and tapioca. In 2004, Galvão et al. [2] described, nearly at the same time as a group of researchers from Portugal [3], the first case of cross-reactivity between cassava and natural rubber latex. Another case was reported by Ibero et al. [4]. Cassava is a tuber, rich source of carbohydrate widely consumed in Brazil and in more than 80 countries, mainly in South America, Asia and Africa. In Brazil, this food has been consumed since before the discovery of the country, by native Indians, i.e., more than 500 years ago, so why are the first cases just emerging now? A simple and superficial explanation would be a deficient diagnostics. However, this explanation is at least scarce giving that technical conditions and specific knowledge for a detailed diagnostics in allergy is available since years. Diagnostics in allergy evolved a lot in the last decades especially after description of IgE [5]. Furthermore, even earlier than development of specialized techniques medical literature already discussed clinical reports and therefore new allergies could be detected and diagnosed by clinicians. Accordingly, it seems that allergy to cassava is indeed a recent problem and considering the long period of consumption and population exposure to this food we can conclude that presumably one or more factors contributed to sensitization process and progression to allergy. In attempt to elucidate the problem our group investigated new cassava allergens from clinics to molecular biology, including the identification of a new allergen (the Man e 5) with cross reactivity to Hev b 5 from natural rubber latex [6].
Back to the fundamental question, why only now is this allergy been detected and the cases are increasing? One hypothesis that has been considered is the increasing use of proton pump inhibitors (PPIs) for digestive disorders [7]. This therapeutic class was introduced in 1988 and today they are among the most used drugs worldwide, including Brazil. Studies carried out by the group of HCUSP with this new allergen have demonstrated that this protein is part of a very special group of proteins called “natively unfolded or intrinsically unstructured” [8] that have been shown experimentally or are predicted to lack ordered structure [9]. These characteristics make it extremely labile to the action of the pepsin in the low pH of gastric juice, leading to its degradation in seconds (unpublished data). Antacid medications (PPIs) cause leaky gut syndrome, where food is absorbed before it is completely digested. This can result in both food allergies and immune exhaustion [10,11]. In this way, the elevation of the pH caused by PPIs results in maintenance of this cassava allergen intact, thereby facilitating its presentation to the immune system.
All the facts and evidences presented above lead us to a second question: why was allergy to cassava found in Brazil around 2002, if the PPIs were introduced around 14 years earlier in 1988? To answer this question we must consider some factors. From the beginning of the marketing of a new drug until the exponential growth in its use there is an elapse of time. In addition to this, new drugs with similar actions emerge. Moreover, we must consider that only part of the population uses the drug indiscriminately and irregularly, and that only part of it is genetically predisposed to sensitization. We must also take into consideration the time of sensitization to a new allergen and the period of time between the onset of symptoms and diagnosis.
The use of antiacids is triggered by a variety of conditions, ranging from stomach upset, heartburn, and nonulcer dyspepsia to verified gastric and duodenal ulcers. Antiacids have been found to be effective in the management of heartburn and ulcer dyspepsia and are also effective in the maintenance treatment of duodenal ulcer disease [12]. Drugs such as the H2-receptor antagonists, sucralfate, pirenzepine, and omeprazole, which have been introduced during the last 15 - 20 years, have to a great extent replaced antiacids in the treatment of peptic ulcer. The introduction during recent years of new treatment strategies that aim at the eradication of Helicobacter pylori may also have influenced the use of antiacids. However, the use of antiacids in less-severe forms of dyspepsia is very common, and antiacids still play a major role in the treatment of acid-related disorders [13]. Most dyspeptic symptoms are dealt with by patients, without seeking medical advice [14]. Corder et al. [15] have shown that the majority (80%) of those with dyspeptic complaints who did not consult a physician used simple antiacids. Furu and Straume [16] reported the overall prevalence of antiacid use about 10%, which is much higher than reported in a survey from Finland, in which only 3.7% reported use of antiacids [17].
Health surveys may collect information on nonprescription medications and also assess health status, risk factors, and sociodemographic variables at the individual level. Dyspepsia and related symptoms obviously represent the most common reason for the use of antiacids. However, there is reason to believe that additional factors such as general health status, lifestyle, and utilization of health services are associated with the use of antiacids, but no studies have explicitly tried to assess these associations [16]. Aiming to assess the risk of appearance of food allergy due to the increasing trend in the antiacid usage, we develop a mathematical model.
The paper is structured as follows. A simple mathematical model is developed aiming the assessment of the prevalence of food allergy among antiacid users (Section 2). We determine the steady states of the model, and the stability of the equilibrium points (Section 2). Also numerical results are presented with discussions (Section 3). Finally we present conclusion (Section 4).
2. Model
Our objective is the development of a simple mathematical model to describe the prevalence of food (cassava allergen) allergy in a population since the introducetion of antiacid by pharmaceutical industries. One of the effects of the antiacid is the elevation of pH in the stomach. As a consequence macro-proteins are not completely cleavage to aminoacids, and micro-proteins are absorbed by the surrounding epithelial cells and circulating immune cells (macrophages, dendritic cells, etc.) can recognize epitopes of these micro-proteins. In normal immune response, however, these epitopes are considered as self, and no immune reaction is promoted. Nevertheless, in some persons, the immune cells can be sensitized by epitopes, and, in conjunction with genetic predisposetion, environmental factors, etc., plasma cells are promoted to release antibodies (a comprehensive biological basis of food allergy can be found in [18]).
Our aim is to assess the prevalence of food allergy among persons in a community, rather than the individual development of the allergy [19]. A mathematical model is developed by assuming the following hypotheses.
Before the introduction of antiacid by pharmaceutical industries, we assume that there are not food (cassava allergen) allergic persons, and they are considered naive persons. The number of naive persons at time t is denoted by P. In a given time, antiacid medication is introduced in a completely naive population. Depending on the amount of budget applied by industries to promote the medicine, and on the efficacy of the antiacids, the number of antiacid users at time t, denoted by U, increases with time, but attains a saturation after a period of time due to, for instance, regulation of the medicine usage, less adherence of naive population, and even the limited capacity of production by pharmaceutical industries. We translate both features supposing that the incidence of new users is proportional to the numbers of naive persons and antiacid users, that is, . This kind of interacting function was used to describe the uptake of drugs by cancer cells [20]. The adherence to antiacid usage depends on the parameter
 , named recruitment rate, and takes into account the marketing towards naive persons (P) and the efficacy measured by users (U). The recruitment of antiacid users follows mass action law for small number of antiacid users (
 , for
, for ) [21], but at increased number of users, the recruitment is saturated with respect to the users (
 , for
, for ). The parameter
  is a scaling factor of recruitment: for lower values, the effect of saturation occurs very quickly, and the mass action law is practically absent (see Appendix A).
Due to the residuals of micro-proteins (food allergens) in stomach which are absorbed by epithelial cells, immune system of antiacid users can be sensitized. This sensitization is strongly dependent on the amount of food allergens [22] that are presented to antigenic presenting cells (APC). In general there is a threshold of food allergens concentration that can effectively sensitize immune cells. These micro-biological behavior are translated to the populational sensitization by the factor . The parameter
  is the sensitization rate of antiacid users, which transfers these users to a group of sensitized persons (S, the number of sensitized persons at time t). The occurrence of sensitization is low for small number of antiacid users (
 , for
, for ), but at increased number of users, the occurrence is saturated (
 , for
, for ). This saturation is due to the threshold in the amount of food allergens in a person. The parameter
  is a scaling factor of sensitization.
Among sensitized persons, due to genetic predisposetions, environment changes, etc., some individuals are actually driven to acquire immune response against food allergens. This biological event occurs less frequently than sensitization, hence we assume that acquisition of food allergy obeys . The parameter
  is the allergic reaction acquisition rate of sensitized persons, which transfers these individuals to a group of food allergic persons, denoted by A, the number of food allergic persons at time t. The occurrence of food allergy acquisition is very low for small number of sensitized persons (
 , for
, for ), but at increased number of sensitized persons, the occurrence is saturated (
 , for
, for ). The parameter
  is a scaling factor of food allergy acquisition.
Both sensitization and food allergy acquisition were described by Hill function of order n [23] (see Appendix A). In biochemistry, the binding of a ligand to a macromolecule is often enhanced if there are already other ligands present on the same macromolecule. In other words, once a ligand is bonded to the enzyme, its affinity for other ligand molecules increases. By using higher order for the allergy acquisition (n = 3) than sensitization of naive person (n = 2), we are assuming that there are much more factors needed to trigger allergic reaction than sensitization.
Besides the allergy acquisition parameters, we assume that all persons are under the same mortality rate , with
  being the life expectancy. We also assume that antiacid users return to naive group at a rate
  of abandonment of the medicine. We also assume that there is an effective treatment (when available) that cures allergic persons, and they return to sensitized group at a rate
  of treatment.
The above four sub-populations comprise a constant total population N = P + U + S + A. Let us define the proportions ,
,  ,
,  and
and , and new parameters
 ,
,  and
and  . The per-capita scaling parameters
  and
and  are regarded to the critical values, while
  does not bear this meaning, due to the linear relation (see Appendix A). For instance, there is a critical number
  such that for
  sensitization is small, while for
  it is big. Hence, if the scaling parameter
  is big, the critical
  is big. The same argument is valid for allergy acquisition scaling parameter
 .
.
Based on the above definitions of variables and model’s parameters, the dynamics of the food allergy acquisition is described by the following system of equations
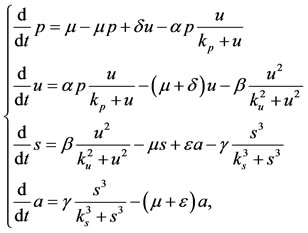 (1)
(1)
where . Dynamical trajectories are obtained using the following initial conditions (at
 )
)
 (2)
(2)
which represents introduction of antiacid medication at  in a community previously free of this medicine. The initial value
  represents the proportion of persons who were coopted by intense marketing of pharmaceutical industries just before the introduction of antiacid.
In Table 1 we present the summary of variables and parameters of the model.
Let us determine the steady states of the system of Equation (1), and assess the stability of these equilibrium
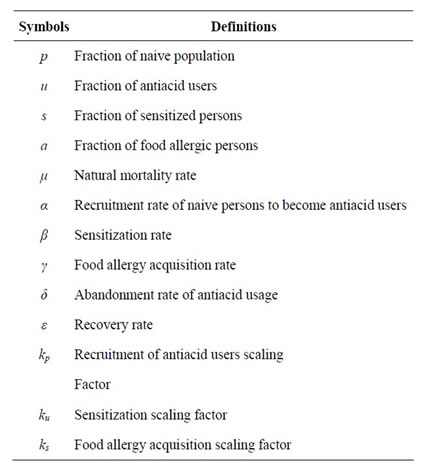
Table 1. Summary of the variables and parameters of the model.
points.
The steady states, denoted by , can be determined by letting the derivatives equal to zero in the first members of the system (1). One of the steady states is the trivial equilibrium point
  given by
 (3)
(3)
which corresponds to the population free of antiacids, hence free of food allergic persons.
To establish the stability of the trivial equilibrium point, we evaluate the eigenvalues of the characteristic equation associated to the matrix obtained by linearizing the system (1) around this equilibrium point. All eigenvalues will have negative real part if the Routh-Hurwitz criteria are satisfied [21]. Hence,  , is stable if
 , where
  is the threshold of
 , and is given by
 (4)
(4)
(see Appendix B, where the global stability using Lyapunov function is also shown). If the rate of recruitment of naive individuals ( ) is lower than
 , then the antiacid users are going to extinction. As a pharmacological marketing point of view, the efficacy of a medicine must be confirmed by users who maintain the use. When
 , the trivial equilibrium becomes unstable, and the anti-acid users are sustained by the recruitment of naive persons.
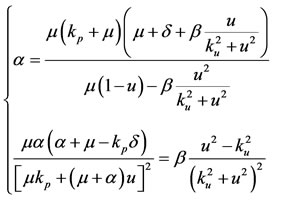
Let us determine the non-trivial equilibrium point . From the first two equations of (1) in the steady state, we obtain
 (5)
(5)
with  being the positive solution of the equation
 (6)
(6)
where the rational functions  and
and  are
are

From the last two equations of (1) in the steady state, we obtain
 (7)
(7)
with  being the positive solution of the equation
 (8)
(8)
where the rational functions  and
and  are, in terms of the previous solution
 ,
,

In Appendix B we present the analysis of Equations (6) and (8) with respect to the number of solutions: we have up to three positive solutions.
We next present numerical analysis regarded to the non-trivial equilibrium points. Also the system of Equations (1) is solved numerically in order to asses the time delay to occur the exponential growth phase of food allergy in a population.
3. Results and Discussion
The prevalence of antiacid users in 1996-1997 was higher than in 1987-1988 adjusted for age, gender and heartburn, and the proportion of antiacid users increased among those with dyspeptic complaints and also among those reporting no dyspeptic symptoms [24]. In this section we assess the prevalence of food allergy arising among antiacid users. First, we study the steady states; and, then, we determine numerically the dynamical trajectories of Equation (1). Discussions are also provided.
Numerical simulations are performed taking into account the values of the model’s parameters given in Table 2. The threshold of  assumes
 , and the value of
  is
is 
 . The units given in Table 2 are not shown hereafter.
3.1. Results Regarding to the Steady States
Using values given in Table 2, we show the bifurcation diagram in Figure 1: the positive solutions ,
,  and
and  (labelled, respectively, as
 ,
,  and
and ) as a function of
 . These values are positive solutions of Equation (6), which were numerically obtained by the bisection (to find zeros of polynomials) method [25]. For each
 ,
,  and
and , we calculate other coordinates of the equilibrium points
 ,
,  and
and , respectively, using Equation (B.2). The vertical axis begins at –0.1, because the small positive solution
  assumes very lower values. The difference of magnitudes between
  and
and  are of some orders, which requires the use of log-scale (see figure below). In Figure 1 we show the coordinates at which we have two equilibrium points
 ,
, . At
. At  we have
  and
and  collapsing to
  (decreasing values of
 ), and at
  we have
  and
and  collapsing to
  (increasing values of
 ). Considering the values given in Table 2, and by solving Equation (B.1), we have:
  and
and .
.
Figure 1 shows the hysteresis behavior. As α increases,  assumes very lower values (
 ). At
). At , at which we have
 , occurs a sudden jump to upper branch, and
  assumes very higher values (
 ). Conversely, as
  decreases, for higher values of
 ,
,  assumes very higher values (
 ). At
). At  , at which we have
 , occurs a sudden jump to lower branch, and
  assumes very lower values (
 ), reaching zero at
 . Many microorganisms present this kind of behavior, which is called quorum sensing [26].
Numerically it can be shown that the lower ( ) and upper (
 ) branches are stable, while the intermediate branch (
 , defined in the interval
 ) is unstable (see Appendix B). Hence, the unstable equilibrium point
  separates two region of attraction, depending on the initial conditions supplied to the dynamical system (1). Let us suppose that the initial conditions are the values of the coordinates of the equilibrium point
 , specially
 : if
: if , the equilibrium
  is the attractor (regions labelled as II); while for
 , the equilibrium
  is the attractor (regions labelled as III). Disregarding the initial conditions, for
 ,
,  is the attractor, and for
 ,
,  is the attractor. Hence, the dynamics system attains one of the stable equilibrium points
  and
and . Obviously, for
  we have the trivial equilibrium point
  (region labelled
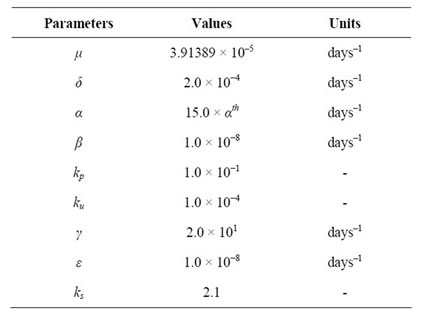
Table 2. Values for model’s parameters. Notice that the life expectancy is μ–1 = 70 years and the threshold value is αth = 2.39139 × 10⁻⁵ days–1.
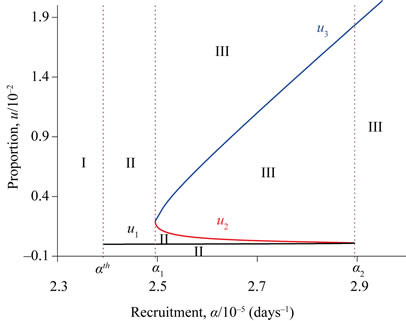
Figure 1. Bifurcation diagram obtained using values given in Table 2. The equilibrium points u1, u2 and u3 are labelled, respectively, as u1, u2 and u3. Considering the critical values α1 and α2, and the threshold αth, which is slightly smaller than α1, the attracting basins are labelled as I (all dynamical trajectories are attracted to the trivial ), II (all dynamical trajectories are attracted to
 ), and III (all trajectories are attracted to
 ). In α1 < α < α2, the unstable equilibrium value
  divides two attracting regions.
I) given by Equation (3), which is unique.
Figure 2 shows, using values given in Table 2, the stability of the equilibrium points ,
,  and
and . According to Routh-Hurwitz criteria for a second degree polynomial, if
  and
and , then the characteristic equation has eigenvalues with negative real part [21]. Figure 2(a) shows that
 , for
, for  and
and , while for
 ,
, . Hence the small (
 ) and big (
 ) positive solutions are stable, while the intermediate root (
 ) is unstable. Notice that we have always
  (Figure 2(b), showing that the stability is given by the term that does not depend on
  [27]). Also, from
  (Figure 2(c)), the eigenvalues corresponding to the matrix
  are real numbers, and dynamical trajectories do not have damped oscillations.
The real valued eigenvalues, due to  and
and , this according to Equation (B.6), state that the trajectories near the equilibrium points are node (if stable,
  or
or ) or saddle (if unstable,
 ) [21].
Table 3 shows the variations of ,
,  ,
,  and
and  by varying the model’s parameters in 10 times. The range where three positive solutions occur increases with increasing in
  and
and , while with decreasing in
  and
and , the range increases. Hence, there are critical values
 ,
,  ,
,  and
and  such that the hysteresis effects disappear (and, consequently, there is a unique positive solution for
 ). At the critical values
 ,
,  ,
,  and
and  we must have
  (and, conesquently,
 ), that is, Equation (B.1) has exactly one solution. However, for
 ,
,  ,
,  and
and , Equation (B.1) does not have positive solution in
 , and hysteresis is absent. Notice that the range of
  at which the hysteresis effects occurs is less sensitive than the jump between
  and
and . For instance, if we use
 , (100 times lower than the value given in Table 2), we have
 ,
,  ,
,  and
and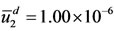 , and the quocients are
  and
and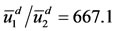 .
.
Figure 3 shows the absence of the hysteresis effect, in which case we have the forward bifurcation (only one stable non-trivial equilibrium point  for
for ). Figure 3(a) shows the forward bifurcation, which was drawn using values given in Table 2, except
 , with
 . Figure 3(b) shows the positive valued
 ,
,  and
and , hence this unique equilibrium point is stable.
Antiacids have been available for many years, and are still commonly used self-prescribed drugs. However, their importance has diminished since the development of histamine-2-receptor antagonists (H2RA) and more recently proton pump inhibitors. Based on the drug wholesale statistics in Norway, the sale of antiacids decreased from 7.6 DDD/1000 inhabitants/day in 1988 to 4.3 DDD/1000 inhabitants/day in 1997. The H2RA and PPI have in the same period increased from 4.0 DDD/ 1000 inhabitants/day (only H2RA) in 1988 to 5.2 and 7.8 DDD/1000 inhabitants/day in 1997, respectively. The unit of measurement in wholesale statistics is usually the Defined Daily Dose (DDD), which is defined as the assumed average maintenance dose per day for a drug use on its main indication in adults [24]. Health surveys may, however, collect information on nonprescription medications and also assess health status, risk factors, and sociodemographic variables at the individual level [16]. In
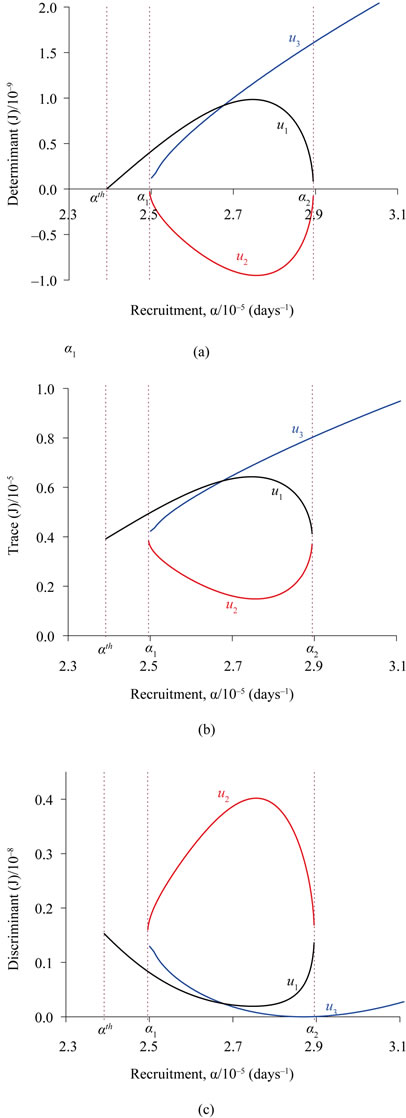
Figure 2. Determinant (a), trace (b) and discriminant (c) of the matrix J1 to assess the stability of the equilibrium values ,
,  and
and  labelled, respectively, as u1, u2 and u3.
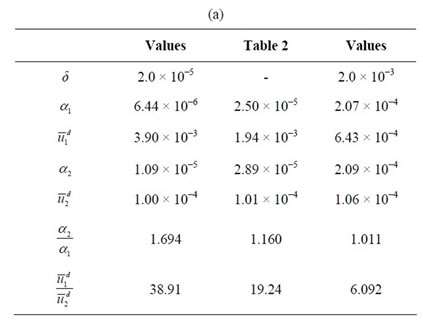
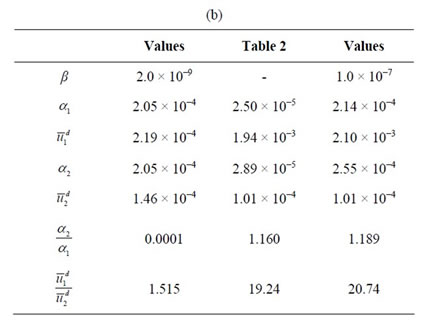
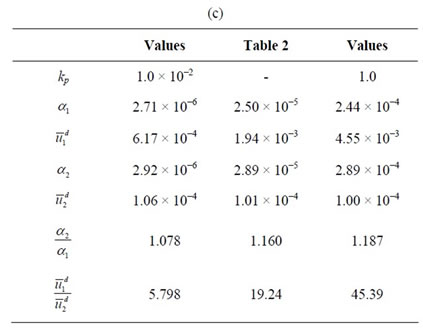
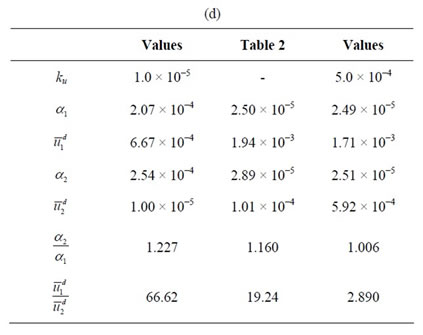
Table 3. Special values  and
and  varying values of the parameters in 10 times lower and higher. In first line we show the changed parameters: δ (a); β (b); kp (c) and ku (d), and horizontal line (-) refers to the value given in Table 2. Units are those given in Table 2. For β = 1.0 × 10⁻⁹ and ku = 1.0 × 10⁻³ the hysteresis effect disappears (there is only one positive solution), which was the reason to use factor 5 in both cases.
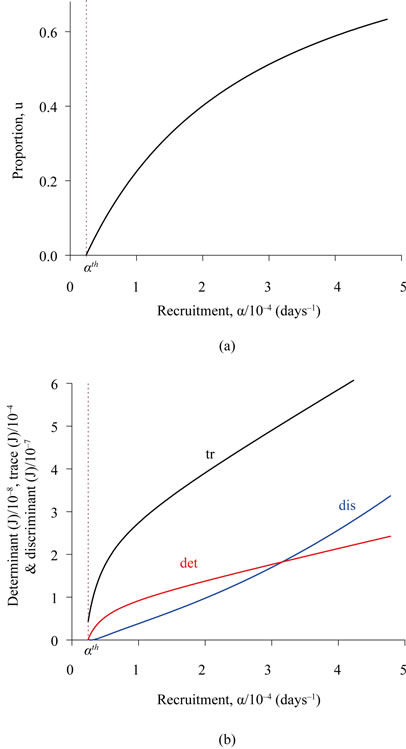
Figure 3. Forward bifurcation diagram (a) obtained using values given in Table 2, except β = 1.0 × 10⁻⁹. Determinant, trace and discriminant of J1 corresponding to the unique  are positive (b).
this way we assessed the hazard of food allergy originating from self-care use of antiacids.
How could nonprescription medications be managed after proving dangerous (in different levels) side effects? Let us drawn the log-scale bifurcation diagram using values given in Table 2, except higher  and lower
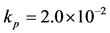 . In Figure 4 the equilibrium points (as a function of
 )
) ,
,  and
and  are labelled, respectively, as
 ,
,  and
and . We also show the critical values
  and
and , and the threshold
 , which are lower than those obtained in Figure 1. The arrows indicate the attracting equilibrium values (stable equilibrium point
 ). The intervals of the recruitment rate
  are:
are:  (I),
(I),  (II),
(II),  (III) and
  (IV). The arrows indicate the attracting equilibrium values (stable equilibrium point
 ). Next we present some scenarios regarding to the control of the use of nonprescription medications. The discussions can be promptly applied to antiacids.
Figure 4 shows an obvious finding: the rate at which naive person becomes nonprescription medications user  is the main control parameter. When the use is spread throughout the community for diversity of reasons, which case corresponds to the case
  (region labelled as IV in Figure 4), the prevalence of users situates at very high level (
 ). Let us suppose that a campaign is carried on in order to avoid self-care use of medications, which decreases the recruitment of users (
 decreases). First, if this rate of the recruitment is still elevated (
 , region IV), a decreasing in the amount of users due to health campaign is temporary, and as time goes on, the previous prevalence is attained. In other words, a complete rejection of medications is only possible with the abandonment of medications by all users (
 ). Second, when the recruitment is lowered substantially (
 , region III), if the educational campaign reduces the users below the critical proportion (
 ), then, as time goes on, the prevalence is decreased dramatically reaching low value
  (order of
 ). Third, if adherence to campaign is elevated, (
 , region II), the prevalence situates at low value
 . Notice an abrupt jump down of users at
 . Finally, in the region I (
 ), a perfect campaign reduced the recruitment rate below its threshold, and as time goes on, all individuals abandon the use of medications.
With respect to the nonprescription antiacids, which can induce food allergy, public health authorities must design a campaign that reduces the recruitment rate below , without the necessity of reaching all persons (
 ). If this goal is unreachable, a campaign must reduce the recruitment rate below
 , and additional efforts must be spent to reduce the antiacid users below the critical value (
 , coordinate of the stable equilibrium
 ). The reason is due to the fact that the preva-

Figure 4. Log-scale bifurcation diagram using values given in Table 2, except β = 5.0 × 10⁻⁸ and kp = 2.0 × 10⁻². The equilibrium points ,
,  and
and  are labelled, respecttively, as u1, u2 and u3 The arrows indicate the attracting equilibrium values (stable
 ). The intervals of the recruitment rate α considering the critical values α1 and α2, and the threshold αth are: α < αth (I), αth < α < α1 (II), α1 < α < α2 (III) and α > α2 (IV).
lence  (coordinate of the stable equilibrium
 ) is so low that avoids the appearance of food allergic persons.
3.2. Dynamical Trajectories
Steady states analysis furnished qualitative behavior of the system of Equations (1). Numerical solutions of this system of ordinary differential equations were obtained by the 4th order Runge-Kutta method [25]. In appropriate ranges of values of the model’s parameters, we can observe the hysteresis behavior. Now let us determine the period of time spent in order to appear cases of cassava allergic persons in a measurable prevalence.
The system of Equation (1) is divided into two subsystems: the first two equations describing the recruitment of persons to become antiacid users, and the last two equations, which is feed by the first sub-system, describing the onset of food allergy among antiacid users. The parameters regarded to the first sub-system determine the qualitative behavior of the dynamical system: ,
,  ,
,  ,
,  and
and . The remaining parameters
 ,
,  and
and  can be managed to assess the food allergy manifestation in a community. Both sub-systems are coupled by the parameters
  and
and .
.
The following numerical results are obtained changing the values of the parameters  and
and  given in Table 2:
  and
and . These values are those used to draw the bifurcation diagram given in Figure 4. The threshold value becomes
 , and hence
 . In this case, we have
 ,
,  ,
,  and
and , and the quocients are
  and
and .
.
Let us assume that  persons were convinced by pharmaceutical industries to use antiacid when it was released. If we assume a total population of
  persons, like Brazil, the initial conditions, given by Equation (2), supplied to the dynamical system (1) are
 ,
,  , and
, and  . The latter initial conditions describe, due to the absence of PPIs, the absence of sensitized persons neither persons who acquired food allergy. Figure 5 shows the dynamical trajectories: long-term Figure 5(a) and short-term Figure 5(b). The year 0 in the simulations can be linked to the year 1988, when PPIs were introduced. Fifteen years later since the introduction of antiacid in a community, we have 8 cases of food allergy in a population of 200 million persons, and asymptotically attains 92 cases per 1 million persons (equilibrium value
 ). With respect to sensitized persons, we find 48,000 cases after fifteen years in a population of 200 million persons, and asymptotically attains 1200 cases per 1 million persons (equilibrium value
 ).
).
If we increase the initial conditions to  and
and , 8 cases of food allergy in a population of 200 million persons are observed after elapsing 14.57 and 14.52 years, respectively. For decreased initial condition
 , 8 cases of food allergy in a population of 200 million persons are observed after elapsing 16.4 years. The asymptotic (equilibrium) proportions of the naive persons
  and PPIs users
  are near, respectively, 0.8 and 0.2 (Figure 5(a)). The value assigned to
  is much higher than
 , hence we have only one equilibrium point
 . In this case, the initial conditions only affect the delay in the time of arising of the exponential growth, and further achievement of asymptotic equilibrium.
Now, let us illustrate the dependency of the dynamical system with the initial conditions, letting to  a value situated between
  and
and , that is,
 . At this value, we have
 ,
,  and
and . The initial conditions supplied to the system (1) are given by Equation (2). For the initial condition
  (Figure 6(a)), dynamical trajectories are attracted to the equilibrium point
 , with coordinates obtained using
 , according to Equation (B.2). However, for
  (Figure 6(b)), dynamical trajectories are attracted to the equilibrium point
 , with coordinates obtained using
 . The unstable equilibrium point
  is called break point [28]. Notice that both
  are lower than
 ; because we used
  instead of
  and
and  .
.
All preceding results were obtained assuming that the values of the model’s parameters are fixed, that is, they

Figure 5. Long-term (a) and short-term (b) dynamical trajectories using values given in Table 2, except β = 5.0 × 10⁻⁸ and kp = 2.0 × 10⁻².
do not vary with time. The autonomous dynamic system presented a threshold  in the bifurcation diagram, besides the hysteresis behavior. The threshold
  appeared due to the mass action law approximation for small number of antiacid users (
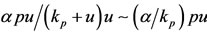 in the dynamics system) [27]. The hysteresis reports a social behavior in which a critical number of persons (in our example, the use of antiacids) is needed to trigger an intense collective response.
4. Conclusions
We developed a simple phenomenological model to describe the appearance of food allergy (cassava allergen) in persons who are users of antiacids. Our argument was that the increasing use of proton pump inhibitors for digestive disorders resulted in the elevation of the pH, and, consequently, the cassava allergen remains intact, thereby
Figure 6. Dependence of the dynamical trajectories with the initial conditions using values given in Table 2, except α = 8.0 × 10⁻⁶, β = 5.0 × 10⁻⁸ and kp = 2.0 × 10⁻². For u (0) = u0 = 2.8794 × 10⁻⁴ dynamical trajectories are attracted to  (a), while for u0 = 2.8795 × 10⁻⁴, to
  (b).
(b).
facilitating its presentation to the immune system. Additionally, only part of it uses the drug indiscriminately and irregularly, and that only part of the population is genetically predisposed to be sensitized and acquire food allergy. We expect however an elapse in the time from the introduction of antiacids (specially PPIs) until the sensitization to a new allergen, the onset of symptoms and diagnosis of food allergy.
The model considered Hill function to describe the following events: 1) the recruitment of naive persons to become antiacid users ( ); 2) the sensitization of the immune system among antiacid users to the cassava allergen remained intact due to the elevation of pH (
 ); and 3) the onset of symptoms of food allergy (
 ). The reason behind the choice of Hill type function was basically of three types: 1) non-prescription medicines (like antiacids) usage can be thought of social behavior (collective response depends on a critical number of adhered persons); 2) the sensitization is strongly dependent on a threshold in the amount of food allergens; and 3) the acquisition of allergy is an event depending on many factors, such as genetic predisposition, modern life style including social behavior and food intake, and stress.
Due to the mass action law, there was a threshold of the recruitment rate  below which the antiacid users cannot be maintained. The use of Hill function to describe the flow between different status of persons in a community arose the hysteresis behavior, which appears when
 ,
,  ,
,  and
and . Hysteresis effects consisted in the appearance of three equilibrium points
 ,
,  and
and  in the interval
  in such way that, as
  increases, small positive solution
  (coordinate of
 ) jumped suddenly at
  to big positive solution
  (coordinate of
 ). The positive solutions
  and
and  assume very small values, while
  does not. Dynamically, the trajectories are attracted either
  or
or  depending on the initial conditions supplied to the dynamical system (Figure 6). When the recruitment rate situates between
  and
and , or
, or , if the initial amount of antiacid users (u0) does not achieve a critical value (regarded to the coordinates of the unstable
 ), this community is relatively safe from onset of allergic reactions in persons. However, the figure is completely different if u0 surpasses the critical value: the number of antiacid users increases around 345 times for
  (Figure 6). In the situation as reported by Figure 6 (low value of recruitment rate), the pharmaceutical industry must spent a lot of money to convince people to use antiacids. If this goal is successful, then the possibility of appearing food allergy is increased dramatically.
Population-based information showed that the consumption of antiacids, which are nonprescription drugs, mainly is explained by the prevalence of dyspeptic symptoms. Nonprescription antiacid medication, in conjunction with the report of some degree of relief in the treatment of acid-related disorders by users, can increase the recruitment rate . A larger number of medical visits in the year 1987-1988 predicted an increased likelyhood of being an antiacid user, and this findings persisted throughout the period [16]. When
  increases and surpasses the critical value
 , that is,
  , the dynamical trajectories are driven to the big equilibrium
 , regardless the initial conditions supplied to the dynamical system. Therefore, food allergy originated from cassava allergen can be detectable if the recruitment rate
  is situated above the critical value
 , rather than the threshold
  (Figure 5).
From the dynamical trajectories of the model (Figure 5), we conclude that detectable number of patients should be arose 15 years after the introduction of antiacids, which was in 1988. Hence, in the year 2003 first cases of food allergy from antiacid users should be diagnosed. After 23 years, in the calendar year of 2011, we can estimate the incidence of sensitized and food allergic persons in 3500 and 2 cases per 10 million persons, respectively. These estimates were obtained using the values given in Table 2, except  and
and . Other sets of values can be provided to the model’s parameters in order to estimate different outcomes. However, there are a complete lack of reliable estimatives in a population level to be compared with the model’s prediction. The food allergy may become a public health problem, if PPIs are being used indiscriminately and irregularly. The results obtained from the analysis of the model suggest that the use of nonprescription antiacids, like PPIs, may be recommended or approved by the physician in order to avoid the rising of food allergy.
Finally, as new biological findings occur, improved mathematical model can be developed and fitted against observed data. Notwithstanding, the simple model we developed and analyzed here showed an elapse of 15 years from the introduction of antiacid medicine before the onset of food allergic persons, and the model is forecasting an exponential growth in the number of food allergic persons currently.
5. Acknowledgements
This work was supported by a grant from FAPESP (Projeto Temático, 09/15098-0). HMY gratefully acknowledges a Fellowship awarded by CNPq.
REFERENCES
- R. Chiron, “Anaphylactic Reaction to Tapioca,” Journal of Allergy and Clinical Immunology, Vol. 107, No. 2, 2001, pp. S270-S271.
- C. E. S. Galvão, L. K. Iwai, M. E. B. Andrade, J. Kalil and F. F. M. Castro, “Latex Allergy and Cross-Reactivity to Manioc: Report of 2 Cases,” Journal of Allergy and Clinical Immunology, Vol. 113, No. 2, 2004, pp. 144.
- A. Gaspar, C. Neto-Braga, G. Pires, R. Murta, M. Morais-Almeida and J. Rosado-Pinto, “Anaphylactic Reaction to Manioc: Cross-Reactivity to Latex,” Allergy, Vol. 58, No. 7, 2003, pp. 683-684. doi:10.1034/j.1398-9995.2003.00184.x
- M. Ibero, M. J. Castillo and F. Pineda, “Allergy to Cassava: A New Allergenic Food with Cross-Reactivity to Latex,” Journal of Investigational Allergology and Clinical Immunology, Vol. 17, No. 6, 2007, pp. 409-412.
- K. Ishizaka, T. Ishizaka and M. M. Hornbrook, “Physico-Chemical Properties of Human Reaginic Antibody. IV. Presence of a Unique Immunoglobulin as a Carrier of Reaginic Activity,” Journal of Immunology, Vol. 97, No. 1, 1966, pp. 75-85.
- K. S. Santos, C. E. Galvão, V. M. F. Resende, C. O. Martins, E. Vejvar, G. Gadermaier, F. Ferreira, J. Kalil and F. F. M. Castro, “Identification of New Brazilian Allergens from Manioc Manihot esculenta,” Abstract Book of Food Allergy and Anaphylaxis Meeting, Venice, 2011.
- I. Pali-Scholl and E. Jensen-Jarolim, “Anti-Acid Medication as a Risk Factor for Food Allergy,” Allergy, Vol. 66, No. 4, 2011, pp. 469-477. doi:10.1111/j.1398-9995.2010.02511.x
- K. S. Santos, C. D. Galvao, G. Gadermaier, V. M. F. Resende, C. O. Martins, D. S. Misumi, A. C. Yang, F. Ferreira, M. S. Palma, J. Kalil and F. F. M. Castro, “Allergic Reactions to Manioc (Manihot esculenta Crantz): Identification of Novel Allergens with Potential Involvement in Latex-Fruit Syndrome,” Journal of Allergy and Clinical Immunology, Vol. 128, No. 6, 2011, pp. 1367- 1369. doi:10.1016/j.jaci.2011.07.019
- V. N. Uversky, J. R. Gillespie and A. L. Fink, “Why Are ‘Natively Unfolded’ Proteins Unstructured under Physiologic Conditions?” Proteins: Structure, Function, and Genetics, Vol. 41, No. 3, 2000, pp. 415-427. doi:10.1002/1097-0134(20001115)41:3<415::AID-PROT130>3.0.CO;2-7
- J. M. Mullin, M. C. Valenzano, M. Whitby, D. Lurie, J. D. Schmidt, V. Jain, O. Tully, K. Kearney, D. Lazowick, G. Mercogliano and J. J. Thornton, “Esomeprazole Induces Upper Gastrointestinal Tract Transmucosal Permeability Increase,” Alimentary Pharmacology & Therapeutics, Vol. 28, No. 11-12, 2008, pp. 1317-1325. doi:10.1111/j.1365-2036.2008.03824.x
- L. J. Murray, M. Gabello, D. S. Rudolph, C. P. Farrell, M. Morgan, A. P. Martin, J. C. Underwood, M. C. Valenzano and J. M. Mullin, “Transmucosal Gastric Leak Induced by Proton Pump Inhibitors,” Digestive Diseases and Sciences, Vol. 54, No. 7, 2009, pp. 1408-1417. doi:10.1007/s10620-008-0528-z
- C. K. Ching and S. K. Lam, “Antiacids. Indications and Limitations,” Drugs, Vol. 47, No. 2, 1994, pp. 305-317. doi:10.2165/00003495-199447020-00006
- F. Halter, “Clinical Use of Antiacids,” Journal of Physiology and Pharmacology, Vol. 44, No. 3, 1993, pp. 61- 74.
- J. G. Penston and R. E. Pounder, “A Survey of Dyspepsia in Great Britain,” Alimentary Pharmacology & Therapeutics, Vol. 10, 1996, pp. 8-9.
- A. P. Corder, R. H. Jones, G. H. M. Sadler, P. Daniels and C. D. Johnson, “Heartburn, Oesophagitis and Barrett’s Oesophagus in Self-Medicating Patients in General Practice,” British Journal of Clinical Practice, Vol. 50, No. 5, 1996, pp. 245-248.
- K. Furu and B. Straume, “Use of Antiacids in a General Population: The Impact of Health-Related Variables, Lifestyle and Sociodemographic Characteristics,” Journal of Clinical Epidemiology, Vol. 52, No. 6, 1999, pp. 509- 516. doi:10.1016/S0895-4356(99)00020-7
- J. Isolauri and P. Laippala, “Prevalence of Symptoms Suggestive of Gastrooesophageal Reflux Disease in an Adult Population,” Annals of Medicine, Vol. 27, No. 1, 1995, pp. 67-70. doi:10.3109/07853899509031939
- N. F. Adkinson, J. W. Yunginger, W. W. Busse, B. S. Bocher, S. T. Holgate and F. E. R. Simons, “Middleton’s Allergy: Principles & Practice,” Mosby Inc., Philadelphia, 2003. doi:10.1016/j.jtbi.2010.10.013
- F. Grob, G. Metzner and U. Behn, “Mathematical Modeling of Allergy and Specific Immunotherapy: Th1-Th2- Treg Interactions,” Journal of Theoretical Biology, Vol. 269, No. 1, 2011, pp. 70-78.
- H. M. Yang, “Mathematical Modeling of Solid Cancer Growth with Angiogenesis,” Theoretical Biology and Medical Modelling, Vol. 9, No. 2, 2012.
- J. D. Murray, “Mathematical Biology,” Spinger-Verlag, New York, 1989.
- C. B. Madsen, S. Hattersley, J. Buck, S. M. Gendel, G. F. Houben, J. O. B. Hourihane, A. Mackie, E. N. C. Mills, P. Nørhede, S. L. Taylor and R. W. R. Crevel, “Approaches to Risk Assessment in Food Allergy: Report from a Workshop Developing a Framework for Assessing the Risk from Allergenic Foods,” Food and Chemical Toxicology, Vol. 47, No. 2, 2009, pp. 48-89. doi:10.1016/j.fct.2008.12.001
- A. V. Hill, “The Possible Effects of The Aggregation of The Molecules of Haemoglobin on its Dissociation Curves,” The Journal of Physiology, Vol. 40, 1910, pp. 4-7.
- K. Furu and B. Straume, “Changes in Antiacid Use over a 9-Year Period in a General Population Adjusted for Changes in Dyspeptic Complaints,” Norsk Epidemiologi, Vol. 18, No. 2, 2008, pp. 201-207.
- W. H. Press, B. P. Flannery, S. A. Teukolsky and W. T. Vetterling, “Numerical Recipes. The Arts of Scientifc Computing (FORTRAN Version),” Cambridge University Press, Cambridge, 1989.
- D. Karlsson, S. Karlsson, E. Gustafsson, B. H. Normarkc and P. Nilsson, “Modeling The Regulation of The Competence-Evoking Quorum Sensing Network in Streptococcus pneumoniae,” BioSystems, Vol. 90, No. 1, 2007, pp. 21-23. doi:10.1016/j.biosystems.2006.08.005
- M. B. F. Leite, R. C. Bassanezi and H. M. Yang, “The Basic Reproduction Ratio for a Model of Directly Transmitted Infections Considering the Virus Charge and the Immunological Response,” IMA Journal of Mathematics Applied in Medicine and Biology, Vol. 17, No. 1, 2000, pp. 15-31. doi:10.1093/imammb/17.1.15
- L. Esteva and H. M. Yang, “Mathematical Model to Assess the Control of Aedes aegypti Mosquitoes by The Sterile Insect Technique,” Mathematical Biosciences, Vol. 198, No. 2, 2005, pp. 132-147. doi:10.1016/j.mbs.2005.06.004
- G. H. Golub and C. F. van Loan, “Matrix Computations,” The Johns Hopkins University Press, Baltimore, 1996.
- J. K. Hale, “Ordinary Differential Equations,” John Wiley and Sons, New York, 1969.
Appendix A. Hill Function
Let us consider the Hill function [23] of order n, written as

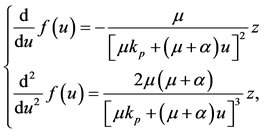
The first derivative of the Hill function is 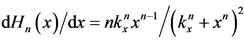 , and the second derivative is
  for
for , and
, and

for . Notice that for
 , the first derivative is always positive, and
  is strictly increasing function from
  to
to .
.
The first order Hill function (n = 1) is increasing function without change of concavity. However, for , the increasing n-th order Hill function changes the concavity at
 , that is,
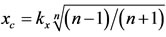 , and the value of
  at
at 
is . For
. For , the concavity is upward (
 ); conversely, downward for
 . Clearly, the inflexion point
  exists only for
 .
.
The coordinates of the inflexion point for  is
is , while for
 , we have
 . Notice that, as n increases,
  and
and  increase, the first from
  to a, while the latter from 1/4 to 1/2.
Figure A1 illustrates the Hill function for , 2 and 3, letting an arbitrary value
 . At
. At , we have
 , for all n. Notice that, for
 , if
, if , we have
 , while for
 ,
, .
.
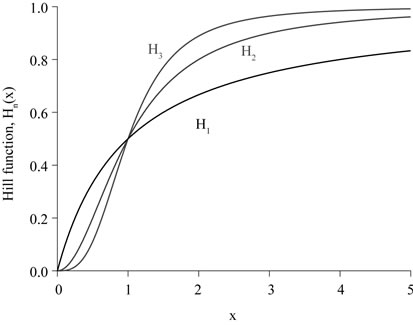
Figure A1. Hill function for the first three degrees, with Hn (Kx) = 0.5 at x = Kx = 1.
Appendix B. Analysis of the Model We deal with the steady states of the system (1), and we assess the stability of the equilibrium points.
1.1. Steady States
The trivial equilibrium point  is given by Equation (3). The non-trivial equilibrium point
  has the coordinates given by: Equation (5) for
 , solution (s) of Equation (6) for
 , solution of Equation (8) for
 , and Equation (7) for
 . Hence, let us analyze Equations (6) and (8).
From Equation (6), the function  is such that
 ,
,
 ,
,  at
at
 , and
, and
where . If
. If , we have
 , where
  is given by Equation (4). However, for
 ,
,  is a strictly decreasing function with upward concavity, and assumes positive values in the interval
 . Summarizing,
  is strictly decreasing for
  and
and  .
.
The function  is such that
 ,
,  , and
, and

Hence,  for
for , and has a maximum at
  (
( increases for
 , and decreases for
 ), and changes the concavity at
  (downward concavity for
 , and upward concavity for
 ).
).
By comparing the behaviors of the functions  and
and , we conclude that a positive solution always exists for
 , that is,
 . This inequality is just the condition for the trivial equilibrium becoming unstable. Notice that
  is a function of
 , while
  is a function of
 . Let us fix the value of
 , and vary
 . Let us define two values
  and
and  (see below), with
 , and analyze the equation
 . For small values of α, but greater than the threshold
 , that is,
  , Equation (6) has only one positive solution, such that
 . As α increases (
 ), Equation (6) has three positive solutions such that
 ,
,  and
and . Finally, for sufficiently higher values of
  (
( ), Equation (6) has again a unique positive solution, such that
 . We stress the fact that
  is always a solution whatever be the value of
 . Similar behavior occurs when we fix
  and vary
 .
.
The passage from one solution to three positive solutions, or vice-versa, as  varies, occurs at values of
  at which Equation (6) has two positive solutions. Two positive solutions occur when there exists the collapse of pre-existing two solutions in one, that is, the curve of the function
  is tangent (intercepts in one point) with the curve of the function
 . The other positive solution always exists. This behavior occurs at two values of
 , named
  and
and , with
 . At these values we must have
  and
and , or the algebraic equations
 (B.1)
(B.1)
are satisfied, where the first equation resulted by isolateing  from Equation (6). Hence,
  and
and  (and corresponding
  and
and ) are solutions of the second equation substituting
  from the first equation. From the behaviors of the functions
  and
and , we can estimate both solutions:
 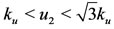 and
and . In the case of three positive solutions, we have the hysteresis behavior [21]. Notice that when
 , or when Equation (B.1) does not have solutions, we have exactly one equilibrium value
  for
for .
.
With respect to Equation (8), the function  is strictly decreasing linear function, which intercepts horizontal axis,
  , at
, at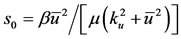 .
.
The function  is such that
 ,
,  , and
, and
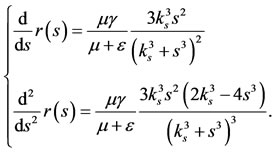
Hence,  is strictly increasing function, and changes the concavity at
  (upward concavity for
 , and downward concavity for
 ). By comparing the behaviors of the functions
  and
and , we conclude that the equation
  has only one positive solution
 , with
 , for a given positive value of
 .
.
Notice that, if we consider Hill function of any order for the populational acquisition of the food allergy, that is,  in the last equation of the system (1), a similar conclusion with respect to unicity of the solution can be made. For instance, for
 , the equilibrium
  is the positive solution of

instead of Equation (8). This second order polynomial has one positive solution (other is negative). The qualitative dynamics of the system also does not change. Hence, due to the less sensitive changes in the dynamics promoted by any order of the Hill function, we can revise the model's assumption about the less frequent occurrence of allergic reaction in sensitized persons, if necessary.
Summarizing, the non-trivial equilibrium point  always exists for
 , and is given by
 (B.2)
(B.2)
where  and
and  are the positive solutions of, respectively, Equations (6) and (8). We recall that the expressions for
  and
and  are given by Equations (5) and (7), respectively. When there are three equilibrium points, for each
 ,
,  and
and , we calculate other coordinates and we have three equilibrium points
 ,
,  and
and .
.
1.2. Stability Analysis
The local stability of the equilibrium points is determined by the eigenvalues of the characteristic equation , where the matrix
 , the Jacobian
  evaluated at the equilibrium point, is

where 0 is the  null matrix, the diagonal matrices are
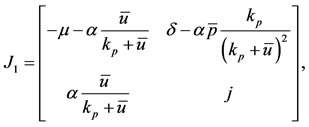
where
 and
and

and the off-diagonal matrix is
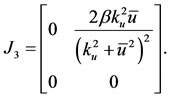
The eigenvalues corresponding to  are the sum of the eigenvalues of the matrices
  and
and  [29].
[29].
The characteristic equation corresponding to  is
is
 , (B.3)
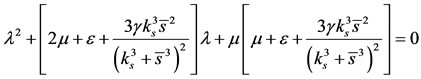
which has positive coefficients. The characteristic equation corresponding to  is written as
 (B.4)
(B.4)
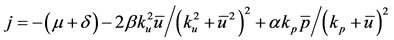
where  and
and  are the trace and determinant of the matrix
  given by
 (B.5)
(B.5)
We can also evaluate the discriminant of the matrix ,
, . If
. If , the eigenvalues are real. Notice that
 (B.6)
(B.6)
and the eigenvalues corresponding to the matrix  are negative real numbers.
According to Routh-Hurwitz criteria for a second degree polynomial, if all coefficients are positive, then the characteristic equation has eigenvalues with negative real part [21]. Hence, the characteristic Equation (B.3) has two eigenvalues with negative real part, leaving the stability being determined by the characteristic Equation (B.4). The last term of the trace of ,
,  , was obtained substituting the equilibrium value of
  given by Equation (5) in
 . Taking into account this term, when
  (and, consequently,
 ), the coefficients of the characteristic Equation (B.4) are positive, and both eigenvalues have negative real part. Therefore, the non-trivial equilibrium point
  with elevate number of antiacid users is locally asymptotically stable. In other cases, the stability is determined numerically.
In the case of the trivial equilibrium point , which has
  and
and , the eigenvalues of the characteristic Equation (B.4) are
  and
and . Hence, the trivial equilibrium point is locally asymptotically stable for
 ; otherwise, unstable. The bifurcation occurs from trivial to non-trivial equilibrium at
 .
.
If the recruitment of the naive persons is lower than the threshold ( ), the trivial equilibrium point is an attractor disregarding the initial conditions. To prove that the absence of antiacid users is globally stable for
 , let us define Lyapunov function
  as
as
The orbital derivative is

Notice that if , we have
 ; also, being
 , we have
 . Hence, the orbital derivative
  is lower than or equal to zero for
 . By inspecting the system of Equation (1), it can be seen that the maximal invariant set contained in
  is the trivial equilibrium point. Then, from La-Salle Lyapunov Theorem [30], the equilibrium point
  corresponding to the absence of antiacid users is globally asymptotically stable for
 .
.
NOTES
*Corresponding author.