Advances in Bioscience and Biotechnology
Vol.5 No.3(2014), Article ID:43383,9 pages DOI:10.4236/abb.2014.53034
Inheritance of AFLP markers and genetic linkage analysis in two full-sib families of the marine shrimp Litopenaeus vannamei (Crustacea, Decapoda)
1Departamento de Genética e Evolução, Universidade Federal de São Carlos, São Carlos, Brasil
2Embrapa Pecuária Sudeste, São Carlos, SP, Brasil
3Departamento de Biologia Geral, Universidade Federal de Viçosa, Viçosa, Brasil
4Genearch Aquacultura Ltda, Rua Pedro Zuca s/n, Praia de Pititinga, Rio do Fogo, RN, Brasil
Email: *mmantovanig@hotmail.com
Copyright © 2014 Michele Mantovani Gonçalves et al. This is an open access article distributed under the Creative Commons Attribution License, which permits unrestricted use, distribution, and reproduction in any medium, provided the original work is properly cited. In accordance of the Creative Commons Attribution License all Copyrights © 2014 are reserved for SCIRP and the owner of the intellectual property Michele Mantovani Gonçalves et al. All Copyright © 2014 are guarded by law and by SCIRP as a guardian.
Received 13 November 2013; revised 17 January 2014; accepted 25 February 2014
KEYWORDS:Shrimp; Litopenaeus vannamei; AFLP; Genetic Linkage Groups
ABSTRACT
The cultivation of the marine species of shrimp Litopenaeus vannamei has emerged as one of the segments that best develop in the Brazilian aquaculture, representing the agribusiness that grew the most in recent years. Regarding the economic importance of the farming of this species in Brazil, further studies on genetic improvement were conducted. A F2 segregating population consisting of 192 samples for each G1 and G2 families, from crossing inbred lines was used for the studies performed in the present work. The genetic linkage analysis was based on polymorphic markers derived from nine AFLP (Amplified Fragment Length Polymorphism) primers. Fourteen genetic linkage groups including 103 segregating polymorphic markers were constructed covering 350 cM for G1 and four genetic linkage groups including 59 markers were constructed covering 300 cM for G2. Simple marker analyses were performed among individuals evaluated phenotypically, finding markers linked to genes that may be potentially important and useful to assess characteristics of economic importance for traits related to weight and the disease IMN (idiopathic muscle necrosis). The statistical model including markers explained major proportion of phenotypic characteristic weight in relation to disease incidence IMN.
1. INTRODUCTION
Litopenaeus vannamei is an important marine shrimp species cultivated in aquaculture systems in Brazil and throughout the world. It is native to the Pacific Ocean, where its natural distribution ranges from the Sonora Province in Mexico to the south of Tumbes, in Peru [1]. Many countries have been cultivating this species due to its excellent adaptability to adverse rearing conditions, ease of nutritional and reproductive management, and high profitability and productivity rates [2]. Genetics applied to aquaculture has been claimed as a powerful tool to improve production and disease resistance [3].
In shrimp, many efforts have been made towards the construction of genetic linkage maps in a few commercially exploited species, such as Penaeus (Marsupenaeus) japonicus [4,5], Penaeus monodon [7,8], Penaeus (Fenneropenaeus) chinensis [8] and L. vannamei [9-11]. Such studies have for the most part relied on the use of dominant AFLP (Amplified Fragment Length Polymorphism) markers, but also microsatellites in a few cases.
The mapping of genes that control economically important features has been proven to be efficient for genetic studies in diverse aquatic organisms. Before, early works with the association of loci with QTLs (Quantitative Trait Locus) showed that these markers could be mapped with some precision, which maybe allow the characterization of causal mutation, since the population was unbalanced with a sufficient number of markers [12].
The fluorescence amplified fragment length polymorphism (fAFLP) assay is based on the amplification of restriction fragments from genomic DNA and the analysis of the amplified products using polyacrylamide gel electrophoresis, differing from conventional AFLP only by the use of primers labeled with a fluorochrome instead of the radioactive phosphorus [γ32 P] used in the standard method. Conventional AFLP is particularly useful for genomic mapping and genetic fingerprinting and may be used to calculate genetic distances between individual members of a population [13,14]. AFLP has successfully been used in the identification of loci linked to important quantitative traits in penaeid marine shrimps [8]. They do not require a previous knowledge of the genome of the studied organism, and produce a large number of polymorphic loci with highly reproducible band patterns, and high pairing specificity between the used primers and the complementary adaptor nucleotides, which correspond to the original positions in the genome of the species and, consequently, may be explored as marks in the physical and/or genetic map [13].
The aim of the present study was to determine the inheritance of the AFLP markers in two reference families of full-sibs (G1 and G2) and analyses of association were developed to identify marks linked to genes that control traits of economic importance for the L. vannamei.
2. MATERIAL AND METHODS
2.1. Production of Families
Two full-sib families of L. vannamei were produced in 2004 at the Genetics Center of the private company Aquatec (Barra do Cunhaú, RN, Brazil). The company is the leading commercial hatchery in Brazil with its own genetic improvement program since 1998. These were F2 families from parental F0 crosses among Panama (P), Venezuela (V) and Ecuador (E) shrimp lineages which had been imported by Aquatec from these countries in the years of 1997 and 1998 and kept separated as distinct lineages since then. Previous genetic diversity studies conducted by Rocha et al. [15], based on microsatellites, had shown these lineages to exhibit a considerable level of genetic differentiation among them, making them, therefore, ideal for the construction of an F2 population. F1 full-sib families of composition P x V and P x E had been obtained previously by artificial insemination, and in order to obtain the F2 families, two different F1 families P x V were intercrossed to produce the F2 family G1 (P x V), and two different F1 families P x E were intercrossed to produce the F2 family G2 (P x E).
The Panama lineage was imported in 1997 and was originated from breeding wild shrimp. At the time of the breeding for obtaining the F2 segregating population, this lineage was in generation F7 and presented a great adaptation to the pond rearing conditions in Brazil, being very robust to bacterial and viral diseases. The Venezuela lineage was also imported in 1997 and at the time of breeding was in generation F22. It was originated from breeding shrimp that were in generation F15 at the time of the importation from Venezuela. The animals of this lineage were characterized by good growth attributes, and females presented an excellent reproductive performance, with no need for ablation. Nevertheless, this lineage was considered less resistant to diseases. The Ecuador lineage was set up in 1998 and at the time of breeding was in generation F8. It was originated from nauplii and wild PLs (shrimp larvae) imported from Ecuador. This lineage was the less adapted to the pond rearing conditions in Brazil, presenting slow growth attributes.
The F2 shrimp were kept in growth family tanks for three months. Approximately 1 g of tail muscle tissue was then collected from each individual shrimp, fixated in 2 ml tubes containing absolute ethanol, frozen and conserved at a temperature of −20˚C. Muscle samples were also collected from the parental animals (F1) and conserved.
2.2. Phenotypic Evaluation
Two phenotypic characteristics were evaluated. The fresh total body weight and the incidence of clinical signs of the IMN (idiopathic muscle necrosis) disease. The assessment for the disease was performed before the harvesting of the shrimp, where each sample was observed by naked eye regarding the existence of deformities on its muscular tissue (occurrence of IMN). For fresh weight evaluation, each individual free of excess of water was immediately weighed after its removal from inside the tanks.
2.3. DNA Extraction and AFLP Analysis
Total genomic DNA was extracted following Aljanabi and Martinez [16]. Muscle tissues (approximately 50 mg) from the F1 parents (male and female) of each family and from 192 individuals from the segregating F2 population of each family were used in the DNA preparations. DNA integrity was analyzed through electrophoresis in a 0.8% agarose gel immersed in 1x TEB running buffer (89 mM Tris; 89 mM boric acid; and 2.5 mM EDTA; pH 8.3). The DNA concentration of each sample was assessed through spectrophotometry with UV light using the relation 1 O.D. = 50 ng/μL in TE buffer (10 mM TRIS-HCL; pH 8.0; 0.1 mM EDTA) and subsequently conserved at −20˚C.
A total of 192 samples from each of the two families were amplified via PCR using EcoRI/MseI nine primer combinations (Table 1—nomenclature described by Kocher et al. [17]. The fAFLP reactions were performed using the Applied Biosystems AFLP Plant Mapping Protocol Kit [18], originally derived from Vos et al. [13]. The genomic DNA (50 ng/µL) was digested with EcoRI and MseI before ligation of adaptors. Pre-selective amplification was carried out using adaptor-specific primers with a single selective base on each primer, with nine sets (Table 1) of site-specific MseI and EcoRI primers being used for the selective amplification reaction.
The PCR condition of the pre-selective amplification: 4 µL was taken from the diluted reaction prepared based on the adaptor digestion and ligation reactions and enriched with 1 µL of the mixture of the pre-selective AFLP primers EcoRI and MseI and 15 µL AFLP Core mix. The samples were placed in an thermocycler (Eppendorf Mastercycler gradient®) initially programmed for two minutes at 72˚C, 20 cycles at 94˚C for 20 seconds, 56˚C for 30 seconds and at 72˚C for two minutes, and finalizing at 60˚C for 30 minutes. Selective Amplification: 1.5 µL was taken from the diluted preselective reaction and 7.5 µL AFLP Core mix, 0.5 µL primer-AXX of the fluorescence-tagged EcoRI and 0.5 µL MseI primer-CXX was added. After preparing the reactions, the samples were placed in a thermocycler (Mastercycler Gradiente®, Eppendorf). The amplification started with an initial denaturing phase at 94˚C for two minutes, followed by 10 cycles at 94˚C for 20 seconds, then at 66˚C (reducing one degree per cycle) for 30 seconds and at 72˚C for 2 minutes, 21 cycles at 94˚C for 20 seconds, 56˚C for 30 seconds, 72˚C for two minutes, and a final phase at 60˚C for 30 minutes.
Each sample labeled with FAM dye was run in an ABI Prism 3100 Avant DNA analyzer (Applied Biosystems). The data obtained from each run were analyzed using the GENESCAN program version 3.1 (Applied Biosystems). The GENOTYPER program version 3.11 (Applied Biosystems) was used to verify the presence (1) or absence (0) of polymorphic loci in the electropherograms from the F2 populations based on the previously identified parent loci (1 and 2), producing a binary table.
Dominant AFLP markers found in the genetic linkage analysis were named through the initial letters according to their fluorescence (ex: Joe, Ned and Fam), followed by two numbers corresponding to the combination of primers used in the EcoRI and MseI selective amplification (Table 1) and three final numbers representing the size (in base pairs) of the marker.
2.4. Segregation and Association Analysis
The software GQMOL [19] was used for Mendelian segregation analyses and to identify genetic linkage groups. This software is a computer application for the analysis of molecular data and their associations with quantitative characters. Segregation analysis was performed through Chi-square (X2) tests, with an established decision level at P = 0.01 and an obtained p value for individual tests.
Only the polymorphic markers present in the parents of families 1 and 2 which segregated in the Mendelian proportions of 1:1 or 3:1 at P < 0.01 were considered. Markers that did not behave according to these expected Mendelian segregation ratios were discarded. The recombination events were counted for every two markers
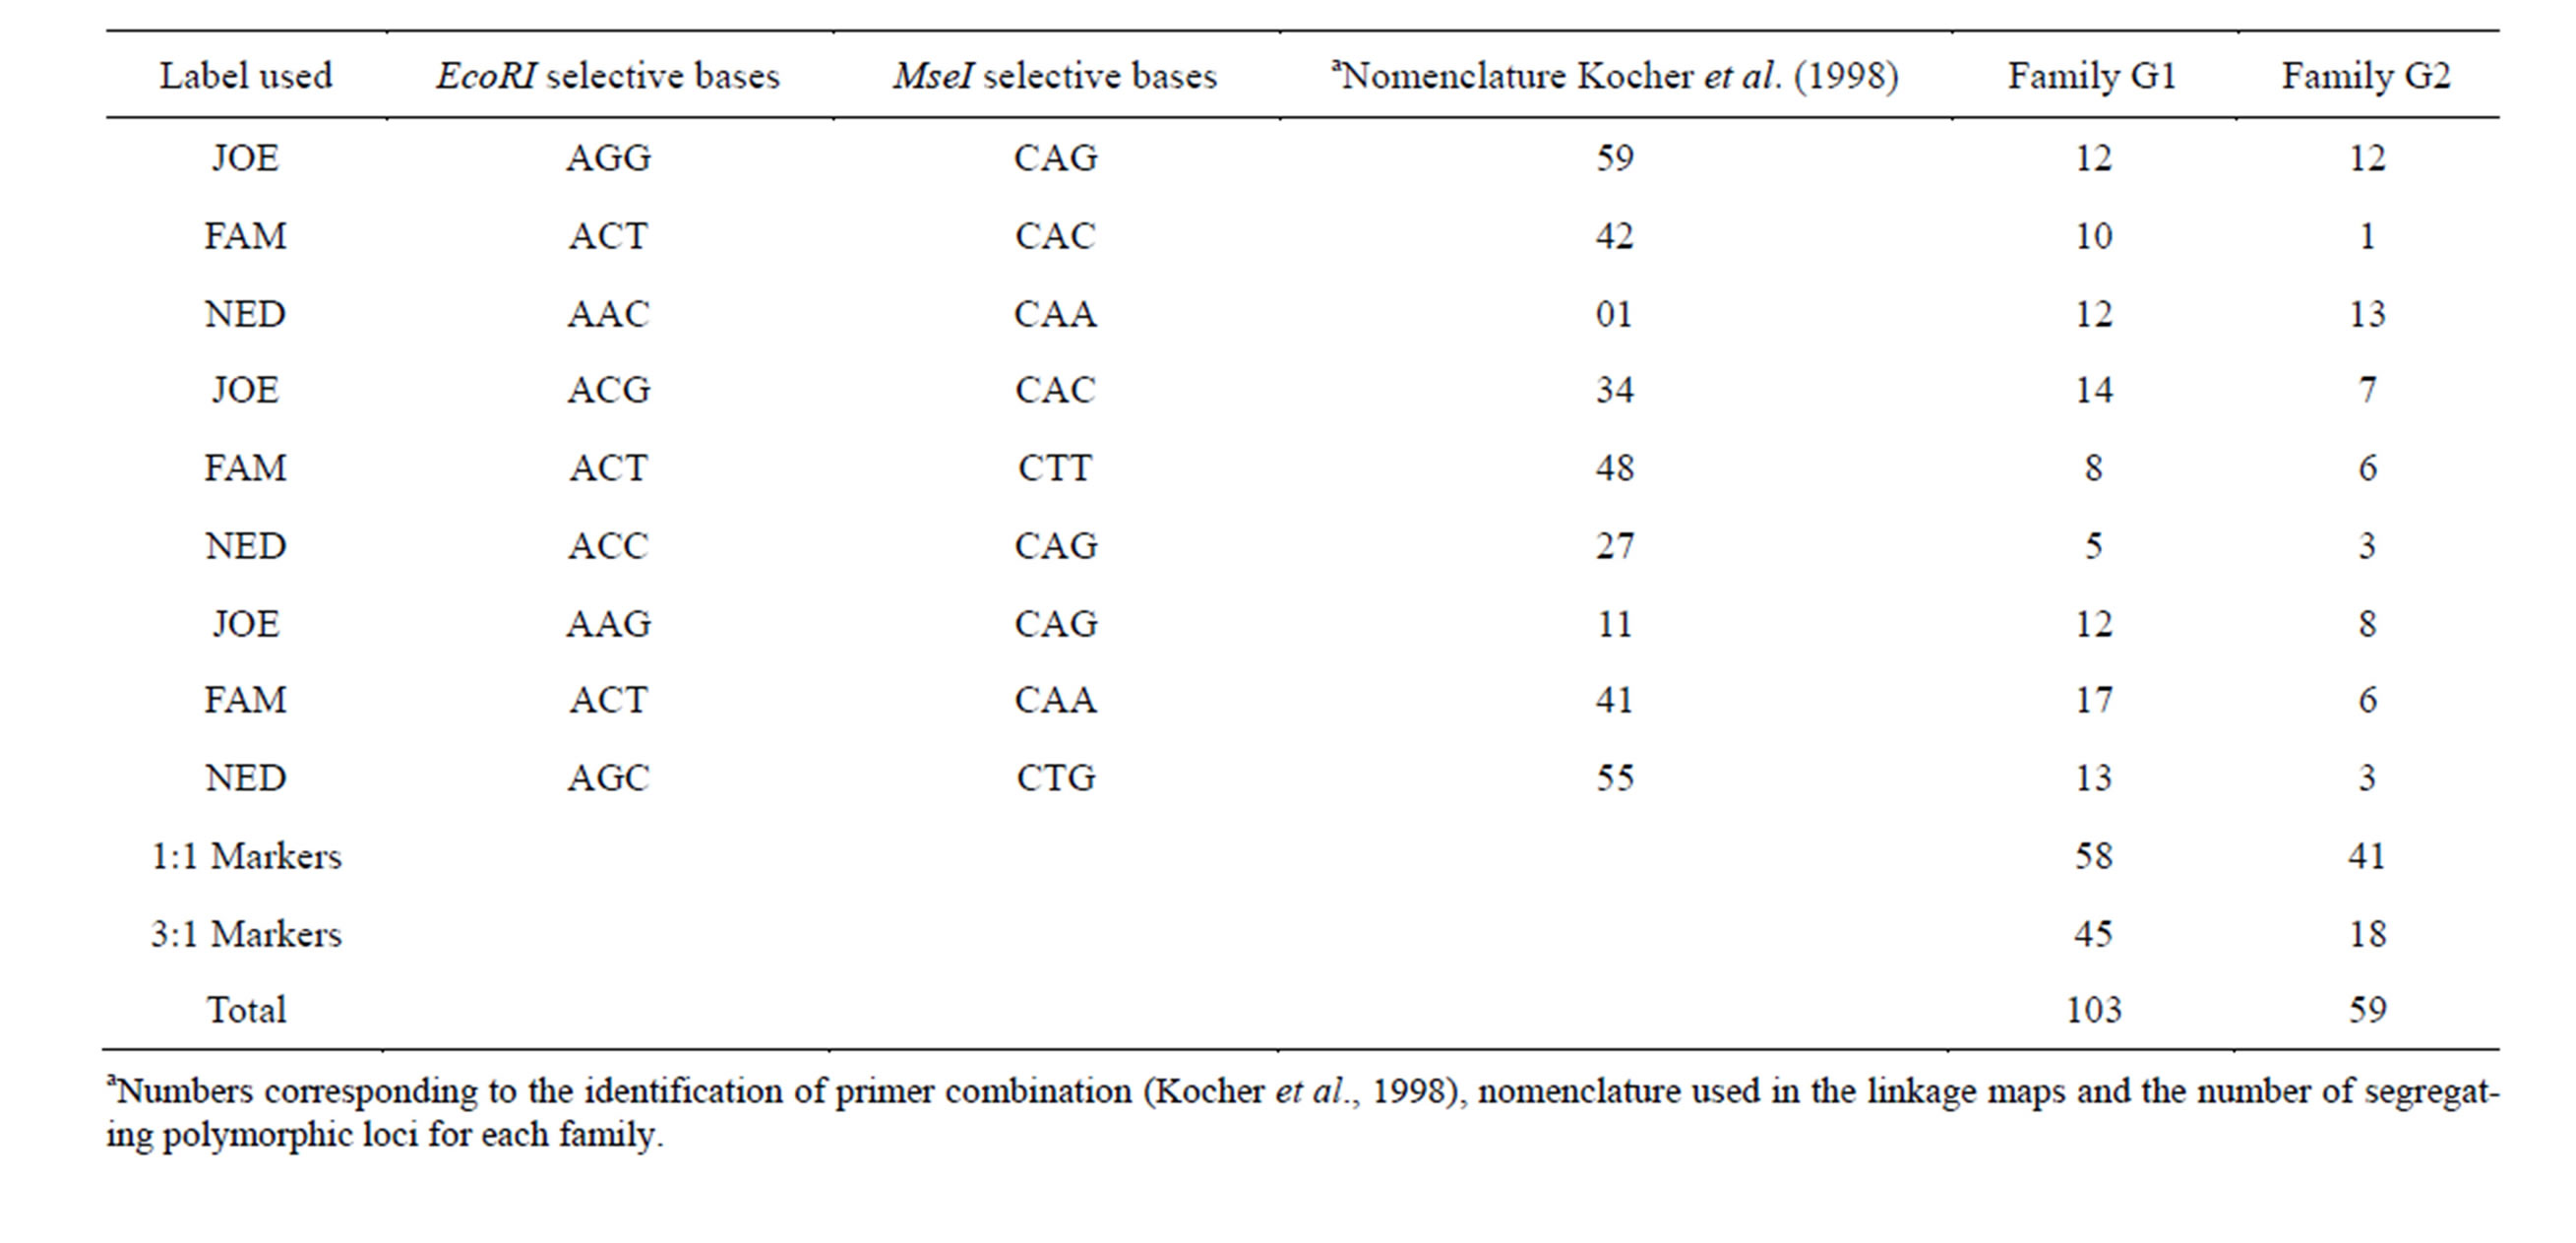
Table 1. AFLP primer combinations used in PCR amplifications.
at a time in each linkage group, after which the recombination frequency was calculated and the loci were allocated in the linkage groups according to the LOD values obtained. Only pairs of markers that presented the values LOD ≥ 3 and with maximum frequency recombination equal to 30 centiMorgans (cM) were considered in the map, despite other values having been tested. Map distance in cM was calculated using the Kosambi function [20].
The analyses of simple markers used to assess the presence of genes that may contribute to the variation of the economic traits of the L. vannamei were conducted using the mean of the weight and the IMN. A total of 192 samples phenotypically evaluated were used for the association analyses. The same loci with a 1:1 and 3:1 segregation pattern, previously used to identify linkage groups, were subjected to ANOVA (analysis of variance). Analyses of simple markers were performed using the software GQMOL. Only allocated markers in linkage groups were used.
3. RESULTS
3.1. Inheritance of AFLP Markers and Genetic Linkage Analysis
A total of 270 dominant AFLP polymorphic loci with sizes varying between 50 and 500 base pairs were produced with the nine EcoRI/MseI primer combinations in the linkage groups for family G1. The number of polymorphic loci generated by these combinations varied from a maximum of 50 for the combination ACT-CAA (FAM) to a minimum of 18 for ACC-CAG (NED), with an average of 30 polymorphic loci per primer. For the segregating loci, an average of 11.4 loci per primer was found, with a total of 103 segregating polymorphic loci being observed for this family (Table 1).
The segregation analysis, performed through the “Chisquare” (X2) test of the software GQMOL [19], revealed that 104 loci were polymorphic only in either the male or the female parent, but only 58 of these segregated in the Mendelian proportion of 1:1 at P < 0.01. The remainder 46 loci (44%) presented a deviation from the expected Mendelian proportion. On the other hand, 166 loci were found polymorphic in both parents, with 45 of these segregating in a Mendelian fashion under a proportion of 3:1 (P < 0.01).
For the genetic linkage analysis, the 103 polymorphic markers that presented the expected segregation ratios (58 with a 1:1 segregation and 45 with a 3:1 segregation) were selected. Of these, 98 markers (95%) were allocated to some linkage group, with the establishment of 14 linkage groups. The number of markers distributed in the established linkage groups varied from a minimum of two to a maximum of 42 markers per group, with an average of seven markers per observed group. The length of the linkage groups varied from 1.70 cM to 192.78 cM, according to the Kosambi function.
Additionally, a total of 188 dominant AFLP polymorphic loci with size variation between 50 and 500 base pairs were identified in the linkage groups for family G2. An average of 20.8 polymorphic loci per primer combination was observed, with a minimum of six and a maximum of 34 loci per primer. Segregation analysis of the markers at P < 0.01, revealed that 41 loci presented a Mendelian segregation of 1:1, and 18 loci presented a Mendelian segregation of 3:1, while 96 and 33 markers exhibited deviations from the 1:1 and 3:1 proportions, respectively. Again, the loci presenting segregation deviations were excluded from the analyses. The genetic linkage analysis for this family included only 59 segregating loci, resulting in four linkage groups. Forty-two markers (71.18%) were allocated to these linkage groups, with the number of markers varying from a minimum of 3 to a maximum of 32 per linkage group. The length of the linkage groups varied from 28.46 cM to 183.74 cM. The remainder 17 polymorphic and segregating markers in this family were not included in any linkage group.
3.2. Simple Marker Analysis
The trait weight was analyzed in 192 individuals of the families G1 and G2. The former had an average of 13.03 g ± 0.1391, with minimum and maximum values of 8.95 g and 19.15 g respectively, and variance of 3.72. The values of G2 ranged from 6.35 g to 21.35 g and variance of 5.56, with an average of 14.45 g ± 0.1702.
The phenotypic analysis for the incidence of IMN revealed the presence of the disease in 19.27% (37 individuals) in the family G1 and in 34.90% (67 individuals) of the G2.
The 103 and 59 polymorphic loci respectively found in the families G1 and G2, which presented a segregation ratio of 1:1 e 3:1, were used in the analysis of simple marker for the weight and IMN traits. Those that presented a significant association to the phenotypic characteristics assessed were detected through both analysis of variance (ANOVA) and linear regression (Tables 2-5). Analysis of variance and linear regression were performed considering two treatments whose phenotypic averages were associated with the presence and absence of loci.
The analyses detected marks associated to both traits investigated. In the family G1, the weight was observed in the regions of the markers Fam41360 until the Fam- 41262 (totaling 40 markers) in the linkage group (LG) 1. Five markers were found from Joe34248 to JOE1166 in the LG4, Fam41157, Joe 34247 and Joe34374 in the LG5, and Joe34329, Joe34246 and Fam41153 in the LG 10. The markers Fam42231 and Ned5597, found in the
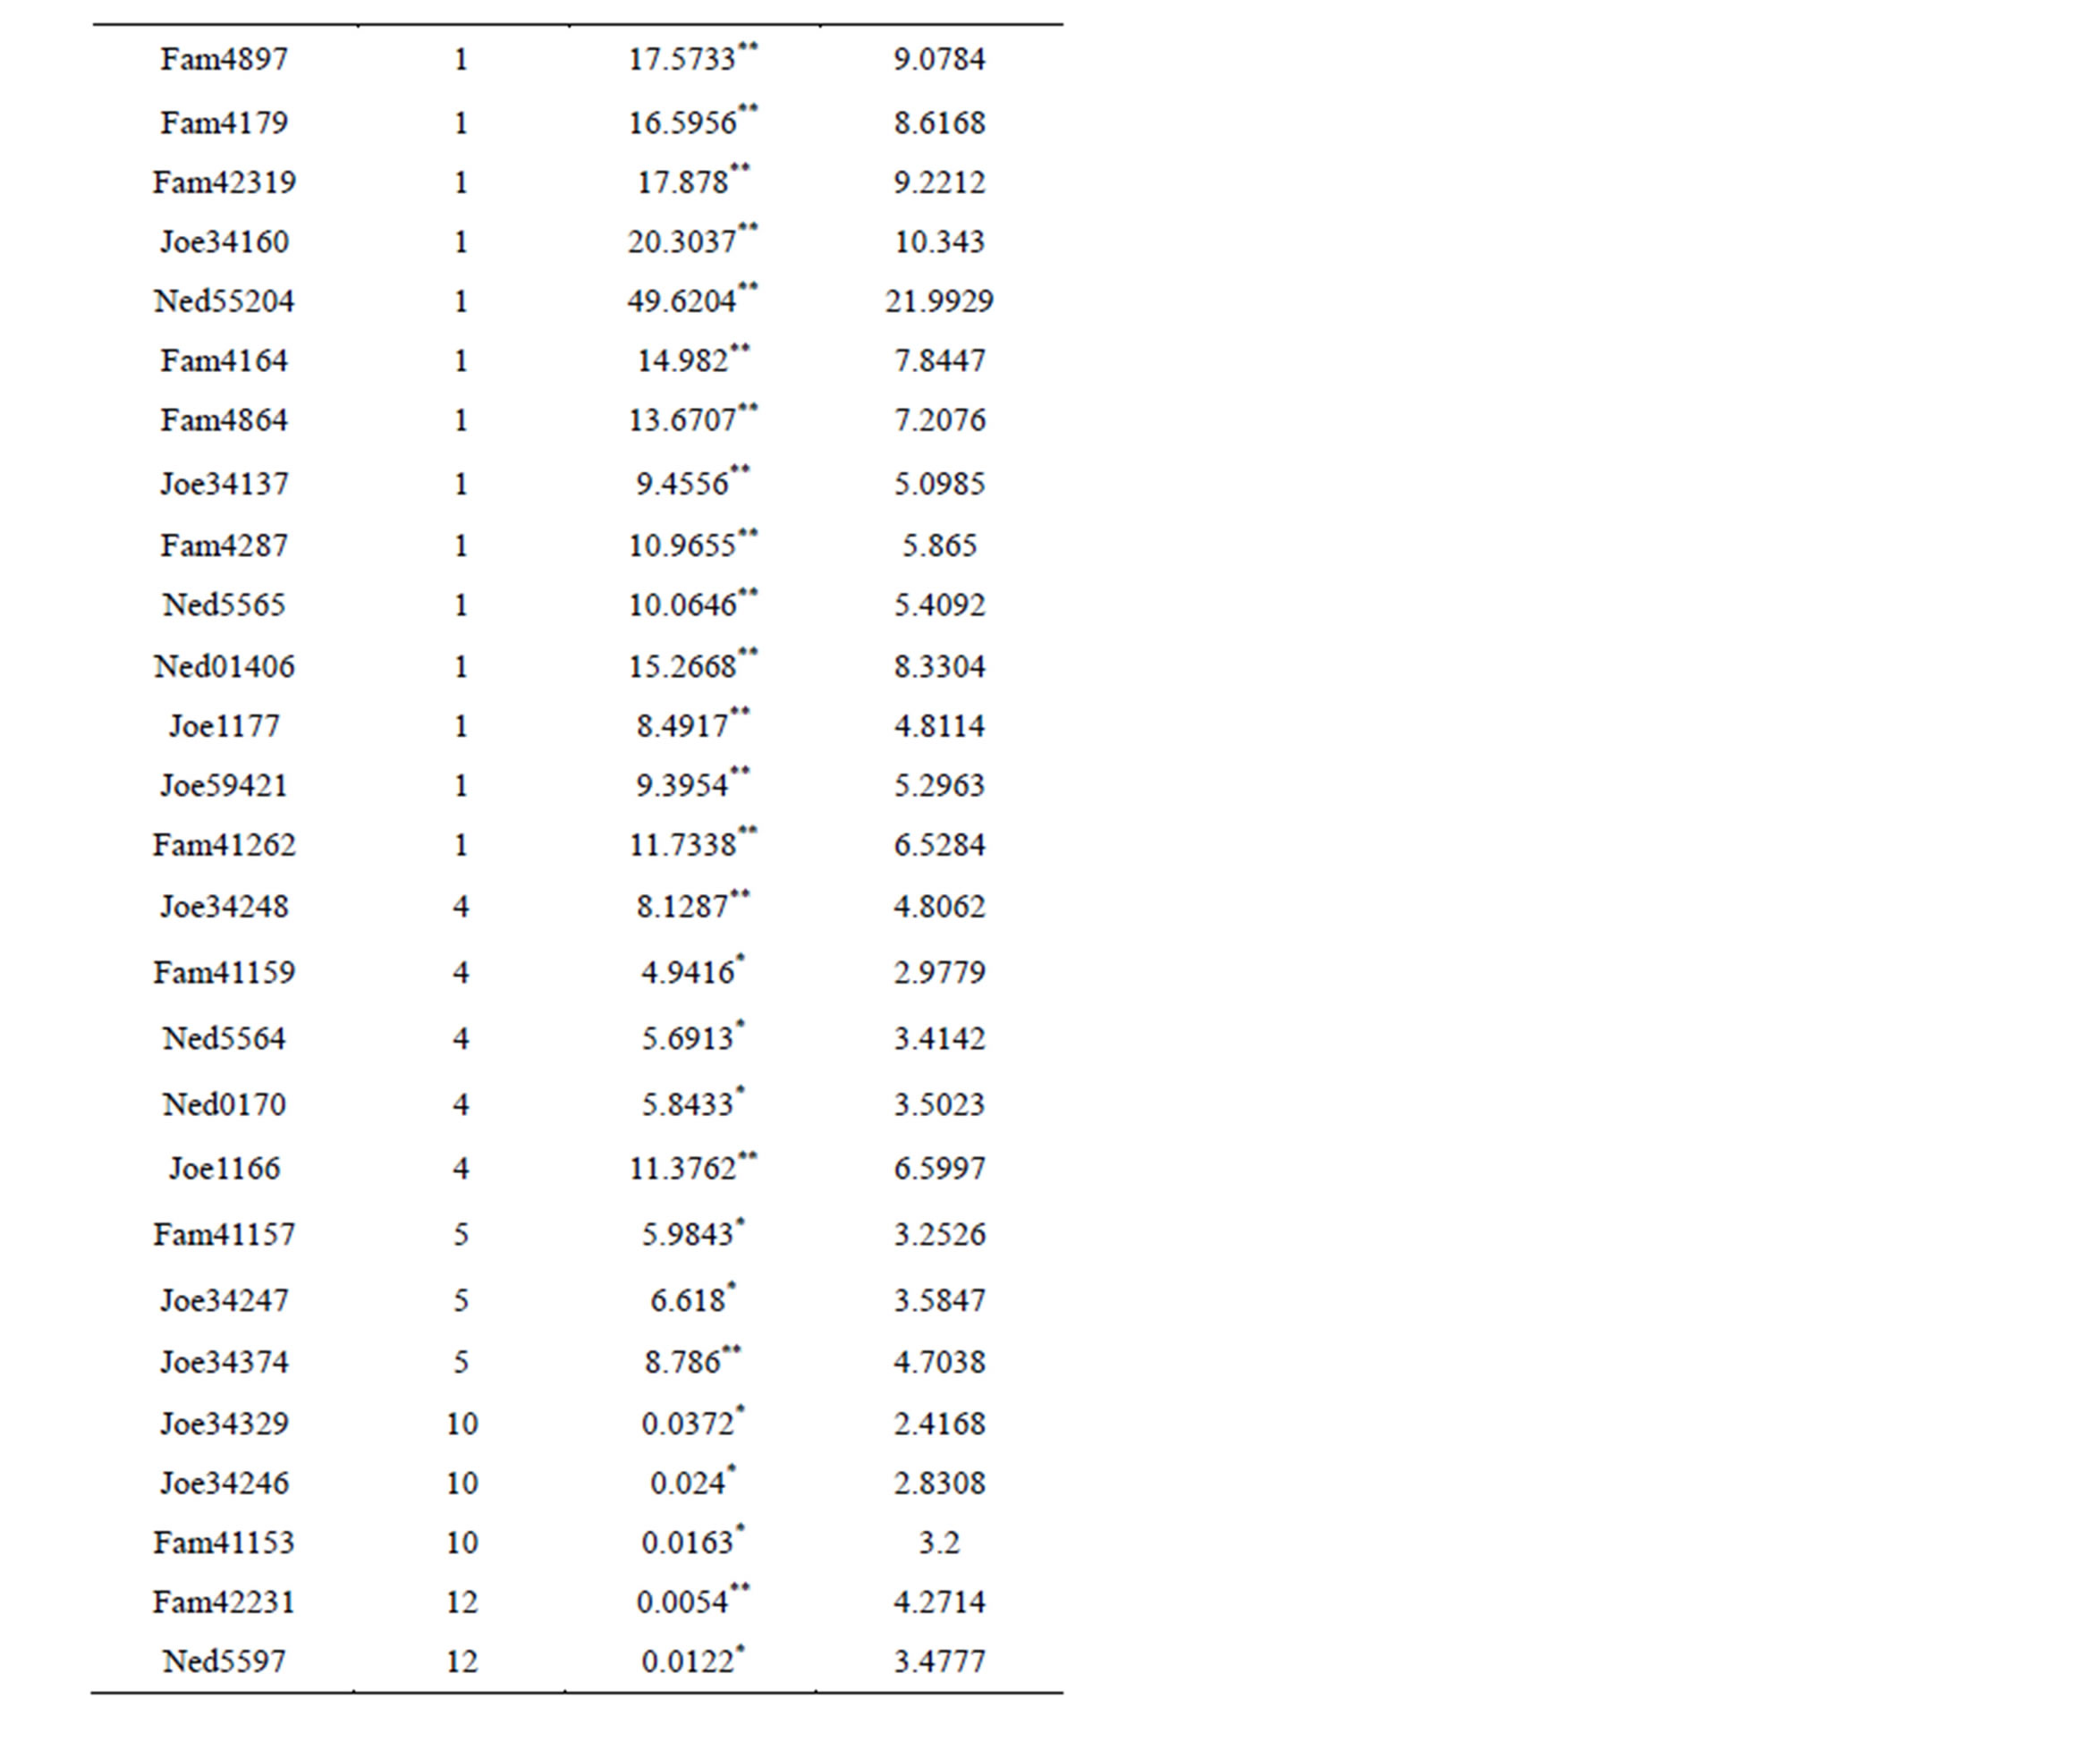
Table 2. Association analysis of AFLP markers with phenotypic trait (weight) in G1 family.
LG12, were associated to the weight as well.
In the family G2, nine markers (from Joe5972 to Joe- 34137) in the LG1 (Table 2) were associated to the weight, as well as those in the LG2 (Ned01138 and Ned- 0195) and LG3 (Ned0154), totaling the number of 12. No associated markers were found in the LG4.
Regarding the incidence of IMN for the family G1, only Ned0159 and Ned2750 in the LG1, Joe11151 in the LG 4, and Joe5969 in the LG11 showed to be significantly associated to the disease. As for G2, only Ned0166, Ned01100, Fam4864 and Ned01109 in the LG1 were associated.
4. DISCUSSION
4.1. Inheritance of AFLP Markers and Genetic Linkage Analysis
The AFLP technique used here was able to generate a
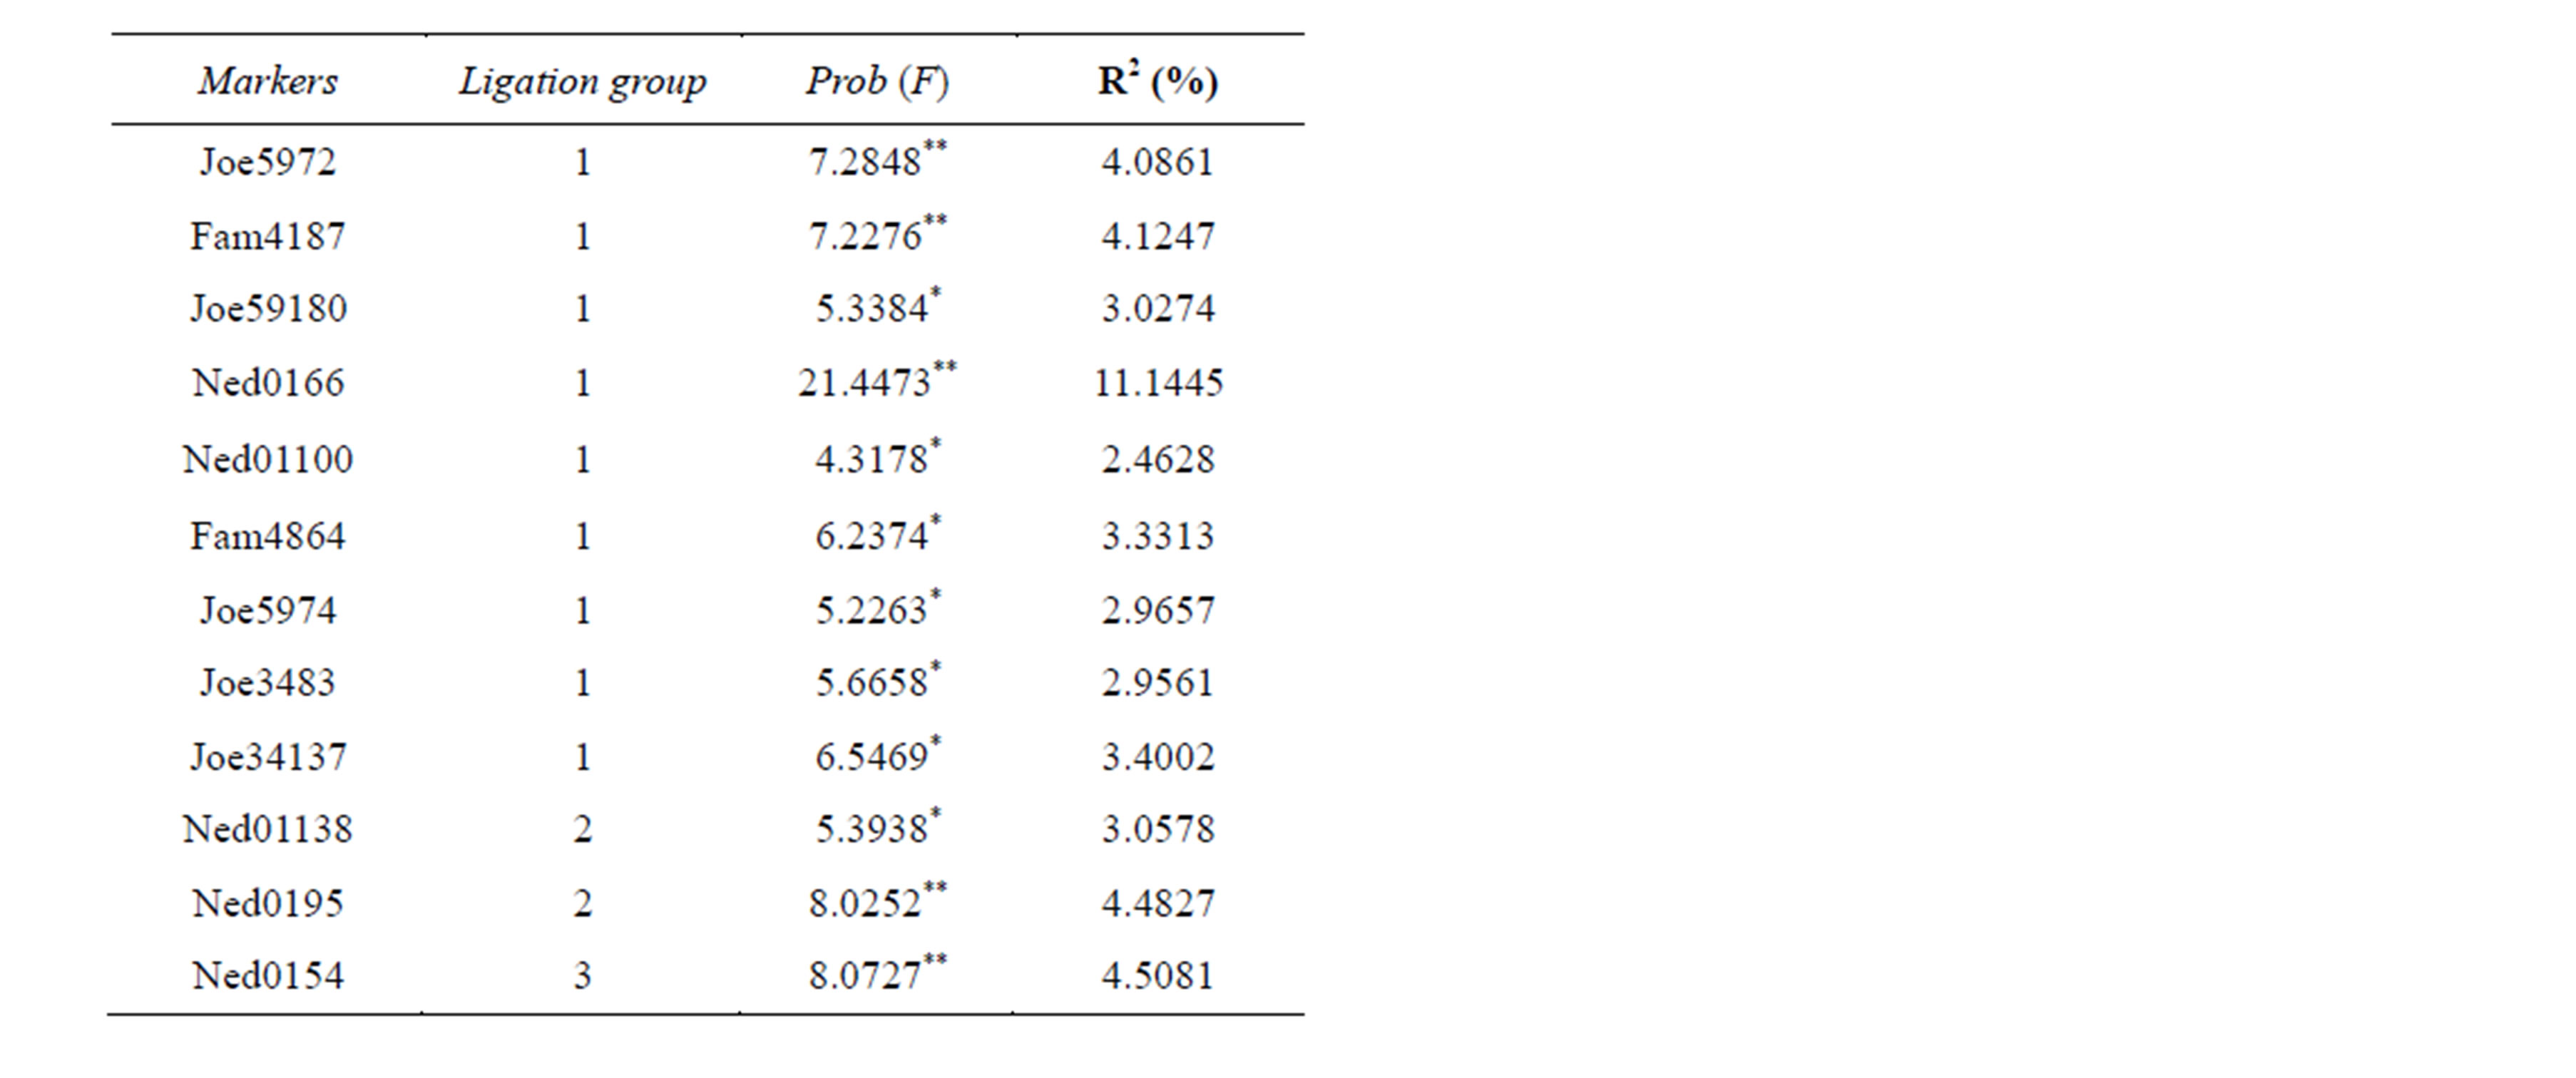
Table 3. Association analysis of AFLP markers with phenotypic trait (weight) in G2 family.
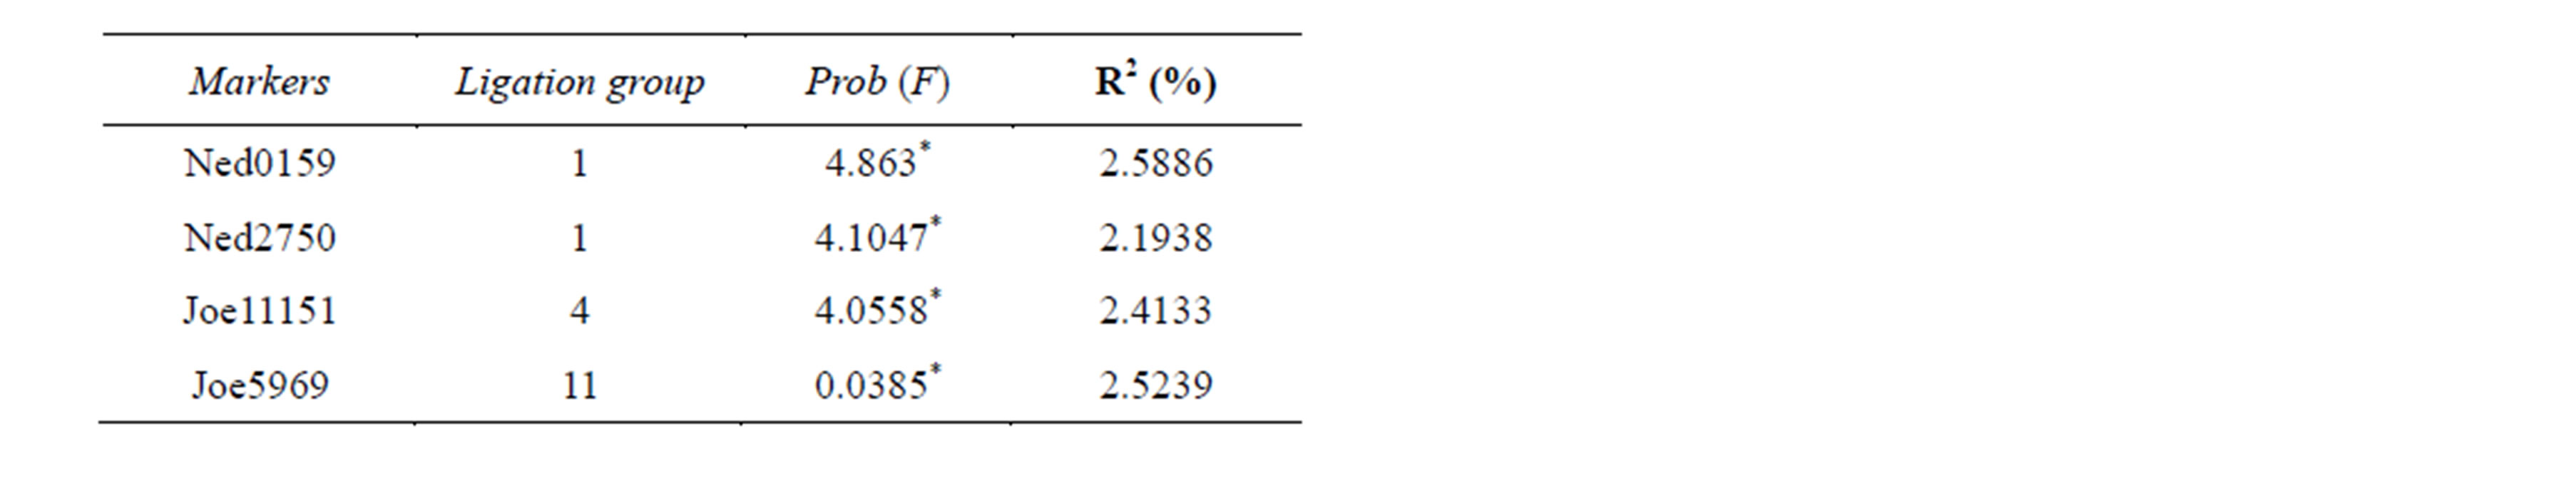
Table 4. Association analysis of AFLP markers with phenotypic trait (IMN disease) in G1 family.
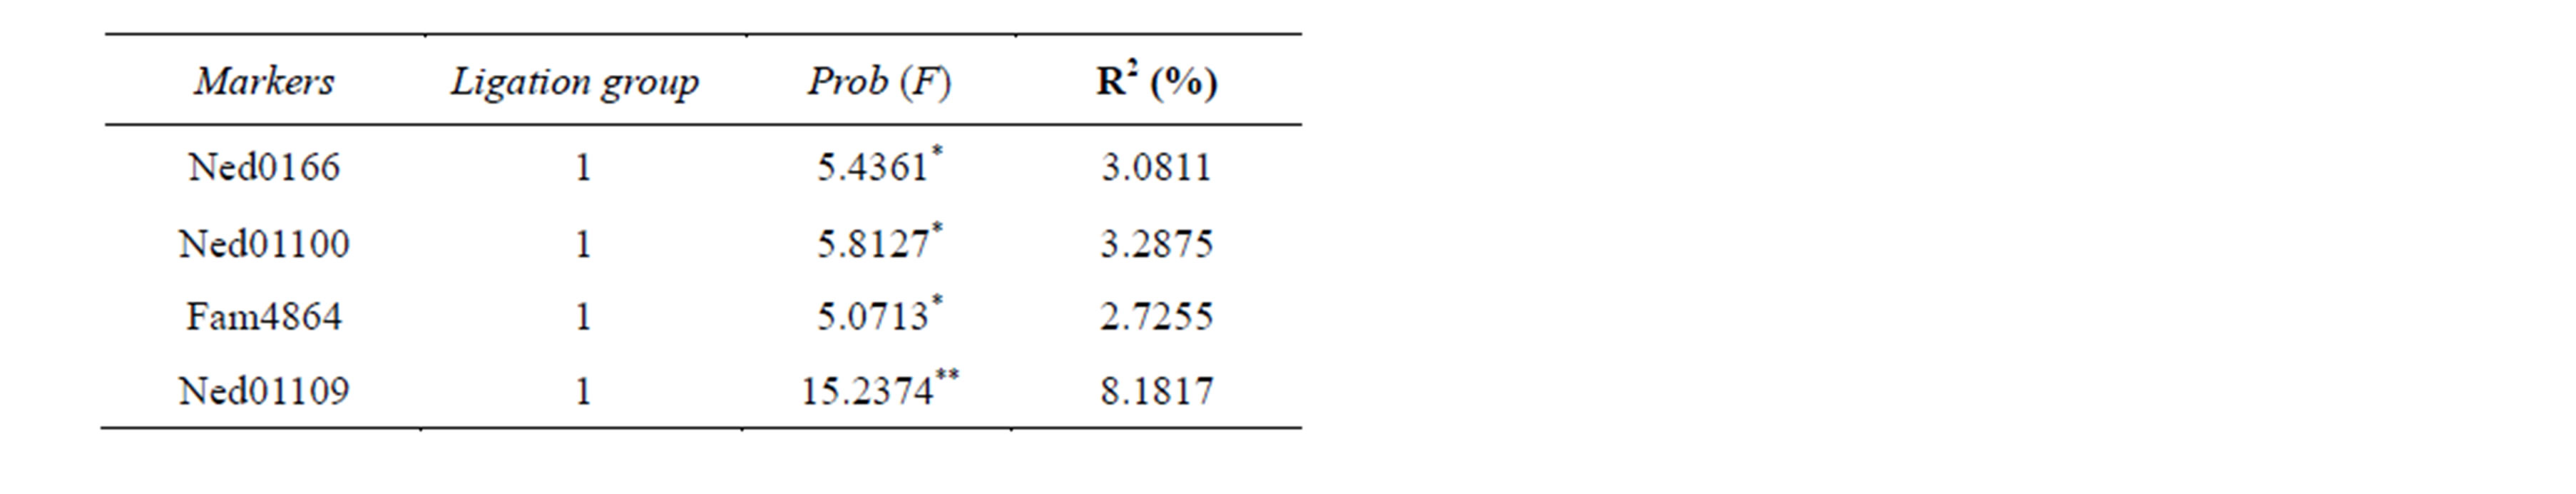
Table 5. Association analysis of AFLP markers with phenotypic trait (IMN disease) in G2 family.
considerable number of polymorphic loci sufficient to genetic linkage analysis for two full-sib families of L. vannamei, similarly to previous studies in different shrimp species [4-10].
The average of segregating polymorphic loci per AFLP primer combination observed in the family G1 (11.4) and G2 (6.5) was in the range of previously reported in other shrimp species [5-7], although the difference observed between families G1 and G2 may likely be related to the different breeding composition of the two families G1 and G2.
Among the 270 polymorphic loci identified in family G1, only 103 (38%) exhibited the expected Mendelian proportions; while in family G2, among the 188 polymorphic loci identified, only 59 (31%) exhibited the expected Mendelian proportions. In similar AFLP approach in L. vannamei, comparable high distortion rates from expected Mendelian segregation ratios for AFLP markers were already reported [9,10]. For microsatellite-based maps, the proportion of markers exhibiting distorted segregation ratios was less than 10% [10].
Studies in other penaeid shrimp species using AFLP markers reveal fewer deviations from the Mendelian proportions than those found for L. vannamei. In M. japonicus, for example, a distortion rate of less than 5% was found [5], while in F. chinensis only 12.2% of the established loci presented deviations from the expected proportions [8]. Factors that may be responsible for distortions from the expected Mendelian segregation ratios are possible statistical deviations due to low sample sizes, genotyping errors, and factors of biological nature, such as physical proximity to genes related to meiotic drive and/or viability of genotypes after zygote formation [21]. Bearzoti [22] recommends that loci with segregation deviations be excluded from the genetic linkage analysis since they may significantly influence the statistical tests used for detecting linkage groups, thus generating biased results.
The number of segregating loci identified here with only nine primer combinations was on average higher than values that have been reported for L. vannamei in other studies using AFLP markers. The maximum number of markers found per linkage group was also higher, although a lower number of linkage groups have been established. In contrast, if considering only LG1, the length of this linkage group was 192.78 cM for family G1 and 183.74 cM for family G2, values superior to the major linkage group lengths (159 cM) observed by Pérez et al. (2004) [9]. Larger linkage groups were obtained when combination of AFLP markers and microsatellites were used [10].
Fourteen linkage groups including 270 AFLP markers were constructed covering 350 cM for G1 and four linkage groups including 188 AFLP markers were constructed covering 300 cM for G2. As the L. vannamei genome has n = 44 chromosomes [23], these fourteen (G1) and four (G2) linkage groups covered only part of the L. vannamei genome. Markers that remained unlinked were either from the other chromosomes or from segments of the chromosomes that are not closely linked to these linkage groups. In order to have better coverage of the whole genome, more markers need to be developed. These linkage groups could serve as a good starting point of a future mapping project, which might greatly facilitate the L. vannamei molecular breeding program. Considering the low number of primer combinations used here we had a quite high level of saturation level in the LG1 linkage group, presenting 42 and 32 segregating loci for the full-sib families G1 and G2, respectively. This high proportion of AFLP markers concentrated in a single linkage group favors studies that aim at the identification of markers with potential to assess genes controlling economically important traits in more precise regions of the genome [24].
4.2. Single Marker Analysis
Genetic analyses of complex traits in farmed species require appropriate breeding and reference families with performance production records. This type of analysis has not progressed as fast as the genetic linkage map construction. A greater advancement has been noticed with fish research [25-35], and few is known in shrimp [8,36-38].
There is a great potential in the detection, characterization and the use of the loci controlling traits of economic interest for improving the efficiency of selection of cultured shrimp species. The single marker analysis detected marks linked to genes that may influence the studied traits in both families. Although this type of analysis does not allow the estimation of the QTL position, it constitutes an initial approach for its detection, because it estimates the effect of an association between a particular marker and the QTLs [39]. In the present study, the results for weight regarding both families are consistent. For G1, the markers Fam41175, Fam4867, Fam48310, Fam42341 e Ned5520 were those that showed higher coefficient of determination R2 (24.10, 23.29, 22.51, 22.05 e 21.99%, respectively) and best explained the phenotypic variation of weight in L. vannamei. The proportion of phenotypic variation for these markers ranged from 2.41% for the marker Joe34329 in the LG 10 to 24.10% for the marker Fam41175 in the LG 1. Unlike G1, the other family showed only one marker (Ned0166) with an increased coefficient of determination R2 of 11.15%. The proportion of phenotypic variation in this family ranged from 2.46% for the marker Ned01100 to 11.15% for the marker Ned0166 in the LG1. Similarly to these results, Li et al. [8] used the methods of interval mapping and composite interval mapping, and detected markers for weight in an F2 population explaining 13.65% e 13.23%, respectively.
There are a large number of markers in the linkage groups for both families, especially for the G1 which presented 42 markers in the first linkage group, most of them associated to the weight. This finding no necessarily indicates the existence of multiple QTLs for this trait, since it may reflect the effect of linkage disequilibrium with the same QTL. It is important to consider that the estimated effects of the markers always tend to be lesser than the real effect of the QTL, since recombination events may occur between this one and the marker [40].
Although strong results were also obtained for the incidence of IMN, the values of R2 were lower in comparison to those for the weight. Values of R2 presented by G1 for the markers Ned0159 (LG1), Ned2750 (LG1), Joe11151 (LG4) e Joe5969 (LG11) were around 2.4133%. The proportion of the explained phenotypic variation in the G2 ranged from 2.7255% for the marker Fam4864 to 8.1817% for Ned01109, both located on the linkage group 1. The proportion of the phenotypic variation explained by several QTLs previously detected for different traits in the shrimp Penaeus japonicus ranged from 7% to 14.73% [8,36], regarding a number of factors such as studied population, trait, experimental design and the resolution of the map in terms of number of markers.
The possibility of finding significant associations between specific markers and phenotype of interest in the F2 segregating population of L. vannamei through the analyses of single marks was confirmed. Thus, the outcomes obtained in the present study are relevant for the species and should provide subsidies to further studies on the genetic improvement of L. vannamei.
ACKNOWLEDGMENTS
The authors thank the following: Aquatec Industrial Pecuária and Genearch Aquacultura Ltda, for providing the shrimp samples, producing at our request the specific crosses under the mating design necessary for the mapping exercise, and therefore for turning possible this study; Fundação de Amparo à Pesquisa do Estado de São Paulo (Fapesp) and Conselho Nacional de Desenvolvimento Científico e Tecnológico (CNPq) for financial support.
REFERENCES
- Benzie, J.A.H. (2000) Population genetic structure in penaeid prawns. Aquaculture Research, 31, 95-119. http://dx.doi.org/10.1046/j.1365-2109.2000.00412.x
- MAPA/SARC/DPA (2001) Plataforma Tecnológica do camarão marinho cultivado: seguimento de mercado. Ministério da Agricultura, Pecuária e Abastecimento. Departamento de Pesca e Aqüicultura—Brasília: MAPA/SARC/ DPA, CNPq, ABCC, 276 p.
- Gjedrem, T., Robinson, N. and Rye, M. (2012) The importance of selective breeding in aquaculture to meet future demands for animal protein: A review. Aquaculture, 350-353, 117-129. http://dx.doi.org/10.1016/j.aquaculture.2012.04.008
- Moore, S.S., Whan, V., Davis, G.P., Byrne, K., Hetzel, D.J.S. and Preston, N. (1999) The development and application of genetic markers for the kuruma prawn Penaeus japonicus. Aquaculture, 173, 19-32. http://dx.doi.org/10.1016/S0044-8486(98)00461-X
- Li, Y., Byrne, K., Emmanuela, M., Whan, V., Moore, S., Keys, S., Crocos, P., Preston, N. and Lehnert S. (2003) Genetic mapping of the Kuruma Penaeus japonicus using AFLP markers. Aquaculture, 219, 143-156. http://dx.doi.org/10.1016/S0044-8486(02)00355-1
- Staelens, J., Rombaut, D., Vercauteren, I., Argue, B., Benzie, J. and Vuylsteke, M. (2008) High-density linkage maps and sex-linked markers for the black tiger shrimp (Penaeus monodon). Genetics, 179, 917-925. http://dx.doi.org/10.1534/genetics.107.080150
- Li, Z., Li, J., Wang, Q., He, Y. and Liu, P. (2006) AFLPbased genetic linkage map of marine shrimp Penaeus (Fenneropenaeus) chinensis. Aquaculture, 261, 463-472. http://dx.doi.org/10.1016/j.aquaculture.2006.07.002
- Pérez, F., Erazo, C., Zhinaula, M., Volckaert, F. and Calderón, J. (2004) A sex-specific linkage map of the white shrimp Penaeus (Litopenaeus) vannamei based on AFLP markers. Aquaculture, 242, 105-118. http://dx.doi.org/10.1016/j.aquaculture.2004.09.002
- Zhang, L., Yang, C., Yang, Z., Li, L., Zhang, X., Zhang, Q. and Xiang, J. (2007) A genetic linkage map of Pacific white shrimp (Litopenaeus vannamei): Sex-linked microsatellite markers and high recombination rates. Genetica, 131, 37-49. http://dx.doi.org/10.1007/s10709-006-9111-8
- Du, Z.Q., Ciobanu, D.C., Onteru, S.K., Gorbach, D., Mileham, A.J., Jaramillo, G. and Rothschild, M.F. (2009) A gene-based SNP linkage map for pacific white shrimp, Litopenaeus vannamei. Animal Genetics, 41, 286-294. http://dx.doi.org/10.1111/j.1365-2052.2009.02002.x
- Lynch, M. and Welsh, B. (1988) Genetics and analysis of quantitatie traits. Sinauer associates, Massachussetts.
- Vos, P., Hogers, R., Bleeker, M., Reijans, M., van de Lee, T., Hornes, M., Frijters, A., Pot, J., Peleman, J., Kuiper, M. and Zabeau, M. (1995). AFLP: A new technique for DNA fingerprinting. Nucleic Acids Research, 23, 4407- 4414. http://dx.doi.org/10.1093/nar/23.21.4407
- Gonçalves, M.M., Lemos, M.V.F., Galetti Jr., P.M., Freitas, P.D. and Furtado Neto, M.A.A. (2005) Fluorescent amplified fragment length polymorphism (fAFLP) analyses and genetic diversity in Litopenaeus vannamei (Penaeidae). Genetics and Molecular Biology, 28, 267-270. http://dx.doi.org/10.1590/S1415-47572005000200016
- Rocha, J.L., Galetti, P., Guerrelhas, A.C., Blott, S., Plastow, G., Ciobanu, D. and Van der Steen, H. (2005) Microsatellite-based assessment of genetic diversity and variability in a commercial Brazilian shrimp breeding program. Proceedings of the Aquaculture America 2005 Meeting, New Orleans, Louisiana, USA, p. 68 (abstract).
- Aljanabi, S.M. and Martinez, I. (1997) Universal and rapid salt-extraction of high quality genomic DNA for PCRbased techniques. Nucleic Acids Research, 25, 4692-4693. http://dx.doi.org/10.1093/nar/25.22.4692
- Kocher, T.D., Lee, W.-J., Sobolewska, H., Penman, D. and Mcandrew, B. (1998) A genetic linkage map of a cichlid fish, the tilapia (Oreochromis niloticus). Genetics, 148, 1225-1232.
- Applied Biosystems—PE (1997) AFLP Plant Mapping Protocol, 45p.
- Cruz, C.D. and Schuster, I. (2006) GQMOL: Application to computational analysis of molecular data and their associations with quantitative traits. Version 2012. http://www.ufv.br/dbg/gqmol/gqmol.htm
- Kosambi, D.D. (1944) The estimation of map distances from recombination values. Annals of Eugenics, 12, 172- 175. http://dx.doi.org/10.1111/j.1469-1809.1943.tb02321.x
- Vogl, C. and Xu, S. (2000) Multipoint mapping of viability and segregation distorting loci using molecular markers. Genetics Society of America, 155, 1439-1447.
- Ribeiro, A.O., Bearzoti, E. and Sáfadi, T. (2005) QTL mapping of Poisson traits: A simulation study. Crop Breeding and Applied Biotechnology, 5, 310-317.
- Ramos, R. (1997) Chromosome studies on the marine shrimps Penaeus vannamei and P. californiensis (Decapoda). Journal of Crustacean Biology, 17, 666-673. http://dx.doi.org/10.2307/1549369
- Darvasi, A., Weinreb, A., Minke, V., Weller, J.I. and Soller, M. (1993) Detecting marker-QTL linkage and estimating QTL gene effect and map location using a saturated genetic map. Genetics, 134, 943-951.
- Jackson, T.R., Ferguson, M.M., Danzmann, R.G., Fishback, A.G. and Ihssen, P.E., O’Connell, M. and Crease, T.J. (1998) Identification of two QTL influencing upper temperature tolerance in three rainbow trout (Oncorhynchus mykiss) half-sib families. Heredity, 80, 143-151. http://dx.doi.org/10.1046/j.1365-2540.1998.00289.x
- Danzmann, R.G., Jackson, T.R. and Ferguson, M. (1999) Epistasis in allelic expression at upper temperature tolerance QTL in rainbow trout. Aquaculture, 173, 45-58. http://dx.doi.org/10.1016/S0044-8486(98)00465-7
- Sakamoto, T., Danzmann, R.G., Okamoto, N., Ferguson, M.M. and Ihssen, P.E. (1999) Linkage analysis of quantitative trait loci associated with spawning time in rainbow trout (Oncorhynchus mykiss). Aquaculture, 173, 33- 43. http://dx.doi.org/10.1016/S0044-8486(98)00463-3
- Robison, B.D., Wheeler, P.A., Sundin, K., Sikka, P. and Thorgaard, G.H. (2001) Composite interval mapping reveals a major locus influencing embryonic development rate in rainbow trout (Oncorhynchus mykiss). Journal of Heredity, 92, 16-22. http://dx.doi.org/10.1093/jhered/92.1.16
- Perry, G.M., Danzmann, R.G., Ferguson, M.M. and Gibson, J.P. (2001) Quantitative trait loci for upper thermal tolerance in outbred strains of rainbow trout (Oncorhynchus mykiss). Heredity, 86, 333-341. http://dx.doi.org/10.1046/j.1365-2540.2001.00838.x
- Ozaki, A., Sakamoto, T., Khoo, S., Nakamura, K., Coimbra, M.R., Akutsu, T. and Okamoto, N. (2001) Quantitative trait loci (QTL) associate with resistance/susceptibility to infectious pancreatic necrosis virus (IPNV) in rainbow trout (Oncorhynchus mykiss). Heredity, 86, 333- 341.
- Shirak, A., Palti, Y., Cnaani, A., Korol, A., Hulata, G., Ron, M. and Avtalion, R.R. (2002) Association between loci with deleterious alleles and distorted sex ratios in an inbred line of tilapia (Oreochromis aureus). Journal of Heredity, 93, 270-276. http://dx.doi.org/10.1093/jhered/93.4.270
- Reid, D.P., Szanto, A., Glebe, B., Danzmann, R.G. and Ferguson, M.M. (2005) QTL for body weight and condition factor in Atlantic salmon (Salmo salar): Comparative analysis with rainbow trout (Oncorhynchus mykiss) and Arctic charr (Salvelinus alpinus). Heredity, 94, 166-172. http://dx.doi.org/10.1038/sj.hdy.6800590
- Sánchez-Molano, E., Cerna, A., Toro, M.A., Bouza, C., Hermida, M., Pardo, B.G., Cabaleiro, S., Fernández, J. and Martinez, P. (2011) Detection of growth-related QTL in turbot (Scophthalmus maximus). BMC Genomics, 12, 473. http://dx.doi.org/10.1186/1471-2164-12-473
- Boulton, K., Massault, C., Houston, R.D., Koning, D.J., Haley, C.S., Bovenhuis, H., Batargias, C., Canário, A.V.M., Kotoulas, G. and Tsigenopoulos, C.S. (2011) QTL affecting morphometric traits and stress response in the gilthead seabream (Sparus aurata). Aquaculture, 319, 58-66. http://dx.doi.org/10.1016/j.aquaculture.2011.06.044
- Drew, R.E., Schwabl, H., Wheeler, P.A. and Thorgaard, G.H. (2007) Detection of QTL influencing cortisol levels in rainbow trout (Oncorhynchus mykiss). Aquaculture, 272, S183-S194. http://dx.doi.org/10.1016/j.aquaculture.2007.08.025
- Lyons, R.E., Dierens, L., Preston, N.P., Crocos, P., Coman, G. and Li, Y. (2007) Identification and characterization of QTL markers for growth traits in kuruma shrimp P. japonicus. Aquaculture, 272, S284-S285. http://dx.doi.org/10.1016/j.aquaculture.2007.07.123
- Dong, S., Kong, J., Meng, X., Zhang, Q., Zhang, T. and Wang, R. (2008) Microsatellite DNA markers associated with resistance to WSSV in Penaeus (Fenneropenaeus) chinensis. Aquaculture, 282, 138-141. http://dx.doi.org/10.1016/j.aquaculture.2008.05.037
- Tian, Y., Kong, J. and Luan, S. (2008) Estimation of genetic Parameters for Growth traits of Chinese shrimp Fenneropenaeus chinensis. Marine Fisheries Research, 29, 1-6.
- Borém, A. and Caixeta, E.T. (2009) Marcadores moleculares. 2nd Edition. Independent Production, Viçosa.
- Broman, K.W. (2001) Review of statistical methods for QTL mapping in experimental crosses. Reprinted from Lab Animal, 30, 44-52.
- LIST OF ABBREVIATIONS
- AFLP: Amplified Fragment Length Polymorphism
- QTL: Quantitative trait locus
- fAFLP: Fluorescence amplified fragment length polymorphism
- PL: Shrimp larvae
- IMN: Idiopathic muscle necrosis
- GQMOL: Software used for Mendelian segregation analyses and to identify genetic linkage groups
- LG: Linkage group
NOTES
*Corresponding author.