Modern Economy
Vol.3 No.4(2012), Article ID:21290,6 pages DOI:10.4236/me.2012.34060
Stock Return Conjunction in Markets with Deteriorated Sentiment: Evidence from the Japanese Electric Appliances Industry
Graduate School of Systems and Information Engineering, University of Tsukuba, Ibaraki, Japan
Email: mail_sec_low@minos.ocn.ne.jp
Received March 10, 2012; revised March 20, 2012; accepted April 23, 2012
Keywords: Exponentially Weighted Correlation Coefficient; Implied Volatility; Market Sentiment; Return Conjunction
ABSTRACT
This paper aims to clarify the characteristics of stock return dynamics when investor sentiment is deteriorated in equity markets. Further, prior to our empirical analysis, we newly develop the measures of return conjunction and the exponentially weighted correlation coefficient. Namely, our contributions are as follows. First, this paper clarifies the fact that when market sentiment is deteriorated, stock returns present conjunctional behavior. Second, for our empirical analysis, we newly develop two kinds of conjunction measures of stock returns. Third, we also develop the exponentially weighted correlation coefficient measure referring to the exponentially weighted volatility suggested by J.P. Morgan. This correlation measure is a useful tool because it captures forward-looking correlation without difficulty caused by model estimation.
1. Introduction
Academic researchers and practitioners are increasingly paying attention to investor sentiment in stock markets. Representative studies regarding this market sentiment are such as [1-6].
In addition, many new studies are following the above studies as seen in [7-11]; however, as far as we know, there seems to be no study which investigates the stock return dynamics when market sentiment is deteriorated.
Focusing on this point, this paper aims to clarify the characteristics of return dynamics in markets with deteriorated sentiment. This is the main objective of this paper. Furthermore, in the process of our analysis, we newly develop the measures of stock return conjunction and the exponentially weighted correlation coefficient measure as we describe the details in later sections.
This paper’s contributions are as follows. First, this study clarifies that when market sentiment is deteriorated, stock returns show conjunctional behavior. Second, prior to our empirical analysis, we newly develop two kinds of conjunction measures of stock returns. Third, we also develop the exponentially weighted correlation coefficient measure referring to the exponentially weighted volatility suggested by J. P. Morgan [12]. This new correlation measure is a useful tool especially in the situation where model parameter estimation is difficult.
The rest of the paper is organized as follows. First, Section 2 develops return conjunction measures, Section 3 explains our research design, Section 4 explains the data, Section 5 presents the empirical results, and Section 6 summarizes the paper.
2. Developments of Return Conjunction Measures
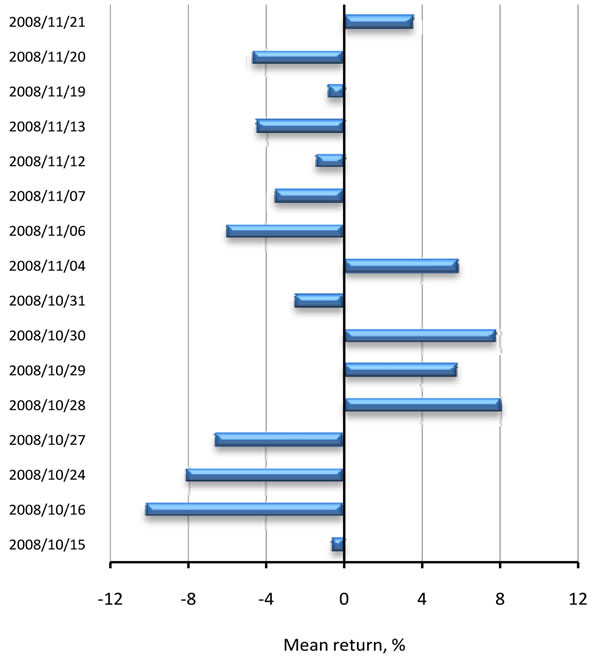
First, we construct two return conjunction measures. In very stable markets from the viewpoint of market sentiment, mean values of stock returns are not connected as Figure 1(a) shows. However, as Figure 1(b) indicates when a sentiment measure, implied volatility (IV) is extremely high, stock returns move to the same direction with showing conjunctional behavior. To capture this conjunctional behavior, two issues are important. Namely, first is the kurtosis of return distribution, which captures the degree of conjunction in returns. Second is the fraction of returns that move to the same direction. This is also important to measure the return conjunction. From the above two viewpoints, we construct the first conjunction measure as follows:
 (1)
(1)
where K denotes the kurtosis of 116 sample returns; m denotes the number of samples which moves to the same direction as the mean return of the Japanese electric appliances industry firms; and N is the number of all samples, that is, 116 in our case. Therefore, this measure
 (a)
(a)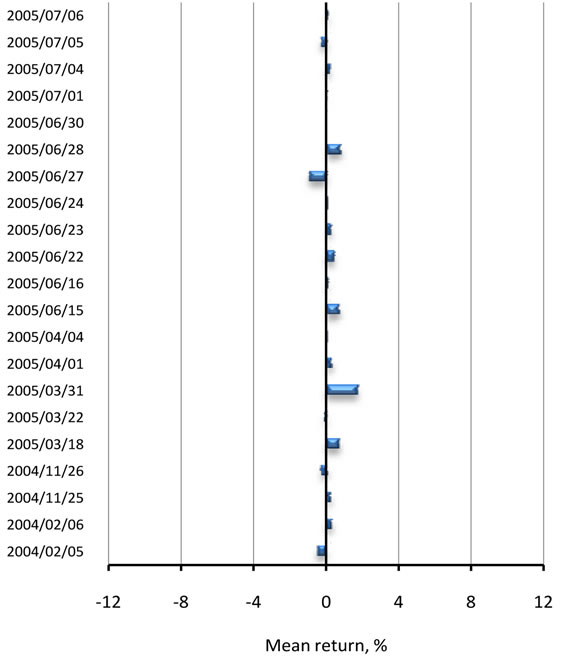 (b)
(b)
Figure 1. Degree of return conjunction in the extremely low or high IV markets. (a) Extremely low IV markets; (b) Extremely high IV markets.
(1) captures the degree of return conjunctional movement with two viewpoints.
Further, we also construct the second measure of return conjunction as follows:
 (2)
(2)
where K denotes the kurtosis of 116 sample returns again, and |Avg[ri]| means the absolute value of return average of the Japanese electric appliances industry firms. Hence this measure captures the degree of conjunctional return movement by incorporating the return kurtosis and skewness because the absolute value of return average reflects the actual return skewness.
Figure 2 displays the time-series trends of our first return conjunction measure (1), and Figure 3 exhibits the time-series dynamics of our second return conjunction measure (2), respectively.
3. Research Design
By using a stock market sentiment measure, implied volatility (IV) values from the Nikkei 225 options, we design our empirical research. To design our research effectively, we focus on extremely low IV dates and extremely high IV dates in our sample. More concretely, for our empirical tests, we regard extremely high IV dates as those when IV exceeds 80.0, while extremely low IV dates as those when IV is less than 13.5. As displayed in Table 1, only 13 extremely low IV days are seen in 3274 business days in our full sample. Also, Table 1 indicates that only 11 days are recognized as extremely high IV days.
Moreover, further looking at the situation in Table 1, we understand that extremely low IV dates focus on a certain period, and extremely high IV dates also focus on a certain period. Therefore, this paper designs the high IV period as 45 successive business days from May 31, 2005 to August 2, 2005; while we set the low IV period as 45 successive business days from October 10, 2008 to December 16, 2008.
Based on the above setting, we investigate whether correlations between IV and our conjunction measures increase in the period when market sentiment is deteriorated. For statistically rigorous tests, we conduct t-tests and Welch’s tests by incorporating the following new correlation coefficient measure of IV and our return conjunction measure, H:
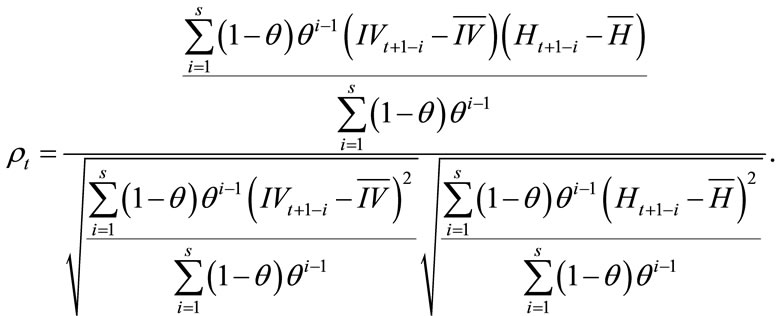 (3)
(3)

Figure 2. Trends of the first conjunction measure of stock returns.

Figure 3. Trends of the second conjunction measure of stock returns.
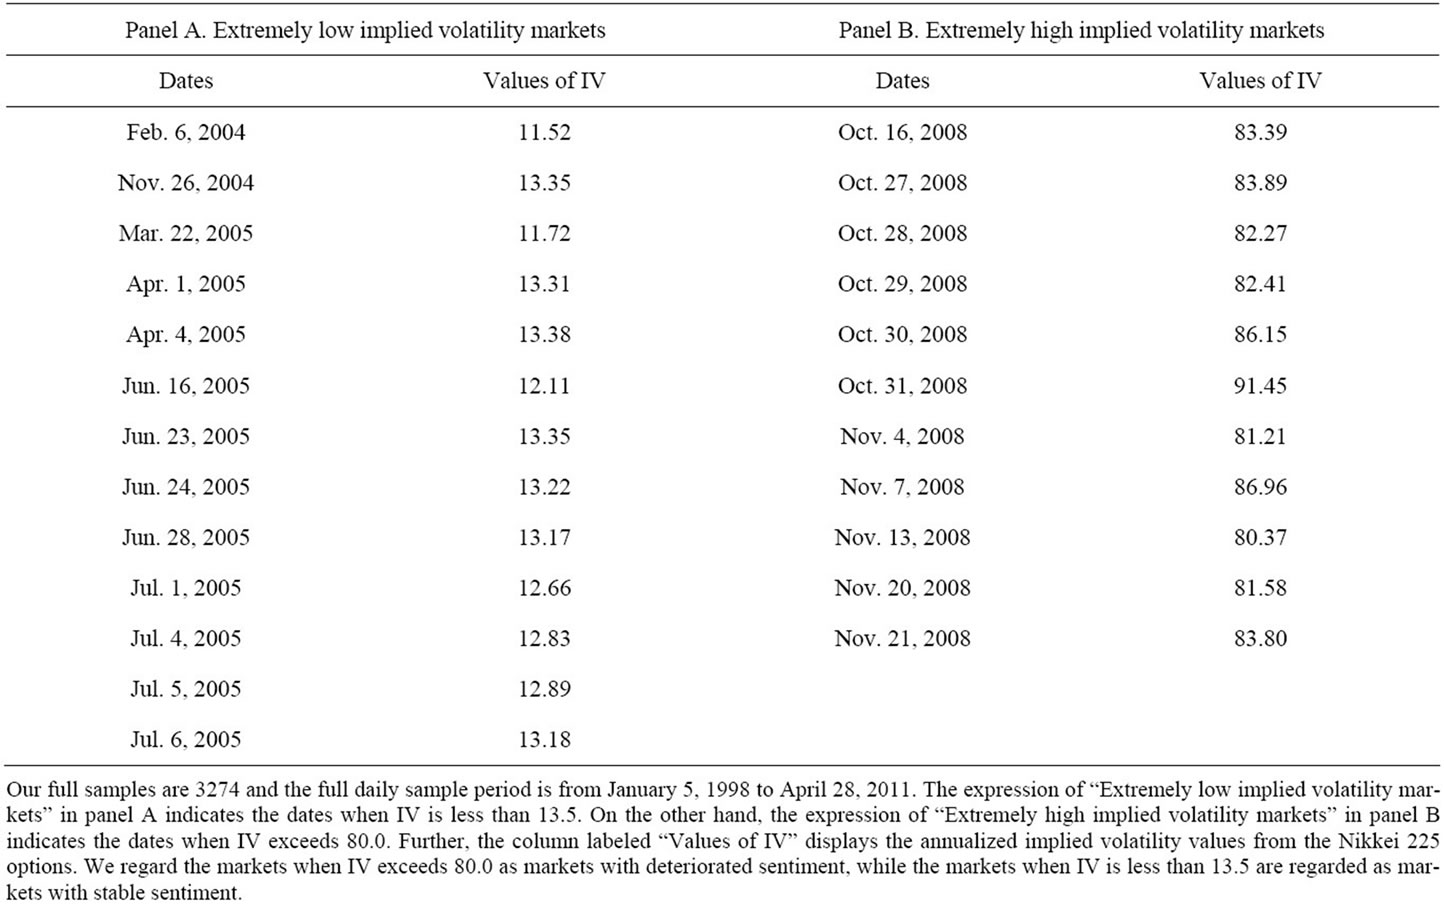
Table 1. Dates and values of IVs when extremely high or low IVs are recorded.
where θ denotes a parameter, S is the number of samples, IV with bar is the mean value of implied volatilities, and H with bar denotes the mean value of conjunction measure. Formula (3) is the exponentially weighted correlation coefficient (EWCC), which gives heavier weight on newer samples and lighter weight on older samples. Not in computing correlation coefficient but in volatility estimation, J. P. Morgan [12] uses this exponentially weighted method with employing the value of 0.94 in θ. Thus this paper employs the same value in θ of formula (3). Also, we use past 20 business days (i.e., S = 20 in formula (3)) in computing the EWCC. The situation of sample weights is exhibited in Figure 4. Using this favorable EWCC for capturing changing correlations between two variables more promptly than standard correlation coefficient, we test whether degree of return conjunction increases when market sentiment is deteriorated.
4. Data
The full sample period of our daily data is from January 5, 1998 to April 28, 2011. We use return data (from Nikkei Inc.) of 116 Japanese electric appliances industry companies, which are listed in the Tokyo Stock Exchange (TSE) First Section. Currently, the number of the electric appliances industry companies is the largest in the Tokyo Stock Price Index (TOPIX). Hence we understand that this industry is very important and core for the Japanese stock markets and this paper uses these companies’ data.
We also use the implied volatility data from the Nikkei 225 options (from Osaka University) to measure market sentiment. Generally, it is considered that extremely high implied volatility means that underlying stock market sentiment is deteriorated.
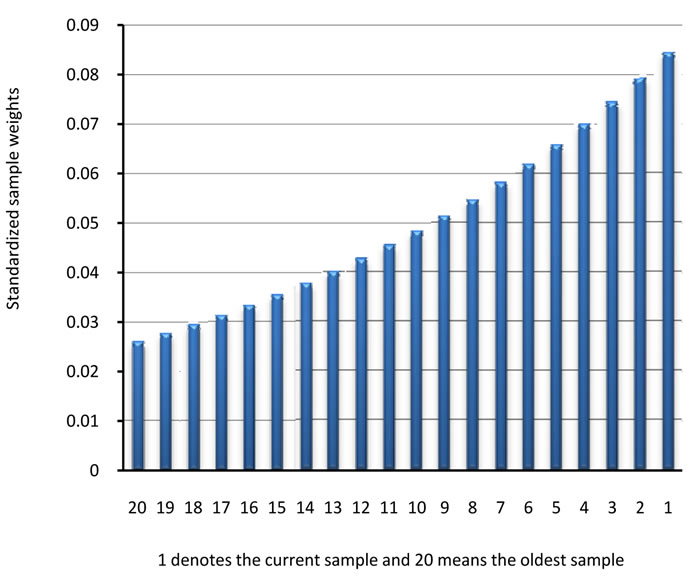
Figure 4. Standardized sample weights of the exponentially weighted correlation coefficient.
5. Empirical Results
This section describes our empirical results. We use the EWCC for all below tests that need correlation coefficients. First, panel A of Table 2 exhibits the t-test results. In the test, null hypothesis is no correlation between the degree of return conjunction and IV in stable market, while alternative hypothesis is positive correlation between two exists. The results show that in the test using our second conjunction measure, null hypothesis is rejected. However, in the test using our first conjunction measure, null hypothesis is supported. Hence we understand that in stable markets, the degree of return conjunction and IV are not necessarily correlated.
Next, panel B of Table 2 exhibits the similar t-tests as in panel A. In the tests, null hypothesis is no correlation between the degree of return conjunction and IV in markets with deteriorated sentiment, while alternative hypothesis is positive correlation exists. The results indicate that in both tests using our two kinds of conjunction measures, null hypothesis is rejected. Therefore, we understand that in markets with deteriorated sentiment, the degree of return conjunction and IV are statistically strongly correlated, and these have positive returns. This means that when market sentiment is deteriorated, stock returns present strong conjunctional behavior.
Further, panel C of Table 2 implements Welch’s tests. The null hypothesis of the tests is that the correlation coefficient between the degree of return conjunction and IV is the same in the lowand high-IV markets. While alternative hypothesis is the above correlation is higher in the high-IV markets than in the low-IV markets. The results demonstrate that in both tests using our two kinds of conjunction measures, null hypothesis is rejected. Therefore, this result means that in markets with deteriorated sentiment, the degree of return conjunction becomes stronger. To sum up, when investor sentiment is deteriorated, stock returns strongly move to the same direction with showing conjunctional behavior. Further, our first conjunction measure captures this conjunctional return dynamics better than our second measure.
6. Conclusions
This paper explored the degree of stock return conjunction in markets with deteriorated sentiment. Our research presented following novel contributions.
First, this paper newly developed the measures of return conjunction. By using these measures, we clarified and captured the return dynamics when investor sentiment is deteriorated in stock markets.
Second, we also developed the exponentially weighted correlation coefficient (EWCC) referring to the exponentially weighted volatility of J. P. Morgan. This EWCC is forward-looking and very useful in the sense that it
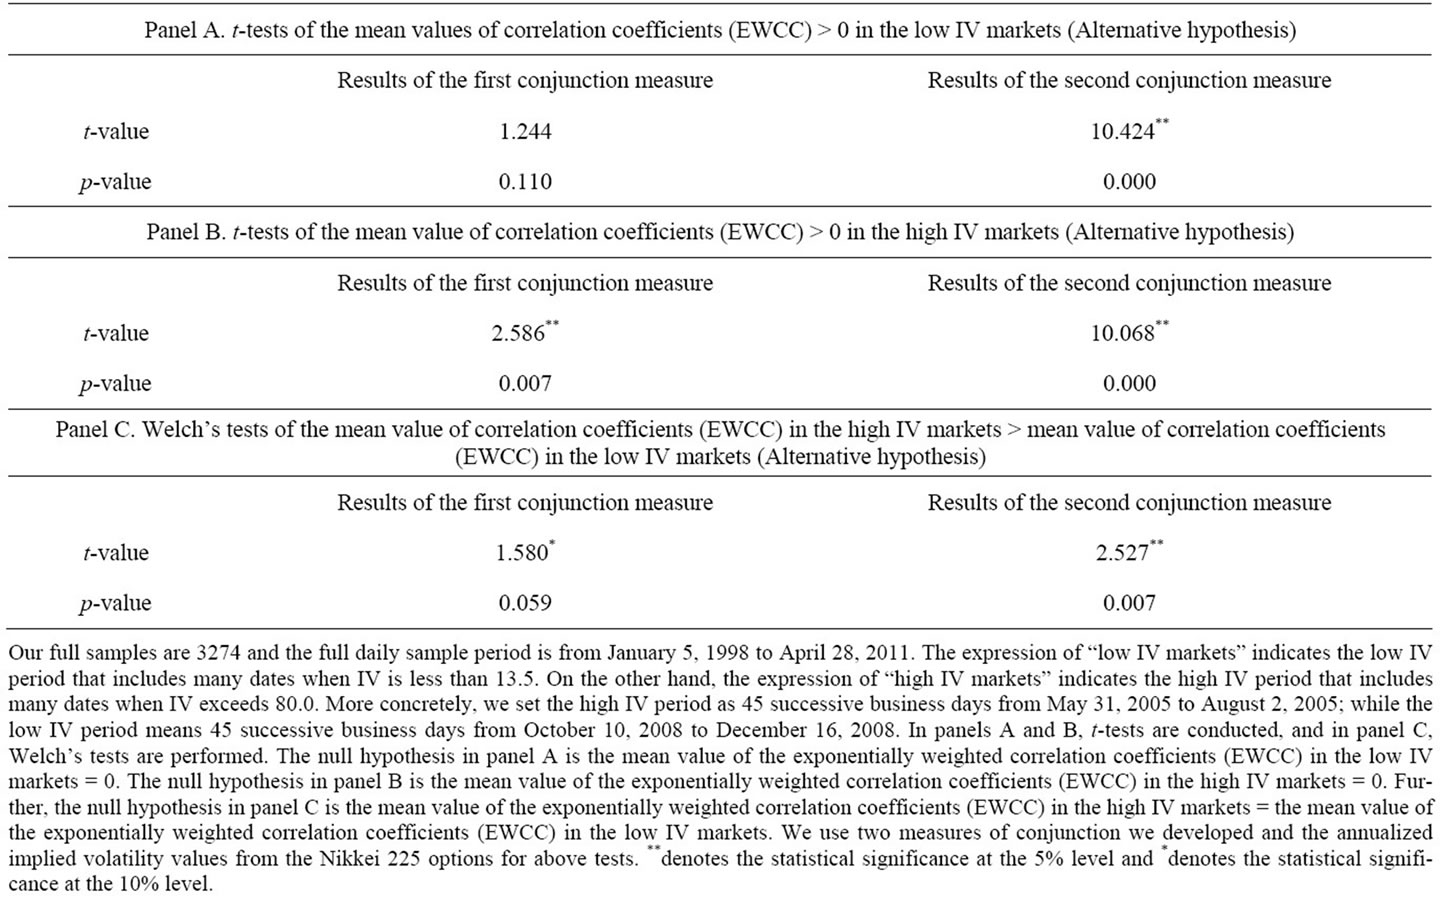
Table 2. Results of t-tests and Welch’s tests of correlation between conjunction measures and implied volatility.
captures the changing correlation of two arbitrary assets without model estimation difficulty.
Furthermore, most importantly, using EWCC and market sentiment measure, IV, we derived novel finding that when market sentiment is deteriorated, stock returns strongly present conjunctional behavior. As above, our new financial tool developments and novel findings demonstrated in this paper will contribute to the body of academic researches of financial economics and financial engineering. We consider that future related works using our developed tools and related data may be also valuable, and these works are our future tasks.
7. Acknowledgements
The author acknowledges the generous financial assistance of the Japan Society for the Promotion of Science. In addition, the author thanks Nick Wade for his kindness to this paper. Furthermore, I greatly appreciate the repeated kind invitation of the Editors to write to this journal.
REFERENCES
- C. M. C. Lee, A. Shleifer and R. H. Thaler, “Investor Sentiment and the Closed-End Fund Puzzle,” Journal of Finance, Vol. 46, No. 1, 1991, pp. 75-109.
- N. Barberis, A. Shleifer and R. Vishny, “A Model of Investor Sentiment,” Journal of Financial Economics, Vol. 49, No. 3, 1998, pp. 307-343. doi:10.1016/S0304-405X(98)00027-0
- R. Neal and S. M. Wheatley, “Do Measures of Investor Sentiment Predict Returns?” Journal of Financial and Quantitative Analysis, Vol. 33, No. 4, 1998, pp. 523-547. doi:10.2307/2331130
- K. Daniel, D. Hirshleifer and A. Subrahmanyam, “Investor Psychology and Security Market Underand Overreactions,” Journal of Finance, Vol. 53, No. 6, 1998, pp. 1839-1885. doi:10.1111/0022-1082.00077
- M. Baker and J. Wurgler, “Investor Sentiment and the Cross-Section of Stock Returns,” Journal of Finance, Vol. 61, No. 4, 2006, pp. 1645-1680. doi:10.1111/j.1540-6261.2006.00885.x
- M. Baker and J. Wurgler, “Investor Sentiment in the Stock Market,” Journal of Economic Perspectives, Vol. 21, No. 2, 2007, pp. 129-151. doi:10.1257/jep.21.2.129
- A. Kurov, “Investor Sentiment and the Stock Market’s Reaction to Monetary Policy,” Journal of Banking & Finance, Vol. 34, No. 1, 2010, pp. 139-149. doi:10.1016/j.jbankfin.2009.07.010
- D. Berger and H. J. Turtle, “Cross-Sectional Performance and Investor Sentiment in a Multiple Risk Factor Model,” Journal of Banking & Finance, Vol. 36, No. 4, 2012, pp. 1107-1121. doi:10.1016/j.jbankfin.2011.11.001
- M. Baker, J. Wurgler and Y. Yuan, “Global, Local, and Contagious Investor Sentiment,” Journal of Financial Economics, forthcoming.
- A. Alimov and W. Mikkelson, “Does Favorable Investor Sentiment Lead to Costly Decisions to Go Public?” Journal of Corporate Finance, forthcoming.
- R. F. Stambaugh, J. Yu and Y. Yuan, “The Short of It: Investor Sentiment and Anomalies,” Journal of Financial Economics, forthcoming.
- J.P.Morgan/Reuters, “RiskMetricsTM—Technical Document,” J.P.Morgan/Reuters, New York, 1996.