Journal of Environmental Protection
Vol. 4 No. 10 (2013) , Article ID: 38678 , 8 pages DOI:10.4236/jep.2013.410133
Health Risk Assessment of Mobility-Related Air Pollution in Ha Noi, Vietnam
![]()
1Research Centre for Environmental Monitoring and Modelling, Vietnam National University, Hanoi, Vietnam; 2Department of Human Ecology, Vrije Universiteit Brussel, Brussels, Belgium; 3Department of Geography, Vrije Universiteit Brussel, Brussels, Belgium; 4Vlaamse Instelling voor Technologisch Onderzoek, Mol, Belgium.
Email: Vu.Van.Hieu@vub.ac.be
Copyright © 2013 Vu Van Hieu et al. This is an open access article distributed under the Creative Commons Attribution License, which permits unrestricted use, distribution, and reproduction in any medium, provided the original work is properly cited.
Received June 19th, 2013; revised July 22nd, 2013; accepted August 25th, 2013
Keywords: Hanoi; HIA; Risk Assessment; Traffic-Related Health Effects
ABSTRACT
Hanoi is the capital city of Vietnam and the second largest city of the country, just behind Ho Chi Minh City. During the last two decades, Hanoi developed fast and expanded steadily. Since the city acquired large parts of the surrounding provinces in 2008, Hanoi tripled its size and doubled its population. The new development aims to spread the concentrated population and economic activities to alleviate the stress caused by pollution and the decreasing quality of life of the residents. Hanoi has a very fast growing fleet of motor vehicles, at the rate of 12% - 15% annually. The fast transition from bikes to motorcycles and to cars results in a most serious environmental burden in particular on the air quality and human health. This paper overviews the air quality and pollution caused by road traffic in central Hanoi (5 old districts) and the related health outcomes due to particulate matters (PM10 and PM2.5). It uses dose-response functions to quantify the number of extra deaths resulting from traffic-related particulate matters. The results are compared with those of other studies to assess the impacts of air pollution on human health in large, crowded and fast developing cities in Southeast Asia. Assessment of the health risk caused by traffic shows that mobility in Hanoi causes a high health burden. In 2009, mobility caused 3200 extra deaths by traffic related PM10. The result shows that health impacts due to air pollution are by far larger than the number of fatalities due to traffic accidents.
1. Introduction
Hanoi is the capital of Vietnam and the second largest city of the country, just behind Ho Chi Minh City. During the last two decades, Hanoi developed fast and expanded steadily. Hanoi changed its boundaries 4 times in 1961, 1978, 1991 and 2008. After the last boundary modification, Hanoi covers the total area of 3348.5 km2; has a population of 6.45 million people with an average density of 1926 people/km2, distributed over 27 districts (9 urban and 18 rural) and 408 communes (as of 31 December 2008) [1].
Hanoi experienced a 11.7‰ population growth a year in 2000, which increased to 11.8‰ in 2005, 12.5‰ in 2008 and 12. 7‰ in 2009. The city is characterised by a fast urbanisation rate, achieving 5.6%/year during the period 2001-2005 but reduced to 3% during the period 2006-2009. By 2009, the urban area was 40.8%, an increase from 33.2% in 2000. Urban population accounts for around 41.3% of the total [1-3]. In 2006, Hanoi had an unemployment rate of 6.1%, which reduced to 5.4% in 2008. The city has about 3974 km of roads, of which 643 km within the 9 old districts (that account for 6.8% of the urban area).
Since the city acquired a large part of its surroundings in 2008, Hanoi tripled its size and doubled its population. The new development aims to spread the concentrated population and economic activities to the newly acquired areas to alleviate the stress currently put on the environment due to air, noise and water pollution and the decreasing quality of life of the residents. Hanoi is a highly polluted city as a result of the dense traffic and the industry that is still localised in the inner city.
Hanoi has a very fast growing fleet of motor vehicles, at the rate of 12% - 15% annually. Both cars and motorcycles grow rapidly. In 2000, around 46,200 cars/trucks circulated in the city, accounted for 9.5% of the country’s total vehicle fleet. Its 865,232 motorcycles comprise 12.38% of the country’s motorcycle fleet [3]. By the end of 2009, there are more than 2.76 million motorcycles in circulation. The number of cars doubled during the period 2005-2009, raising from nearly 150,000 cars in 2005 to more than 304,000 in 2009 [4]. The fast transition from bikes to motorcycles (since the middle of the 1990s) and to cars (since the late 1990s) results in a most serious environmental burden in particular on the air quality and the associated human health impacts.
Motorised mobility is a major source of air pollution. Studies in large cities in developing countries such as New Dehli, Bangkok, Beijing, Manila and Jakarta show a 40% - 80% contribution of vehicles to the total concentration of particulate matters [5-12]. Particulate matter (especially PM10) and their effects on human health have been the subject of many epidemiological studies and reviews. The results consistently show that 24-hr average concentrations of particulate matters are related to daily mortality and daily hospital admissions [13-18]. Chronic exposure to PM10 is also linked to mortality [18-23].
In Vietnam, studies on health impacts of air pollution have been done recently in selected major cities, such as Ho Chi Minh City, Ha Noi and Hai Phong. Nguyen [24] studied the impacts of air pollution on human health in Hanoi using published dose-response functions to calculate long-term health impacts of Total Suspended Particles (TSPs) using air quality data for the period 1994- 1998. Most of the other recent studies use health surveys as the main method to assess the health effects on the population. These health surveys are based on the presence/absence of chronic obstructive pulmonary diseases (COPDs) and respiratory diseases.
This paper overviews the air quality and pollution caused by road traffic in central Hanoi (5 old districts) and the related health outcomes due to particulate matters. It uses dose-response functions to quantify the number of extra deaths resulting from traffic-related air pollution. The results are compared with those of other studies to assess the impacts of air pollution on human health in large, crowded and fast developing cities like Hanoi.
2. Materials and Methods
2.1. Air Monitoring
Air quality monitoring data were obtained from the Environmental Monitoring Centre of the National Environmental Agency. They include information of air pollutants (CO, SO2, NO2 and TSP) and noise, measured quarterly during the period 2005-2009 at 5 monitoring locations. Figure 1 shows the geographical distribution of the monitoring stations. They are located in a way that the data provide a fair idea of the average pollutant concentrations 5 districts downtown Hanoi, which are Ba Dinh, Dong Da, Hai Ba Trung, Hoan Kiem and Thanh Xuan.
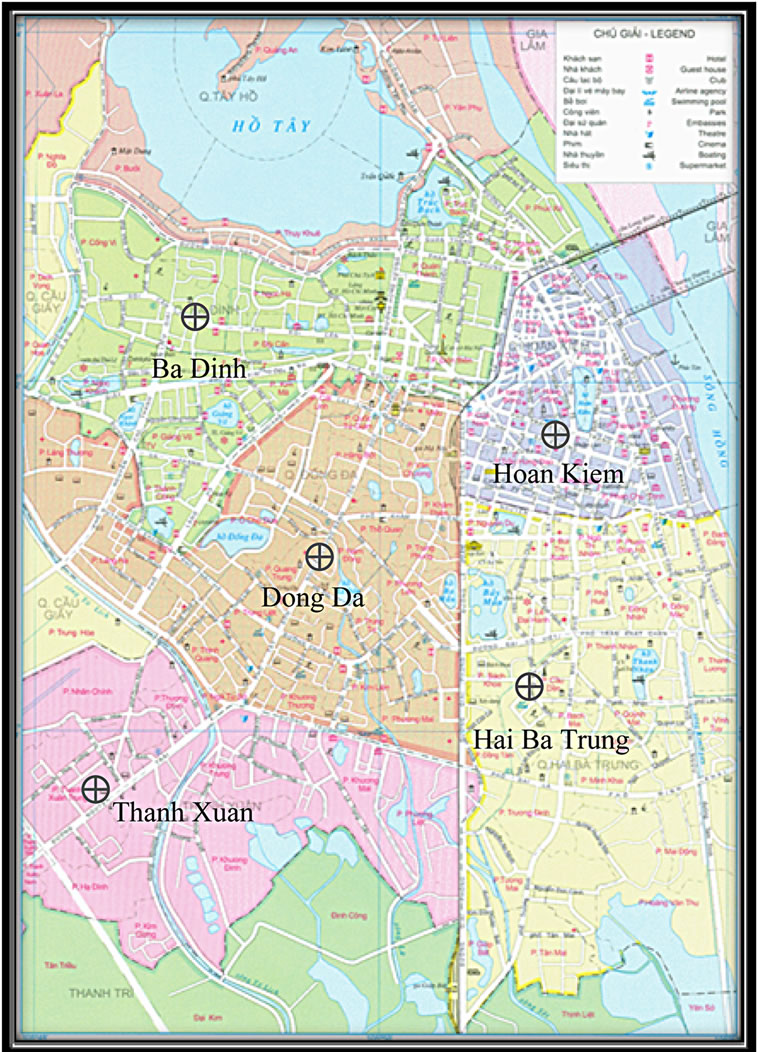
Figure 1. Map of monitoring locations.
2.2. Health Risk Assessment
Health risk assessment using the classic 4-step paradigm:
• Hazard Identification has been done based on literature review and ground-checked through a health survey. Health impacts of various air pollutants, especially PM, benzene, and ground level ozone have been extensively described [5,6,17,19-23,25-34]. Most of the epidemiological evidence points to the link between exposure to air pollutants and respiratory and cardio-vascular diseases, such acute upper respiratory infections (acute pharyngitis, acute tonsillitis, acute laryngitis and tracheitis, etc.), influenza and pneumonia, acute bronchitis and bronchiolitis, and primary hypertension. In this study, the mortality effect of PM10 and the morbidity effects of PM2.5 will be considered.
• Exposure assessment: due to insufficient data (such as detailed population density data, air quality values for small unit, and population activities indoor-outdoor, etc.), it is supposed that the whole of the population in the 5 assessed districts of Hanoi exposed to the same level of outdoor air pollution. The annual concentration of the monitoring station for the period 2005- 2009 was used.
• Dose-Response assessment follows the dose-response function for PM10 established by prior research that has been published [18,20,22,23]. These data shown an increase in mortality of 4.3% per 10 µg/m3 increase in PM10 (Table 1).
• Risk characterisation was assessed based on the number of extra cases of health outcome linked to trafficattributable air pollution.
For PM2.5, the number of restricted-activity days were calculated as proposed by Fisher et al. [23] at 9.1 cases per 100 persons per 1 μg/m3 annual PM2.5. The formula for calculation is:
 (1)
(1)
where NRAD is the number of restricted-activity days; EPM2.5 is the annual concentration of PM2.5 and Pexp is the exposed population. The number of restricted-activity days experienced by an individual in the course of a year is an important measure of functional well-being. The definition of “restricted-activity days” is the average annual number of days a person experienced at least one of the following: 1) a bed day, during which a person stayed in bed more than half a day because of illness or injury related to traffic; 2) a work-loss day, on which a currently employed person missed more than half a day from a job or business; 3) a school loss day, on which a student 5 - 17 years of age missed more than half a day from the school in which he or she was currently enrolled; or 4) a cut-down day, on which a person cuts down for more than half a day on things he usually does.
For PM10, the number of extra deaths was calculated using the formula [20] that allows to calculate the longterm impact of PM10 on mortality within the group aged over 30 years old:
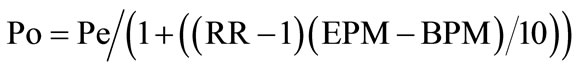 (2)
(2)
where:
- Po = baseline mortality per 1000 in the age group 30+, after deducting the air pollution effect (this will depend on the other variables).
- Pe = crude mortality rate per 1000 in the age group 30+. Due to the lack of specific data, the crude mortality rate for whole population of each assessed district will be used. Data comes from Vietnam General Statistical Office [2].
- EPM = PM10 exposure level in the area of interest (μg/m3).
- BPM = threshold PM10 exposure level for mortality
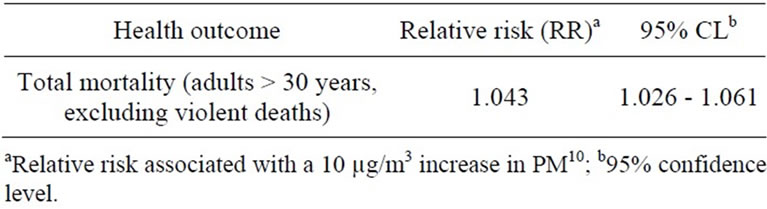
Table 1. Dose-response relationship used in [20].
effect. In this study, with an assumed threshold for PM10 at 7.5 [23].
- RR = epidemiologically derived relative risk for a 10 μg/m3 increment of PM10, assuming a linear dose-response relationship above the threshold (B) for the age group 30+.
The increased mortality is calculated using the following formula:
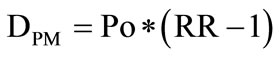 (3)
(3)
where: DPM = number of additional deaths per 1,000 people in the age group 30+ for a 10 μg/m3.
The number of deaths due to PM10 is calculated as follows:
 (4)
(4)
where: P30+ is the population over 30-years old (47.1% of the total population of Hanoi according to the 2009 Nationwide Population Survey and Population Projection until 2050)
3. Results
3.1. Air Quality
According to the Vietnamese National Environmental Agency, in Hanoi, the fleet of motor vehicles increases at the rate of 12% - 15% per year. Both the number of cars and of motorcycles increases rapidly. By the end of 2009, it is estimated that there are more than 2.76 million motorcycles in circulation.
The vehicle inventory for Hanoi done by the authors in 2011 shows that, by the end of April 2010, Hanoi traffic is dominated by motorcycles with more than 3.6 million units in operation. There are nearly 160 thousand cars and nearly 68 thousand trucks. 94% of the vehicle pool in Hanoi are motorcycles.
Motorcycles produce the most VOC for each kilometer travelled. They emit ten times more VOCs than a car and 1.5 times more than a bus [33]. The motorcycle fleet also emits more CO. As its capacity is lower than this of a car and much lower than this of a bus, consequently, the pollution level per passenger kilometre is the highest of all motorised traffic. Therefore, as the preferred mode of transport, accounts for 94% of the fleet, and around 85% of the total road length travelled (Table 2), motorcycles are the main source of air pollutant emissions in Hanoi city.
Cars become gradually more popular in Hanoi. Their number has nearly doubled between 2005 and 2009 (from 149,333 units in 2005 to 304,143 units in 2009) [4].
Based on the number of vehicles in circulation, pollution emissions can be assessed. Table 2 shows the estimation of air pollution emissions from motorised traffic sources in Hanoi.
Table 2 also shows that motorcycles contribute the most to the total traffic emissions. They account for over 70% of the total TSP emissions and more than 95% of the total VOC emissions.
Hanoi has 5 air quality monitoring stations that were in operation during the period 2007-2009. Average annual air quality data at the stations is presented in Table 3.
In 2003, daily monitoring data for 365 days show that there were 359 days with PM10 concentration over 250 g/m3 [35]. Monitoring results show that the daily concentrations of PM10 fluctuate with a large difference between day-time and night-time concentrations. During peak hours (around 8 am and 6 pm), the concentrations of PM10, CO and NO2 are highest, showing the impacts of the traffic on air quality. While during night-time (9 pm to 5 am next day), PM10 concentration is mostly below the standards (QCVN 05:2009), concentrations during the day are 2 to 3 times higher than the standard [36].
The annual average concentrations of PM10 are higher than the standards for 3 consecutive years in 2007, 2008 and 2009. For NO2 and SO2, hourly concentrations are within the permissible levels but daily concentrations are higher than the standards.
3.2. Health Effects
In this study, the mortality attributed to PM10 and the morbidity of PM2.5 are assessed. As for the mortality, the results provide a figure on additional (or extra) deaths caused by the increased of the concentrations of PM10. The increased mortality due to PM10 exposure for the group over 30-years is presented in Table 4. Only the urban sections of Hanoi are taken into account in the calculation for area and population.
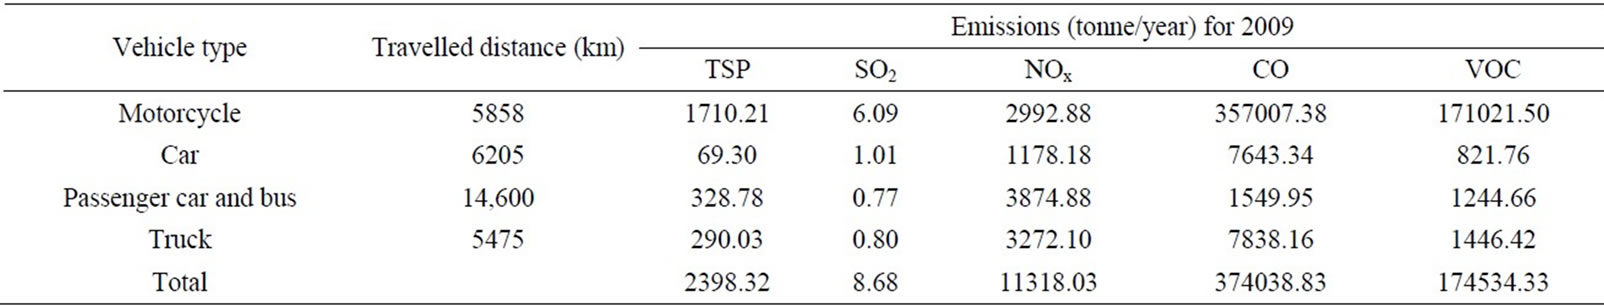
Table 2. Emission by vehicle types in Hanoi.
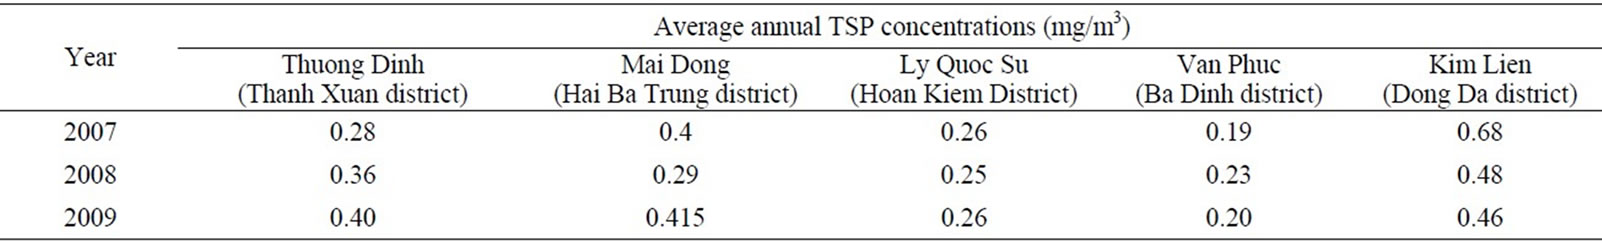
Table 3. Annual concentration of dust (TSP) in Hanoi at five monitoring stations.
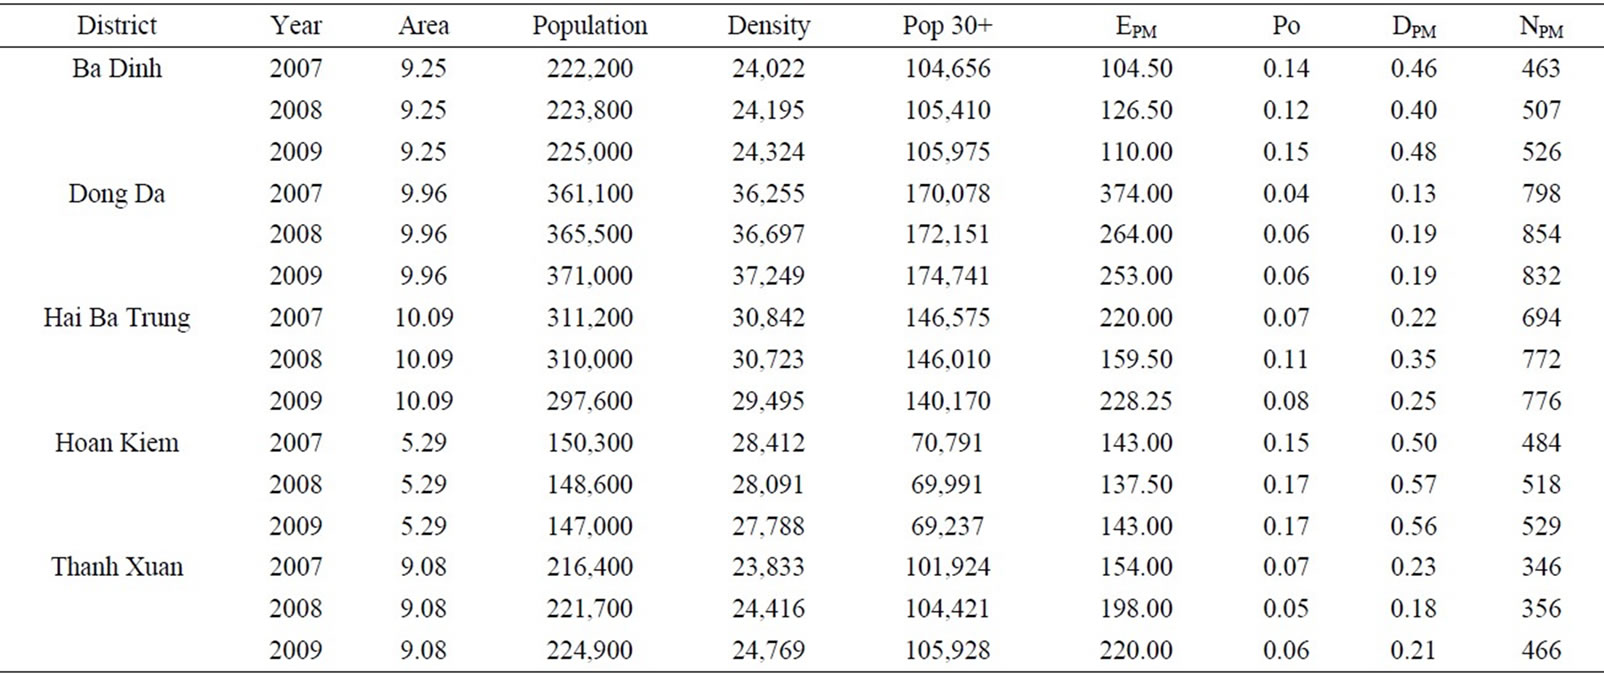
Table 4. Absolute mortality due to PM10 in the period 2007-2009.
The concentrations of PM10 are calculated based on the monitored concentration of TSP (Table 3). As all monitoring points are located next to streets and are designnated as traffic air pollution monitoring stations, the concentrations of TSP are considered 100% traffic-attributable. The average annual concentration of PM10 is estimated at 55% of the average annual concentration of TSP (which is the average across all monitoring points) [37].
The results (NPM) indicate the absolute increase in mortality and not the adjusted values reflecting the year-lifelost. At the annual threshold of 7.5 µg/m3, the estimated number of people dying by non-external causes that may be associated with traffic air pollution is 2785 in 2007, 3007 in 2008 and 3129 in 2009. Table 4 shows that the mortality due to PM10 has been increased slightly during the period 2007-2009. Amongst the 5 assessed districts, Dong Da has the highest tolls even though it has the lowest number of additional deaths per 1000 people in the age group 30+ for each increment of 10 μg/m3 (DPM). This is because it has the worst air quality index. Thanh Xuan has the lowest tolls although it is not the district with the best air quality, thanks mostly to its low crude death rate, which could be the result of younger population overall.
For morbidity, the total number of restricted-activity days due to PM2.5 exposure was calculated and presented in Table 5. The calculation assumed that PM2.5 effect on morbidity has no threshold (or threshold is 0). As there is no measurement for PM2.5 concentration, the fraction of 0.7 was applied on the concentration of PM10 to calculate the concentration of PM2.5, as suggested by Medina et al. [22].
Table 5 shows that annually, each person in Hanoi City loses around 14 days in 2007, 12 days in 2008 and 13 days in 2009 due to PM2.5 pollution. People in Dong Da District lost the most days due to air pollution and people in Ba Dinh District lost the least.
4. Discussion
In Hanoi, the economic development and fast urbanisation are associated with a very fast increase in the vehicle fleet, with an annual growth of about 11% in the number of cars and 15% in the number of motorcycles. The average trip per person per day for Hanoi in 2005 was 2.7 with a average daily travelled distance of 20 - 25 km, which is much higher than other countries in the region.
Traffic contributes largely to the air pollution in the city and accounts for about 70% of the total pollution. TSP/PM10 in all measurements and monitoring points is higher than the Vietnamese standards and much higher than the level that has impacts on health. Concentrations of other pollutants such as SO2, NOx, and CO are in general lower than the annual standard but sometimes exceeds daily standards. Moreover, variations are noticed during the day. Concentrations of pollutants during the morning and afternoon peak hours are always 1.5 to 5 times above the hourly standards. This corresponds with the peak number of vehicles in circulation and frequent congestions on many streets in Hanoi.
Calculation of the health risk caused by traffic shows that mobility in Hanoi causes a high health burden. In 2009, mobility caused more than 3000 extra deaths by traffic related PM10.
Table 6 shows that health impacts due to air pollution is by far larger than the number of fatalities due to traffic accidents. The combination of mortality due to traffic accidents and due to air pollution is called “traffic road toll” [20]. In Hanoi, this “road-tolls” is much higher than other countries [20,23,38].
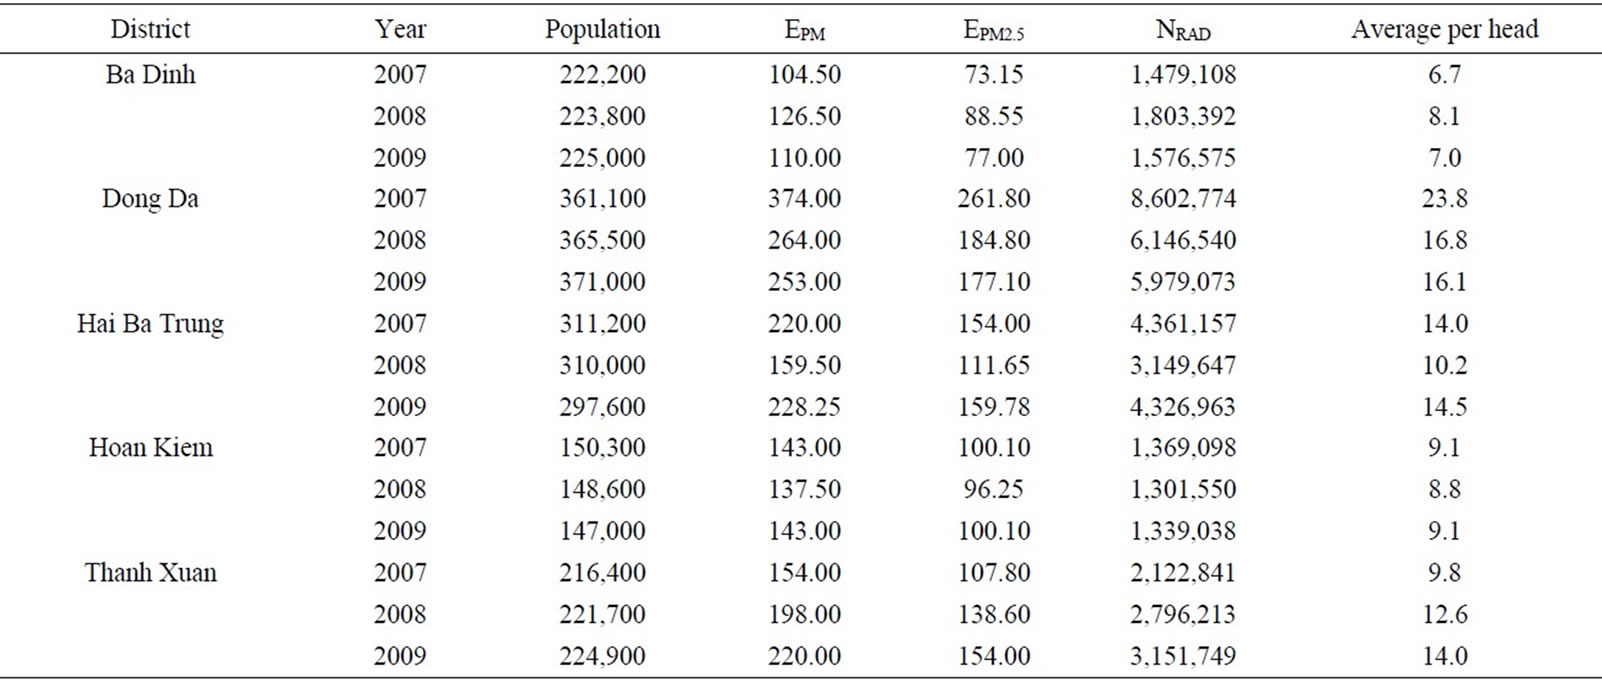
Table 5. Evolution of the number of restricted-activity days during PM2.5 over the period 2008-2009.
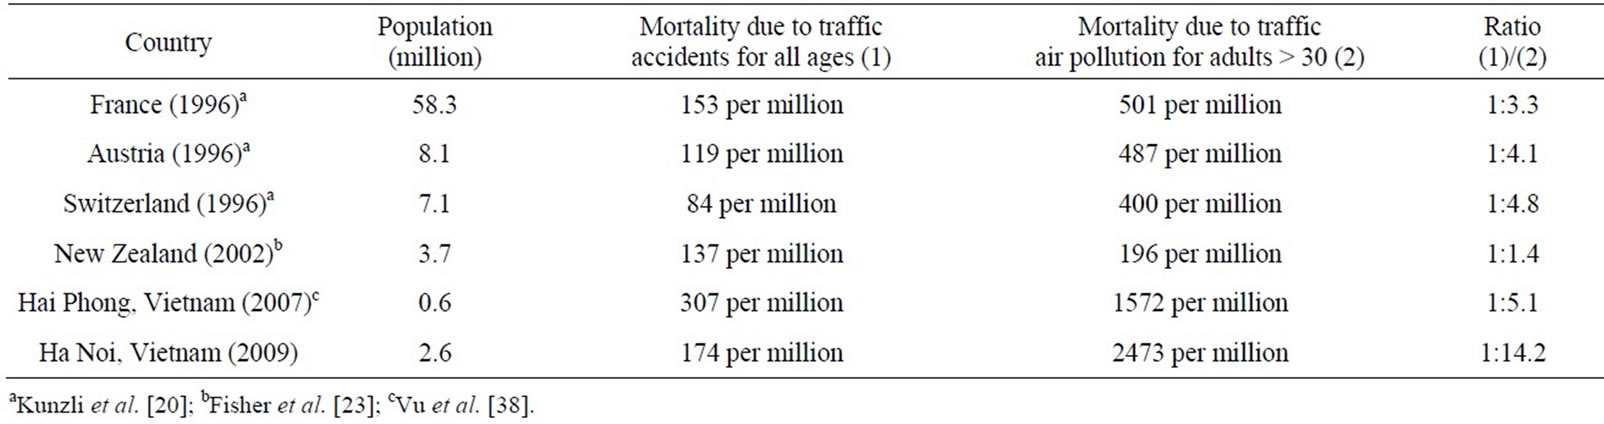
Table 6. Total mortality due to traffic accident and air pollution.
However, there are several uncertainties in this study. First of all, time-series data on health impacts of air pollution is not available in Vietnam. The use of dose-response functions from other studies worldwide may show discrepancies while applying them to the situation in Hanoi. As dose-response relationships can vary from population to population, specific dose-response relationships for Vietnam are necessitated in future studies.
Also, there is no division between mortality due to fine and ultrafine particulates as the current study on the impact of PM2.5 on mortality was not available to be applied in Hanoi. Increasing evidence points to the direction that PM2.5 is actually the culprit behind mortality due to particulate matter. Therefore, the higher the proportion of PM2.5, the higher mortality will be. From this point of view, current estimate on mortality is conservative.
In addition, exposure to different air pollutants is simplified in this study, due to the lack of monitoring data as well as a reliable air quality modelling methods that allow to accurately calculate the number of people exposed to different levels of pollution by individual air pollutants. This necessitates further studies on air quality and air pollution exposure for Hanoi.
It is worthy to note that the results are indicative, as PM was chosen as the representative pollutant. Other pollutants also contribute to different health effects, such as increase in hospitalisation due to air pollutants (NOx, SO2, VOC) or mental health issues due to noise and traffic disturbances. Those health effects cannot be included in the scope of this paper.
5. Acknowledgements
The authors wish to thank the colleagues at the Research Centre for Environmental Monitoring and Modelling (CEMM) for their help with data collection and treatment. This research was performed as part of the PhD research on “Integrating Environmental Modelling and Geographic Information System in Environmental Health Impact Assessment of Transport and Mobility development in Hai Phong, Vietnam”, funded by the Flemish Interuniversity Council (VLIR), Belgium.
REFERENCES
- Hanoi Statistical Office, “Statistical Year Books of Hanoi 2000-2009,” Hanoi, 2010.
- Vietnam General Statistical Office, “Vietnam Nationalwide Population Survey 2009,” 2011. http://www.gso.gov.vn
- Vietnam Register, “Integrated Action Plan to Reduce Vehicle Emissions in Viet Nam,” 2002. http://www.adb.org/documents/others/Reduce_Vehicle_Emissions_VIE/Reduce_Vehicle_Emissions.pdf
- Vietnam Register, “Data on the Vehicle Fleet in Hanoi,” Hanoi, 2011.
- N. Bruce, R. Perez-Padilla and R. Albalak, “Indoor Air Pollution in Developing Countries: A Major Environmental and Public Health Challenge,” Bulletin of the World Health Organization, Vol. 78, No. 9, 2000, pp. 1078-1092.
- N. Bruce, R. Perez-Padilla and R. Albalak, “The Health Effects of Indoor Air Pollution Exposure in Developing Countries,” WHO, Geneva, 2002.
- S. Syahril, B. P. Resosudarmo and H. S. Tomo, “Study on Air Quality of Jakarta, Indonesia: Future Trends, Health Impacts, Economic Value and Policy Options,” ADB, Jakarta, 2002.
- M. Walsh, “Contribution of Vehicles to Overall Air Pollution in Asia,” ADB, Manila, 2002.
- World Health Organization, “The World Health Report 2002: Reducing Risks, Promoting Healthy Life,” Geneva, 2002.
- H. Kan and B. Chen “Particulate Air Pollution in Urban Areas of Shanghai, China: Health-Based Economic Assessment,” Science of the Total Environment, Vol. 322, No. 1-3, 2004, pp. 71-79. http://dx.doi.org/10.1016/j.scitotenv.2003.09.010
- S. Cheng, D. Chen, J. Li, H. Wang and X. Guo, “The Assessment of Emission-Source Contributions to Air Quality by Using a Coupled MM5-ARPS-CMAQ Modeling System: A Case Study in the Beijing Metropolitan Region, China,” Environmental Modelling & Software, Vol. 22, No. 11, 2007, pp. 1601-1616. http://dx.doi.org/10.1016/j.envsoft.2006.11.003
- A. Sagar, M. Bhattacharya and V. A. Joon, “Comparative Study of Air Pollution-Related Morbidity among Exposed Population of Delhi,” Indian Journal of Community Medicine, Vol. 32, No. 4, 2007, pp. 268-271. http://dx.doi.org/10.4103/0970-0218.37692
- D. W. Dockery, C. A. Pope III, X. Xu, J. D. Spengler, J. H. Ware, M. E. Fay, B. G. Ferris Jr. and F. E. Speizer, “An Association between Air Pollution and Mortality in Six US Cities,” The New England Journal of Medicine, Vol. 329, No. 24, 1993, pp. 1753-1759. http://dx.doi.org/10.1056/NEJM199312093292401
- C. A. Pope III, D. W. Dockery and J. Schwartz, “Review of Epidemiological Evidence of Health Effects of Particulate Air Pollution,” Inhalation Toxicology, Vol. 7, No. 1, 1995, pp. 1-18. http://dx.doi.org/10.3109/08958379509014267
- C. A. Pope III, R. T. Burnett, M. J. Thun, E. E. Calle, D. Krewski, K. Ito and G. D. Thurston, “Lung Cancer, Cardiopulmonary Mortality, and Long-Term Exposure to Fine Particulate Air Pollution,” Journal of the American Medical Association, Vol. 287, No. 9, 2002, pp. 1132- 1141. http://dx.doi.org/10.1001/jama.287.9.1132
- World Health Organization, “Health Aspects of Air Pollution with Particulate Matter, Ozone and Nitrogen Dioxide,” Bonn, 2003.
- H. R. Anderson, R. W. Atkinson, J. L. Peacock, L. Marston and K. Konstantinou, “Meta-Analysis of Time-Series Studies and Panel Studies of Particulate Matter (PM) and Ozone (O3),” World Health Organization, London, 2004.
- G. Fisher, T. Kjellstrom, S. Kingham, S. Hales and R. Shrestha, “Health and Air Pollution in New Zealand: Main Report,” Health Research Council of New Zealand, Ministry for the Environment and Ministry of Transport, Wellington, 2007.
- F. Ballester, “Air Pollution and Health: An Overview with Some Case Studies,” In: P. Nicolopoulou-Stamati, L. Hens and C. V. Howard, Eds., Environmental Health Impacts of Transport and Mobility, Springer, Dordrecht, 2005, pp. 53-79. http://dx.doi.org/10.1007/1-4020-4307-4_5
- N. Künzli, R. Kaiser, S. Medina, M. Studnicka, O. Chanel, P. Filliger, M. Herry, F. Horak, V. Puybonnieux-Texier, P. Quénel, J. Schneider, R. Seethaler, J. C. Vergnaud and H. Sommer, “Public-Health Impact of Outdoor and TrafficRelated Air Pollution: A European Assessment,” The Lancet, Vol. 356, No. 9232, 2000, pp. 795-801. http://dx.doi.org/10.1016/S0140-6736(00)02653-2
- A. Le Tertre, S. Medina, E. Samoli, B. Forsberg, P. Michelozzi, A. Boumghar, J. M. Vonk, A. Bellini, R. Atkinson, J. G. Ayres, J. Sunyer, J. Schwartz and K. Katsouyanni, “Short-Term Effects of Particulate Air Pollution on Cardiovascular Diseases in Eight European Cities,” Journal of Epidemiology and Community Health, Vol. 56, No. 10, 2002, pp. 773-779. http://dx.doi.org/10.1136/jech.56.10.773
- S. Medina, E. Boldo, M. Saklad, E. M. Niciu, M. Krzyzanowski, F. Frank, K. Cambra, H. G. Muecke, B. Zorilla, R. Atkinson, A. Le Tertre and B. Forsberg, “APHEIS Health Impact Assement of Air Pollution and Communications Strategy,” Institut de Veille Sanitaire, Saint-Maurice, 2005. http://www.apheis.net/vfbisnvsApheis.pdf
- G. W. Fisher, K. A. Rolfe, T. Kjellstrom, A. Woodward, S. Hales, A. P. Sturman, S. Kingham, J. Petersen, R. Shrestha and D. King, “Health Effects Due to Motor Vehicle Air Pollution in New Zealand,” New Zealand Ministry of Transport, 2002.
- T. S. Nguyen, “Assessing Long-Term Effect of Outdoor Dust Pollution on the Population of Hanoi (Lượng giá ảnh hưởng mạn tính của ô nhiễm bụi trong không khí ngoài trời đối với sức khoẻ của dân cư nội thành Hà Nội),” Journal of Practical Medicine (Y học thực hành), Vol. 396, No. 4, 2001, pp. 8-10. (In Vietnamese)
- P. Babisch, “Traffic, Noise and Health,” In: P. Nicolopoulou-Stamati, L. Hens and C. V. Howard, Eds., Environmental Health Impacts of Transport and Mobility, Springer, Dordrecht, 2005, pp. 9-25.
- N. Janssen and E. Sanderson, “Air Pollution and the Risks to Human Health—Exposure Assessment,” AIRNET Work Group 1: Exposure Assessment, 2004. http://airnet.iras.uu.nl/
- K. Katsouyianni, “Ambient Air Pollution and Health,” British Medical Bulletin, Vol. 68, No. 1, 2003, pp. 143- 156. http://dx.doi.org/10.1093/bmb/ldg028
- P. Nicolopoulou-Stamati, L. Hens, P. Lammar and C. V. Howard, “Effects of Mobility on Health—An Overview,” In: P. Nicolopoulou-Stamati, L. Hens and C. V. Howard, Eds., Environmental Health Impacts of Transport and Mobility, Springer, Dordrecht, 2005, pp. 277-309. http://dx.doi.org/10.1007/1-4020-4307-4_18
- A. Prüss-Ustün, C. Mathers, C. Corvalán and A. Woodward, “Introduction and Methods: Assessing the Environmental Burden of Disease at National and Local Levels,” World Health Organization, Geneva, 2003.
- T. Roussou and P. Behrakis, “The Respiratory Effects of Air Pollution,” In: P. Nicolopoulou-Stamati, L. Hens and C. V. Howard, Eds., Environmental Health Impacts of Transport and Mobility, Springer, Dordrecht, 2005, pp. 79-95. http://dx.doi.org/10.1007/1-4020-4307-4_6
- E. Sanderson and F. Hurley, “Air Pollution and the Risks to Human Health—Health Impact Assessment,” AIRNET Work Group 4—Risk and Health Impact Assessment, 2003. http://airnet.iras.uu.nl/
- World Health Organization, “Transport, Environment and Health,” 2007. http://wwweurowhoint/document/e72015pdf
- World Health Organization, “Health Aspects of Transport Related Air Pollution,” WHO, Copenhagen, 2005.
- World Health Organization, “Health Aspects & Risks of Transport Systems: The HEARTS Project,” WHO, Copenhagen, 2006.
- Center for Environmental Engineering of Towns and Industrial Areas, Hanoi University of Civil Engineering, “Environmental Monitoring Data 2007,” Hanoi, 2007.
- Minister of Transport of Vietnam, “Report on the Health Impacts of Air Pollution and Related Economical Impacts between 2007-2009 and Future Predictions for Hanoi and Ho Chi Minh Cities,” Hanoi, 2010.
- J. Dixon, L. Scura, R. Carpenter and P. Sherman, “Economic Analysis of Environmental Impacts,” 2nd Edition, EarthScan, London, 1994.
- V. H. Vu, X. Q. Le, P. N. Ho and L. Hens, “Health Impact Assessment for Traffic Pollution (Particulate Matters) for Hai Phong City, Vietnam,” In: V. Bhasin and C. Susanne, Eds., Anthropology Today: Trends and Scope of Human Ecology, Anthropologist Special Volume, No. 5, 2010, pp. 67-76.