Journal of Environmental Protection
Vol. 4 No. 7A (2013) , Article ID: 34843 , 12 pages DOI:10.4236/jep.2013.47A015
Linking Numerical Water Quality Models in an Environmental Information System for Integrated Environmental Assessments
![]()
1Department of Postgraduates Studies, Mexican Petroleum Institute, Mexico City, Mexico; 2Environmental Informatics Group (EIG), Saarbrücken, Germany; 3Cismet GmbH, Saarbrücken, Germany.
Email: Franklin Torres-Bejarano frantb13@gmail.com
Copyright © 2013 Franklin Torres-Bejarano et al. This is an open access article distributed under the Creative Commons Attribution License, which permits unrestricted use, distribution, and reproduction in any medium, provided the original work is properly cited.
Received May 30th, 2013; revised June 30th, 2013; accepted July 8th, 2013
Keywords: Environmental Information Systems; Environmental Decision Support Systems; Water Quality Modeling; Integrated Modeling
ABSTRACT
Decision makers involved in prevention of water contamination often lack the technical knowledge of water quality evaluation or the comprehension of complex software for environmental information management required to make effective decisions. Providing information about the environment is not an easy task due to its complex structure, relationships, and dynamic processes. Because environmental models play an important role in environmental decision support systems, the integration of models into user-friendly integrated information systems is a key factor in the support of such users. This paper presents an environmental information system which supports water protection of Coatzacoalcos River in Mexico, having as a main building block water quality assessments supported by mathematical modeling through the two-dimensional Saint Venant and Advection-Diffusion-Reaction equations to calculate the river hydrodynamics and the contaminant transport, respectively. The mathematical modeling solution yields appropriate results representing the river contaminant distribution when compared with field measurements. But the direct use of these models by decision makers is difficult at best, meaning they are not likely to be used in making practical decisions. The system described in this paper integrates these models, and several other tools, into a seamless, user-centered application, improving model usability, initial configuration, and results visualization.
1. Introduction
Numerical models are often applied in integrated environmental assessments, an emerging discipline and process that aims to address the demands of decision makers for tools to support environmental management which include ecological, social, and economic considerations [1,2]. This necessitates the integration of mathematical models in a modern Environmental information System (EIS) to evaluate the characteristics and phenomena in the different environmental components (e.g. hydrology, hydrodynamics, water quality, etc.). Integration of these models into environmental information systems is essential so that they become tools that provide a better understanding of contamination problems and help in ecosystem control and remediation through a satisfactory and adequate decision-making process. Such integration provides the ability to consider a larger number of environmental variables and to extend their application at scales ranging from local to regional, where in some cases several ecosystems interact [3-5]. The integrated management of aquatic resources is an important component of environmental preservation and economic development [6]. A variety of software and modeling technologies is emerging in the form of “support tools” to better support the use of scientific knowledge in environmental research, policy development, and planning activities [7].
Environmental Information Systems (EIS) are complex systems which often require the integration of such technologies as database systems, mathematical models, GIS, image processing, or expert systems [8], interacting with the common goal of supporting the user in the process of decision-making, control application and restoration measures for environmental impact mitigation (Figure 1).
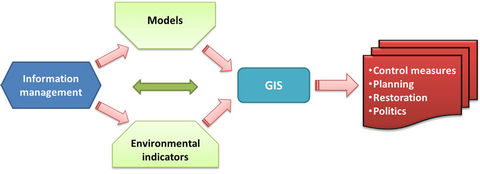
Figure 1. Main components of EIS.
EIS Applied to River Water Quality Assessments
Development of decision support systems for integrated water resources management supports improved management on the level of both small and large watersheds. The general concern about water quality and water supply problems is evident. That is why the design and implementation of EISs integrating water quality models has grown in the last several years, and a wide variety of examples can be found worldwide [9-16].
In this work, applied to Coatzacoalcos River, Mexico, the different components of the environmental informatics are integrated in one single tool (Figure 1), being the main part of the study the water quality modeling. A main building block of the present work, water quality assessment supported by mathematical modeling of hydrodynamics and contaminant transport, has been built into an EIS integrating modern technologies such as spatial and aspatial databases, GIS capabilities, mathematical modeling, and other modern technologies. Mathematical modeling allows prediction of an expected future state, and thus is an important part of informed decision making in natural resources management. The main attribute of this tool is its adaptability to the study zone to evaluate the river water quality for different scenarios and applications. Making decisions does not require total accuracy, but is greatly enhanced if the accuracy of the scientific results used is known and incorporated in the decision-making process. This means that the models incorporated must be properly validated [12].
For validation purposes, data from a sampling and measurement campaign were stored in the system database, including all the parameters solved by the numerical model. The information obtained through direct measurements and chemical analysis is primarily used for testing and validates the numerical model. Details of this process have been reported by [17].
2. Study Zone: The Coatzacoalcos River
The Coatzacoalcos River begins at an altitude of over 2000 m and drains an area of approximately 21,210 km2. With a length of 322 km, it moves to the northeast and flows into the Gulf of Mexico, adjacent to the town and port carrying the same name. Its watershed represents 1.2% of the total area of Mexico and includes 32 municipalities (Figure 2).
Water Quality Problem
The last stretch of the Coatzacoalcos River, located in the Minatitlan-Coatzacoalcos Industrial Park (MCIP) and with a length of about 40 km, is part of an area of vast natural diversity, where the high population concentration creates important environmental challenges due to pressures arising mainly from consumption and industrial activities. Currently, insufficient information exists for MCIP regarding the water quality in this stretch of the river. In addition, the information that does exist is either unavailable to the public or is too dispersed to be readily discovered.
In this area the largest and most concentrated industrial chemical and petrochemical complex in Latin America has been developed. The dark polygons shown in Figure 2 represent the industrial and petrochemical facilities located in the area. This is one of the most polluted rivers in Mexico and is consequently a critical area in terms of industrial pollution.
3. The Numerical Model
The integrated model includes numerical hydrodynamic and water quality models written in FORTRAN, and the ensemble is named ANAITE/2D [17,18]. The current version of this model solves the Saint Venant equations for hydrodynamics representation and the Advection-Diffusion-Reaction (A-D-R) equation using a two-dimensional approach to simulate the pollutant’s fate.
3.1. The Hydrodynamic Model
The hydrodynamics are simulated by the application of
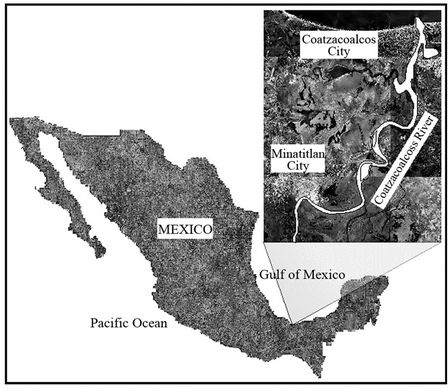
Figure 2. Coatzacoalcos River and study zone.
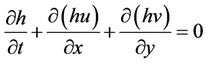
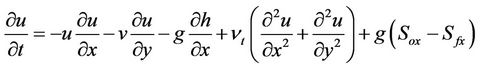
the two-dimensional Saint Venant equations [19]. These equations describe two-dimensional unsteady flow, vertically averaged, representing the principles of conservation of mass and momentum (Equations (1)-(3)), and are obtained from the Navier-Stokes-Reynolds equations under certain simplifying assumptions. These equations have wide applicability in the study of free surface flow. Amongst them is the flow in open channels with steep slopes [20], flows over rough infiltrating surfaces [21], propagation of flood waves Rivers [22,23], and dam break flow [24].
 (1)
(1)
 (2)
(2)
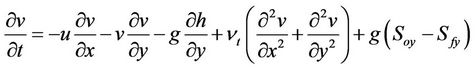 (3)
(3)
where:
Sf = friction slope, (∙)
h = water depth, (m)
u = longitudinal velocity, x direction (m/s)
v = transversal velocity, y direction (m/s)
nt = turbulent viscosity, (m2/s)
g = acceleration due to gravity, (m/s2)
3.2. The Water Quality Model
The water quality model has been adapted to the main stream of Coatzacoalcos river, which allows the simulation of the behavior and concentration distributions for different water quality parameters that can be individually aggregated in a water quality index (WQI) programmed within the model. The water quality model calculates the following parameters, grouped according to chemical properties.
• Physics: Temperature, Salinity, Suspended Solids, Electrical Conductivity.
• Biochemical: Dissolved Oxygen (DO), Biochemical Oxygen Demand (BOD), Fecal Coliform (FC).
• Eutrophication: Ammonia (NH3), Nitrates ( )Organic Nitrogen (N_org.), Inorganic phosphorous
(phosphate, ), organic Phosphorous (P_org.).
• Metals: Cadmium, Chromium, Nickel, Lead, Vanadium, Zinc.
• PAHs: Acenaphthene, Phenanthrene, Fluoranthene, Benzo(a)anthracene, Naphthalene.
The transport and transformation of the different environmental parameters was carried out by applying the two-dimensional approach of the Advection-DiffusionReaction equation [25,26].
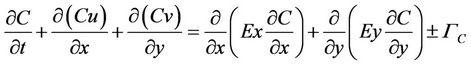 (4)
(4)
where:
C = Concentration of any parameter, (mg/L)
Ex = Coefficient of longitudinal dispersion, (m2/s)
Ey = Coefficient of transversal dispersion (m2/s)
Γc = Reaction mechanism The reaction model, Γc, is used to represent the water quality parameters, and it is solved individually and specifically for each of them [27].
3.3. Numerical Modeling of Coatzacoalcos River
The Saint Venant and A-D-R equations are numerically solved using an Eulerian-Lagrangian method [17,28]. The solution separates the equations by their main components, advection and diffusion, which are solved using a combination of Lagrangian and Eulerian techniques, respectively. Figure 3 shows the flow diagram for the model general solution.
3.3.1. Numerical Grid
A numerical grid Staggered Cell type is used. In this grid the scalars are evaluated in the center of the cell and vector magnitudes are evaluated on the edges. Figure 4 shows the calculation grid used to model the Coatzacoalcos river stretch, which has a length about 25 km, a grid resolution of Δx = Δy = 100 m, and which has 163 elements in the X direction and 211 elements in Y direction, giving a total of 34,393 elements.
3.3.2. Model Calibration
Calibration is an iterative process, in which the model is
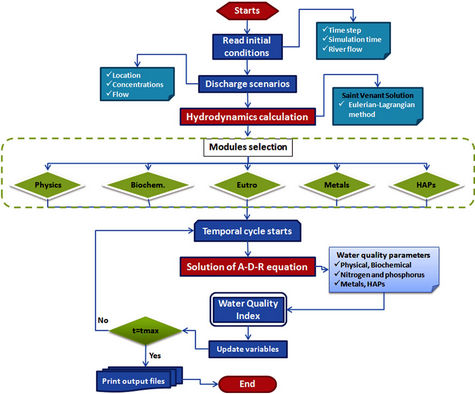
Figure 3. Flow diagram of ANAITE/2D numerical model.
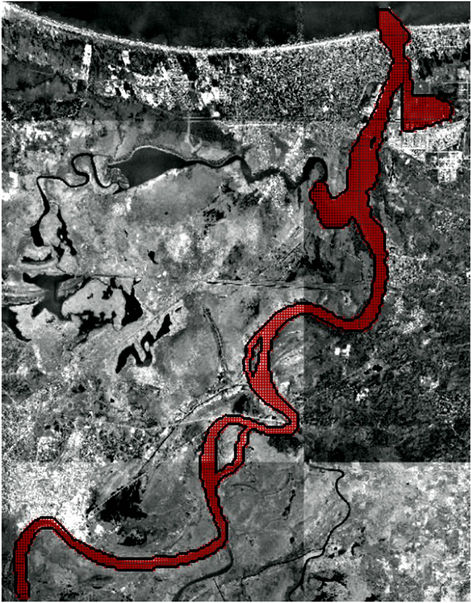
Figure 4. Coatzacoalcos cell grid.
run with the available data and the initial estimation of the reaction rates, dispersion coefficients, etc. Subsequently, the model results and the observed values are compared, and the calibration parameters are adjusted until a reasonable agreement is achieved between modeled and observed values.
To verify the quality of the numerical solution with respect to the observed data is used the Nash-Sutcliffe efficiency [29] given by the following expression:
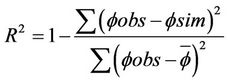 (1)
(1)
where, φobs are the observed or measured data, φsim are the calculated data by the numerical model, at the same site and time, and  is the average of observed data. Some suggested values for decision making regarding the values produced by the Nash-Sutcliffe efficiency are presented in Table 1.
R2 = 1 indicates a perfect adjustment, while a R2 ≤ 0 suggests that the average values observed ( ) is a better predictor than the used model.
3.3.3. Sampling Campaign
A sampling and measurement campaign was carried out in the Coatzacoalcos River stretch from upstream of Minatitlan city to its mouth in Gulf of Mexico. Ten measurement and sampling sites were selected; the main criterion for its location was the representative of both the hydrodynamics and water quality in the area, considering the facilities, municipalities and hydrologic aspects on this zone. Figure 5 shows the location of measurement and sampling sites selected. The information obtained through direct measurements and chemical analysis is primarily used for testing and numerical model validation.
The site references are presented in Table 2, along with other hydraulic characteristics.
At each selected site, field measurements were performed and water and sediment samples were collected.
For validation purposes and to establish a quantitative parameter of the numerical solution quality, Equation (5) was applied to the data from Figure 6. The water quality models were validated by comparison with the field measurements.
Figure 6 shows the comparison between measured and simulated data (each point represents a measurement station and the solid line the model output); by the application of Nash-Sutcliffe efficiency (Equation (5)) a result of 0.79, 0.62 and 0.92 was obtained for the parameters DO, NO3 and Vanadium, respectively, showing a good
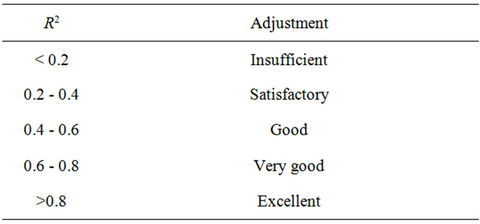
Table 1. Reference values of Nash-Sutcliffe criteria.
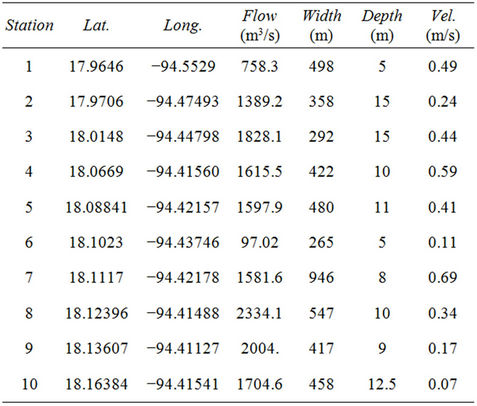
Table 2. Hydraulic characteristics of Coatzacoalcos River.
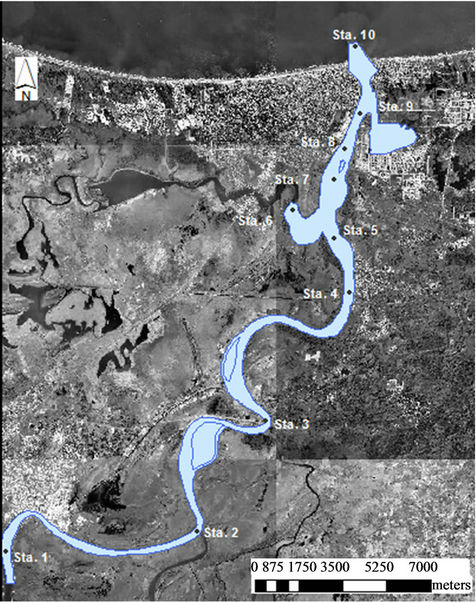
Figure 5. Measurements and sampling stations.
and very good correlation and adjustment between simulated and observed data. The model results are consistent with these measurements; therefore, the developed model can be implemented and applied to different situations in the study area.
4. The Environmental Information System
As stated by [11], the current environmental assessment studies are unthinkable without the use of EIS and software tools for complex decision making processes, like models, due to the huge amount of heterogeneous data that need to be handled, and also due to the difficulty of generating clear and understandable evaluations for decisions makers and the general public.
The information system presented here integrates the models described above in order to allow the users to carry out water quality evaluations and implement water management procedures intended to the support the control and prevention of water contamination.
This system gathers all relevant and available information, whether generated by the models or collected from different sources, and presents it in a single integrated user interface. The system currently works as a prototype designed for the MCIP, and may be used to provide watershed managers, decision makers, and the general public with access to environmental information with heterogeneous characteristics, from different sources and institutions, which is normally scarce, scattered, and/or
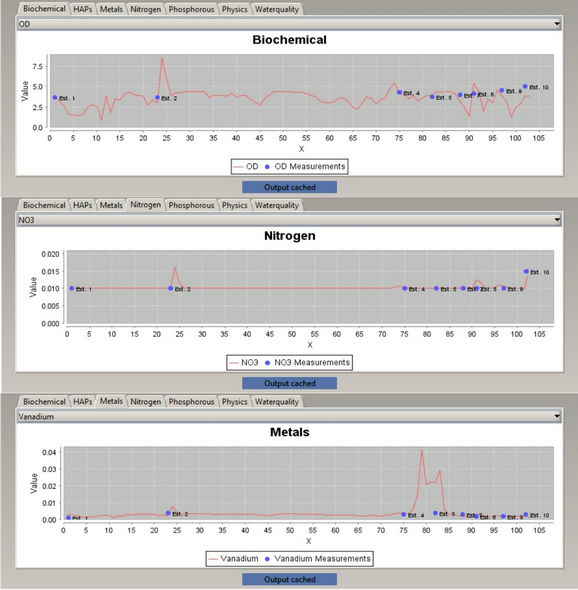
Figure 6. Concentration profiles for measured and calculated DO, NO3 and Vanadium.
disorganized.
4.1. System Components
This EIS is designed for users who want to use the system for analysis, simulation, and recognition of the study area, as well as decision makers who want to simulate real-world scenarios in the studied Coatzacoalcos River reach. The EIS will eventually have three key players. General users and expert users (the primary users) access the system through the Internet with specific limitations; the System Manager has full access, allowing them to update the model and databases, and modify files. The first version of this system (which is a prototype) supports access only for the System Manager and primary users (Figure 7).
The users have the capability of displaying information stored within the internal database, and are also able to perform simulations of pollutant transport and water quality according to their specific interests, including the option to modify the initial input and boundary conditions and to create their own scenarios. With this information, it is possible to make pertinent decisions and take those control measures which are necessary to achieve the ecosystem’s optimal state.
In order to do this, data from disparate sources may be required, suggesting the importance of interoperability to overcome the possibility to compare and merge data from various sources. Interoperability can be defined as the condition whereby, heterogeneous systems works as if they were part of the same system, and thus exchange data and distribute processes, and aims to facilitate the discovery and use of data coming from different sources. In other words, the objective is for clients and services to
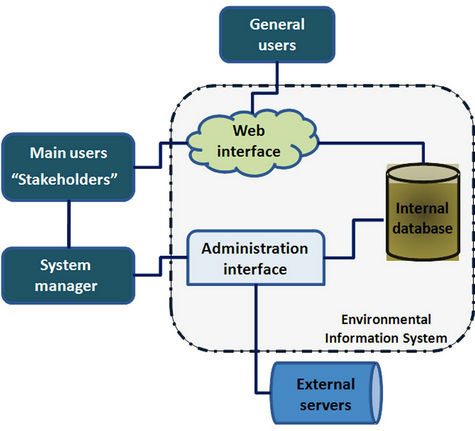
Figure 7. Overview of the system environment.
communicate and understand each other no matter what platform they run on.
Standards such as XML and Web Services based on SOAP (Simple Object Access Protocol), UDDI (Universal Description, Discovery, and Integration) and WSDL (Web Service Description Language) can solve many application-level problems of interoperability [30].
Models can be incorporated within an EIS in one of three ways: 1) using the executable files as given through appropriate interfaces for the model input and output; 2) emulating the model by a simplified version such as an input-output model; and 3) converting the source code to a programming language that can be run directly within the client operating system [10]. In this work, the first method was implemented.
4.2. Technological Platform
ANAITE/2D was implemented using the CIDs® Navigator, developed by the Environmental Informatics Group (EIG) and cismet GmbH [31-33]. It is a simple and powerful tool for geospatial data manipulation of complex processes, and is an independent platform that can be used on all common operating systems. In combination with new and innovative environmental information technologies the maximum benefit of computational advances can be engaged through CIDs. The system is based on a concept of distributed services that integrate GIS, models, and data/metadata management, as well as interconnection with other systems.
The numerical models for contaminant transport and water quality simulation were “wrapped” in order to be executed using the CIDs platform, in an implementation hereafter to be called EIS-ANAITE/2D.
4.3. Architecture of EIS-ANAITE/2D
Figure 8 presents the scheme for the EIS-ANAITE/2D architecture, defining the methodology for water quality assessment, and integrating elements such as essential database management services, GIS, and mathematical models. EIS-ANAITE/2D is based on a service-oriented architecture, which basically consists of two main modules: Client and Web Service.
Client. Users access EIS-ANAITE/2D through a Web site using any standard Web browser (such as Internet Explorer, Firefox, Safari, or Google Chrome). From the Web site, the CIDs Navigator is started, which integrates the interfaces where the users configure and enter the initial data required to run the numerical models, and where the results are displayed. At the moment, the system is configured to be used locally, and therefore must be configured on a local network.
Web Service. The main objective of this module is
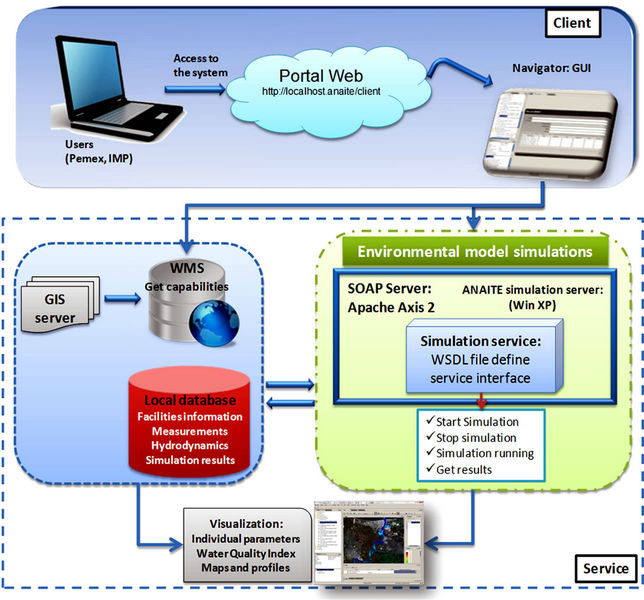
Figure 8. System architecture.
numerical model execution. This service runs on the Axis2 service, which is an open-source implementation of SOAP or Web services containers, implemented in TOMCAT. SOAP allows a program running on one type of operating system (e.g. Windows) to communicate with another program running on the same or different operating system (e.g. Linux). Computational processes like the ANAITE models are integrated through OGC Web Processing Service (WPS) compliant services. SOAP can be used to package WPS requests and responses [33]. SOAP describes a message exchange mechanism which contains an env:body element, but it does not describe the contents of that body, WPS describes a message exchange mechanism that can be used if SOAP is not required, but it goes beyond SOAP by specifying what the payload should look like. WPS enables the development of both software frameworks and generic clients [34,35].
Using a Web Services Description Language (WSDL) file the service interface is defined, with XML messages that the service can accept and return, and send the instructions to the numerical models.
The service that allows initial configuration, numerical model execution, and result storage is executed in Windows XP, while the service that reads the ASCII files to display the data as WMS maps is executed in Linux. The results are stored in the local database and can be visualized when they are requested from CIDs. Also on the Web service are the external WMS maps that may be accessed and displayed in the navigator.
4.4. Data and Map Management
The system allows access to different base maps available through the Web Mapping Service and Web Feature Service (WFS), and in this case displays the corresponding area of the Coatzacoalcos River.
The results generated by the numerical model and all the field data available for the different parameters are stored in a local database. The file formats are compatible with ArcGrid, using ASCII encoding.
To display the desired information, the user needs to define some search criteria from the available options:
• Baseline maps: maps of the catchment area (land uses, population, cities, activities, water bodies, etc.). These maps will be accessed through the WMS or WFS service.
• Measured data: data tables and graphs. Information obtained from different sources and generated by sampling campaigns.
• Simulated data: 2D images, and concentration-distance profiles.
4.5. GUI of EIS-ANAITE/2D
ANAITE is heavily based on sophisticated mathematical models of hydrodynamics and the advective-dispersive transport of pollutants. However, it is important to know that the primary end users of the system are not modelers. They will very likely be aware of the existence and use of mathematical models describing water quality, and it is assumed that they value, and to some extent trust the results of such models, at least under circumstances appropriate to their use [36].
Developing a friendly interface for processing spatial information and graphics provides new and enhanced tools to support planning and management of estuarine areas. In these areas, the use of mathematical models for simulating hydrodynamics and biochemical processes is a powerful method capable of strengthening the support tools used for decision making in water resources management, complementing the analysis components and visualization present in a GIS based tool.
EIS-ANAITE/2D incorporates a GIS-based user interface that allows easy access and flexible and easy-to-implement user-defined scenarios. All user communication with the services is carried out by means of this interface, whether for input data, maps, or model result visualization. Most features may be accessed via mouse click.
When the system starts, a screen like to the one shown in Figure 9 is displayed. The main areas are: Maps, Description, and Data Source catalog. CIDs uses a Layout Manager, which allows users to display, hide, change or relocate sections of the displayed information to suit their needs and preferences.
4.5.1. System Linkage with GIS
In the Maps area, it is possible to overlay different map layers, allowing one to observe and compare the different environmental characteristics along the river (Figure 10). The Data Source area connects the system with external data sources and maps. A data source can be a Web Map Service (WMS) or Web Feature Service (WFS). This option may be used, for example, to select new discharge points, because the user can observe such important aspects as topography, urban areas, agricultural areas, etc., being able to properly identify the characteristics of the zone. To display new data in the map area, one need only select data from the Data Source area and drag them to the maps area.
4.5.2. Initial Input Data
To run the water quality model, a model must be selected. The system provides a predefined set of discharges, which have precise information about location, flow and chemical characterization. Nevertheless, it is possible to change the number of discharges, concentration for each parameter, and relocate the discharge along the river to create new scenarios for simulation. The following discharge data can be modified:
• Location and position of discharges in the river• Discharged volume (flow rate)• Chemical characterization• General descriptions.
• The following inputs are required to run the model.
• Water quality model selection. Can be selected individually or all together.
• Hydrodynamics selection, represented by a specific month of the year. The system currently provides one different hydrodynamic data set per simulated month.
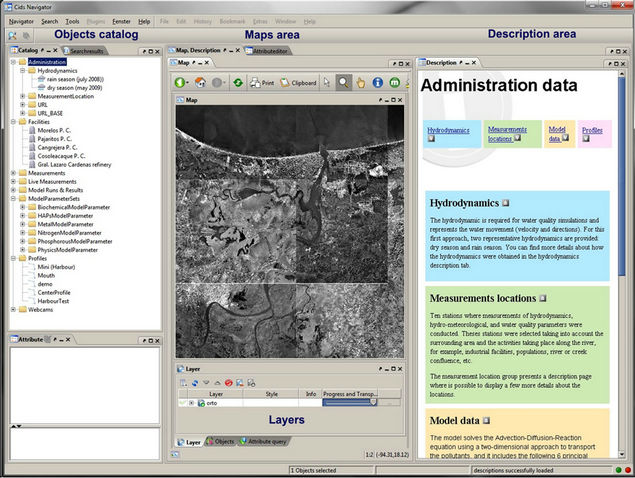
Figure 9. System architecture.
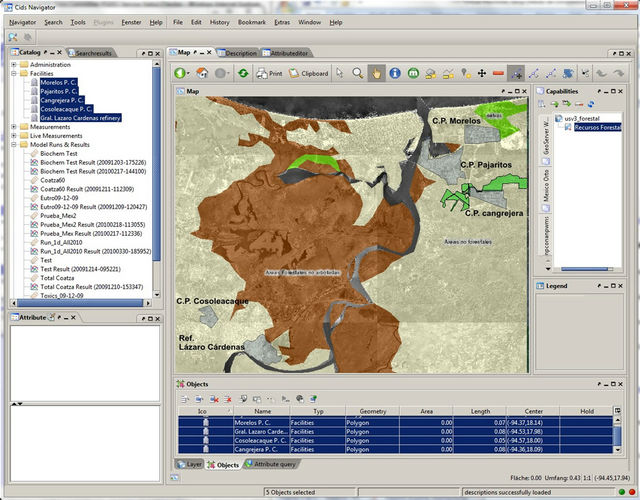
Figure 10. WMS maps visualization.
• Simulation time. This is the total time to be simulated, ranging from 1 - 30 days.
• Time step. The time that passes in the model before the variables are updated (s).
• Flow rate. Amount of water that flows through the river in a given time (m3/s).
The system stores the model configuration as well as the model parameters set, allowing the reuse of information at any time.
To assign the discharge conditions previously described, the user only needs to select these discharges from the menu and drag them to the model configuration area. The model will automatically consider them during execution. The models without discharge data are not considered by the simulation. As more models are being solved, the simulation time increases.
A particularly useful characteristic of the EIS-ANAITE/2D is that the users need not take special action to move data from the non-spatial to the spatial domain. When they discover a data set of interest, perhaps a set of water quality measurements made during a particular study, they need only drag this data set onto the spatial display window for the system to use embedded spatial information in the data to represent them on the map. This sort of capability removes the burden of data formatting and management expertise from the primary user and allows them to focus instead on their environmental decision domain.
4.5.3. Model Output and Results Visualization
The system supports visualization of the results in two different ways: as concentration maps and concentration profiles.
Concentration maps. The model results concentrations are displayed in the Map Area as WMS maps (Figure 11). With this visualization it is possible to observe the contaminant concentration distribution along the river, for each parameter individually.
Concentration profiles. The purpose of the Profiles tool is to represent the concentration of water quality parameters at a specific place on the River. The system provides a predefined profile that represents the concentration at the center and along the studied river stretch. However, it is possible to add new profiles at any location desired by the user.
This option also allows comparison with the measured data, which is important because one can see if the modeling results are consistent with the measured concentration (observed data) in the water body (Figure 12), providing a way to further validates the model results. In this work this capability was used in the calibration process (Figure 6).
Additional aspects of ANAITE/2D are described in [17, 35].
5. Summary & Conclusion
We have presented a decision support system as a powerful and user-centric tool for stakeholders involved in the protection of the Coatzacoalcos River in Mexico. The Coatzacoalcos area is adjacent to the largest agglomeration of petrochemical installations in Mexico and is also
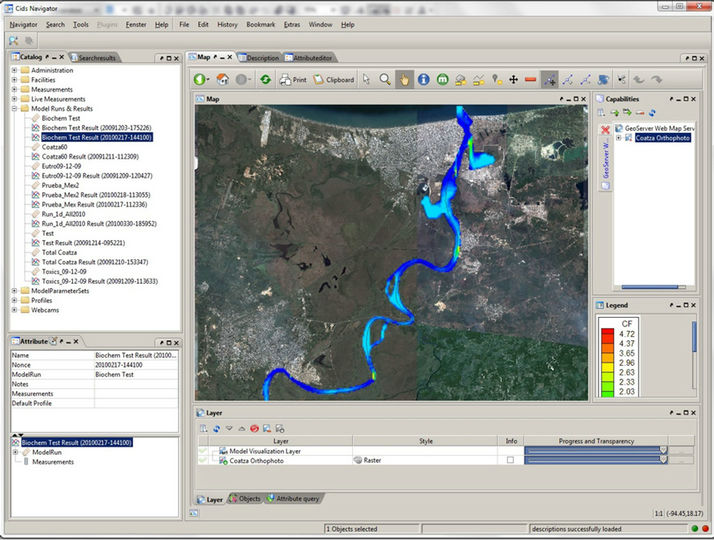
Figure 11. Simulation results visualization.
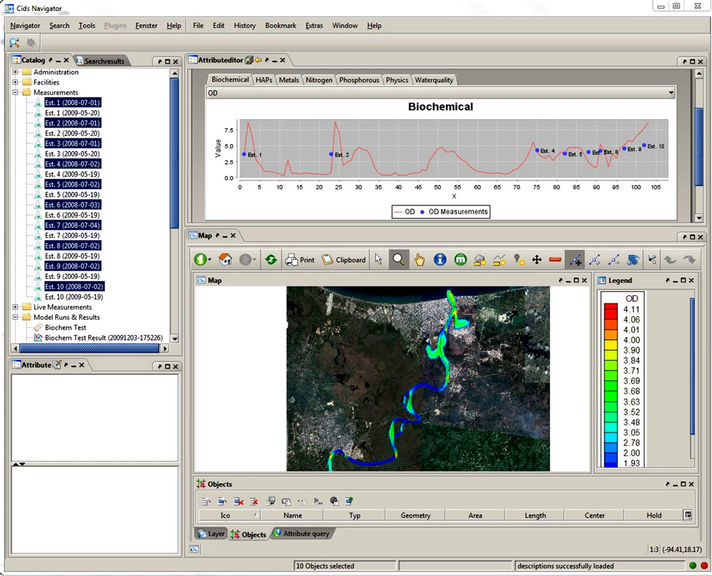
Figure 12. Visualizing maps and profiles simultaniously.
densely populated and important for agriculture. The principal idea is to provide a tool for decision makers and water resources managers which facilitate evaluation and management measures, obtaining water quality information in a short time through the simulation process. While tools such as environmental indices, GIS, and numerical models are individually adequate for the particular parts of the problem, including a wide set of functionality in a fully integrated EIS, as described in this work, has the prospect of increasing the efficiency of decision making processes considerably.
The system described consists of 2 major building blocks:
• The integrated numerical model capturing the river’s hydrodynamics and water quality.
• The software incorporating the decision support logic, including the GUI.
The integrated numerical model solves the two-dimensional Saint Venant equations and Advection-DiffusionReaction equations to study pollutant transport and water quality and involves 22 different parameters, including physical, chemical, biological and toxic substances. These models were chosen because, on the one hand adequately and efficiently represent the hydrodynamic behavior in rivers, and on the other hand, for water quality analysis these parameters reflect the environmental conditions of a river receiving the types of discharges that occur in the study area.
The users addressed are biologists, environmental engineers, water managers, politicians, lawyers, economists and the general public.
The EIS on top of the model provides a modern and comfortable interface supporting the effective and efficient handling, processing and display of environmental data. The EIS was developed on the basis of an EDSS platform, or decision support environment, which is described elsewhere [34].
With ANAITE/2D, a point of convergence between scientific analysis and realistic and user centered application is established. The system supports measures to monitor and evaluate the environmental conditions of the Coatzacoalcos River, thus helping the involved stakeholders to preserve and sustain water quality by deciding on mitigating actions where necessary. On basis of this work additional EDSS applications with different contexts (e.g. air quality, climate change, urban planning) are being developed [30].
ANAITE/2D is designed to support “what if” scenario analyses in which the environmental manager postulates different values for chemical discharges into the river, at different locations, in order to see what impact these changes might have at various points along the river.
Finally, we foresee the future opportunity to address the efforts of the developed numerical model to an operational modeling, in order to combine models and field observations optimally.
6. Acknowledgements
EIG and CISMET Team: Dr. Reiner Güttler, Sebastian Puhl, Thorsten Herter, Martin Scholl, Benjamin Friedrich, Michael Brill, Nils Steinbiß. Mexican Petroleum Institute: Dr. Francisco Guzman, Gerardo de Alba, Efren Camacho, Maria Luisa Alavez.
REFERENCES
- A. J. Jakeman and R. A. Letcher, “Integrated Assessment and Modelling: Features, Principles and Examples for Catchment Management,” Environmental Modelling & Software, Vol. 18, No. 6, 2003, pp. 491-501. doi:10.1016/S1364-8152(03)00024-0
- M. Matthies, C. Giupponi and B. Ostendorf, “Environmental Decision Support Systems: Current Issues, Methods and Tools,” Environmental Modelling & Software, Vol. 22, No. 2, 2007, pp. 123-127. doi:10.1016/j.envsoft.2005.09.005
- R. M. Argent, “An Overview of Model Integration for Environmental Applications Components, Frameworks and Semantics,” Environmental Modelling and Software, Vol. 19, No. 3, 2004, pp. 219-234. doi:10.1016/S1364-8152(03)00150-6
- R. A. Letcher, B. F. W. Croke and A. J. Jakeman, “Integrated Assessment Modelling for Water Resource Allocation and Management: A Generalised Conceptual Framework,” Environmental Modelling & Software, Vol. 22, No. 5, 2007, pp. 733-742. doi:10.1016/j.envsoft.2005.12.014
- D. Yuan, B. Lin, R. A. Falconer and J. Tao, “Development of an Integrated Model for Assessing the Impact of Diffuse and Point Source Pollution on Coastal Waters,” Environmental Modelling & Software, Vol. 22, No. 6, 2007, pp. 871-879. doi:10.1016/j.envsoft.2006.05.010
- E. Dimitriou and L. Zacharias, “Using State-of-the-Art Techniques to Develop Water Management Scenarios in a Lake Catchment,” Nordic Hydrology, Vol. 38, No 1, 2006, pp. 79-97. doi:10.2166/nh.2007.026
- S. P. Frysinger, “Environmental Decision Support Systems: A Tool for Environmentally Conscious Management,” In: C. N. Madu, Ed., Handbook for Environmentally Conscious Manufacturing, Kluwer Academic Publishers, Norwell, 2001.
- B. S. McIntosh, R. A. F. Seaton and P. Jeffrey, “Tools to Think with? Towards Understanding the Use of Computer-Based Support Tools in Policy Relevant Research,” Environmental Modelling & Software, Vol. 22, No. 5, 2007, pp. 640-648. doi:10.1016/j.envsoft.2005.12.015
- S. P. Frysinger, “An Open Architecture for Environmental Decision Support,” International Journal of Microcomputers in Civil Engineering, Vol. 10, No. 2, 1995, pp. 123-130. doi:10.1111/j.1467-8667.1995.tb00275.x
- W. G. Booty, D. C. L. Lam, I. W. S. Wong and P. Siconolfi, “Design and Implementation of an Environmental Decision Support System,” Environmental Modelling & Software, Vol. 16, No. 5, 2001, pp. 453-458. doi:10.1016/S1364-8152(01)00016-0
- R. Denzer, “Computing Programs for Scientists and Engineers—What Is the Core of Computing?” In: L. Cassel and R. Reis, Eds., Informatics Curricula and Teaching methods, Kluwer IFIP Series, 2003, pp. 69-75.
- M. Acreman, “Linking Science and Decision-Making. Features and Experience from Environmental River Flow Setting,” Environmental Modelling & Software, Vol. 20, No. 2, 2005, pp. 99-109. doi:10.1016/j.envsoft.2003.08.019
- J. Berlekamp, S. Lautenbach, N. Graf and M. Matthies, “A Decision Support System for Integrated River Basin Management of the German Elbe,” Journal of Water Resources Planning and Management, Vol. 109, No. 2, 2006, pp. 158-169.
- H. Sieker, S. Bandermann, K. Schröter, M. Ostrowski, A. Leichtfuss, W. Schmidt, E. Thiel, C. Peters and R. Mühleck, “Development of a Decision Support System for Integrated Water Resources Management in Intensively Used Small Watersheds,” Water Practice & Technology, Vol. 1, No. 1, IWA Publishing, 2006, in press.
- I. A. T. De Kort and M. J. Booij, “Decision Making under Uncertainty in a Decision Support System for the Red River,” Environmental Modelling & Software, Vol. 22, No. 2, 2007, pp. 128-136. doi:10.1016/j.envsoft.2005.07.014
- P. Reichert, M. Borsuk, M. Hostmann, S. Schweizer, C. Spörri, K. Tockner and B. Truffer, “Concepts of Decision Support for River Rehabilitation,” Environmental Modelling & Software, Vol. 22, No. 2, 2007, pp. 188-201. doi:10.1016/j.envsoft.2005.07.017
- F. Torres-Bejarano, H. Ramírez and C. Rodríguez, “A Study Case of Hydrodynamics and Water Quality Modelling: Coatzacoalcos River, Mexico,” In: H. E. Schulz and A. L. Andrade, Eds., Hydrodynamics—Natural Water Bodies, InTech, Winchester, 2012, pp. 49-66. doi:10.5772/27721
- F. Torres-Bejarano and H. Ramírez, “El Programa ANAITE Para el Estudio de la Dinámica y la Calidad del Agua en Cauces Naturales con Pendiente Suave,” Revista Internacional de Contaminación Ambiental, Vol. 23, No. 3, 2007, pp. 115-127.
- M. H. Chaudhry, “Open Channel Flow,” Prentice Hall, Upper Saddle River, 1993.
- T. M. Salaheldin, J. Imran and M. H. Chaudhry, “Modeling of Open-Channel Flows with Steep Gradients,” Ingeniería del Agua, Vol. 7, No. 4, 2000, pp. 391-408.
- G. Wang, S. Chen, J. Boll, C. Stockle and D. McCool, “Modelling Overland Flow Based on Saint-Venant Equations for a Discretized Hillslope System,” Hydrological Processes, Vol. 16, No. 12, 2002, pp. 2409-2421. doi:10.1002/hyp.1010
- X. Ying, S. Y. Wang and A. A. Khan, “Numerical Simulation of Flood Inundation Due to Dam and Levee Breach,” Proceedings of ASCE World Water and Environmental Resources Congress, Philadelphia, 23-26 June 2003, pp. 1-9.
- P. Chagas and R. Souza, “Solution of Saint Venant’s Equation to Study Flood in Rivers, through Numerical Methods,” Hydrology Days, 2005, pp. 205-210.
- S. Mambretti, E. Larcan and D. Wrachien, “1D Modelling of Dam-Break Surges with Floating Debris,” Biosystem Engineering, Vol. 100, No. 2, 2008, pp. 297-308. doi:10.1016/j.biosystemseng.2008.02.011
- S. Chapra, “Surface Water-Quality Modeling,” McGrawHill Series in Water Resources and Environmental Engineering, McGraw-Hill, New York, 1997, 784 p.
- R. Thomann and J. Mueller, “Principles of Surface Water Quality Modeling and Control,” Manhattan College, HarperCollins Publishers, New York, 1987.
- T. Wool, R. Ambrose, J. Martin and E. Comer, “Water Quality Analysis Simulation Program, (WASP) Version. 6.0,” US Environmental Protection Agency, Region 4, Atlanta, 2006.
- C. Rodriguez, E. Serre, C. Rey and H. Ramírez, “A Numerical Model for Shallow-Water Flows: Dynamics of the Eddy Shedding,” WSEAS Transactions on Environment and Development, Vol. 1, 2005, pp. 280-287.
- M. S. Horritt, “Computational Fluid Dynamics: Applications in Environmental Hydraulics,” Parameterisation, Validation and Uncertainty Analysis of CFD Models of Fluvial and Flood Hydraulics in the Natural Environment, John Wiley and Sons, Hoboken, 2005.
- J. Park and S. Ram, “Information Systems Interoperability: What Lies Beneath,” ACM Transactions on Information Systems (TOIS), Vol. 22, No. 4, 2004, pp. 595-632. doi:10.1145/1028099.1028103
- S. Schlobinski, T. Hell, R. Denzer and R. Güttler, “Ein Werkzeug für die Entwicklung Integrierter Fachanwendungen im Umfeld Verteilter Datenund Service-Infrastrukturen,” Proceedings Angewandte Geoinformatik, Beiträge zum 23, AGIT-Symposium, Salzburg, 8-10 July 2011, pp. 245-250.
- R. Denzer, “Generic Integration of Environmental Decision Support Systems—State-of-the-Art,” Environmental Modelling & Software, Vol. 20, No. 10, 2005, pp. 1217- 1223. doi:10.1016/j.envsoft.2004.09.004
- R. Güttler, R. Denzer and P. Houy, “An EIS Called WuNDa Environmental Software Systems,” Environmental Information and Decision Support, Vol. 3, Kluwer Academic Publishers, Norwell, 2000, pp. 114-121.
- P. Schut, “OpenGIS Web Processing Service,” Open Geospatial Consortium Inc., 2007. http://portal.opengeospatial.org/files/?artifact_id=24151
- R. Denzer, S. Schlobinski, T. Hell, R. Güttler and L. Gidhagen, “Towards Automation of Model Execution from a Decision Support Environment,” 19th International Congress on Modelling and Simulation, Perth, 12-16 December 2011, pp. 1202-1208.
- R. Denzer, F. Torres-Bejarano, T. Hell, S. Frysinger, S, Schlobinski, R. Güttler and H. Ramírez, “An Environmental Decision Support System for Water Issues in the Oil Industry,” Environmental Software Systems, Vol. 9, Frameworks of eEnvironment, IFIP AICT 359, Springer, Berlin, 2011, pp. 208-216.