Journal of Environmental Protection
Vol.3 No.11(2012), Article ID:25083,11 pages DOI:10.4236/jep.2012.311174
Fish Consumption Advisories and the Surprising Relationship to Prevalence Rate of Developmental Disability as Reported by Public Schools
![]()
University of Northern Iowa, Cedar Falls, USA.
Email: *cathy.desoto@uni.edu
Received August 23rd, 2012; revised September 19th, 2012; accepted October 22nd, 2012
Keywords: Mercury; Prenatal; Autism; ASD; Seafood; Diet; Environmental Health Environmental Mercury Exposure and Prevalence Rate of Autism as Reported by Public Schools
ABSTRACT
According to the Environmental Protection Agency (EPA), fish consumption is the most significant route of mercury exposure, and the concern is greatest for women of childbearing age due to the potential for neurodevelopmental effects on a developing fetus. Rates of developmental disorders vary. But in 2008 it was demonstrated that the rate of autism is higher near industries that emit heavy metals. Furthermore past research findings can be taken to show that where a pregnancy occurred may predict later autism likelihood in the offspring more than where diagnosis occurs. If mercury plays any role in developmental disabilities, the rate of disability should relate to any reliable direct measure of contamination. The current research focuses on one index of environmental mercury contamination. Specifically, mercury-related fish advisories are found to be a surprisingly strong predictor of a state’s autism rate, r = 0.48, p < 0.001. The relationship remains strong after controlling for student to teacher ratio and per pupil spending. It is argued that a secular increase in autism has been occurring and that prenatal exposure to heavy metal toxins may play a significant role. Because we suspect this finding may be of some interest, the full data set is provided in the appendix so that researchers can independently analyze the key findings which rely on CDC, EPA and IDEA data sets.
1. Introduction
Prior to the late 1980’s, studies conducted in the United States found low rates of Autism. A popular 1977 Abnormal Psychology textbook stated Kanner’s autism was “extremely rare,” noting that Kanner only saw 150 cases over 20 years of practice. The core features of full Kanner’s autism have not changed very much. Autistic persons are less interested in “human contact but respond alertly and attentively to objects,” exhibit pronounced failure “to develop social smiling,” “to learn language,” or to “relate to his social environment” [1]. The distinction between Kanner’s autism and other disorders of childhood was said to be, “early onset, absence or disturbance of language, autistic aloneness, and… preference for sameness” [1].
The observed increase in prevalence seems to have occurred throughout the world (see for example [2-4]) at least in areas where industrialization has occurred [5,6]. Recently, Atladottir et al. [4] reported the change in prevalence for all children born in Denmark over the years 1990 to 1999 (n = 669,995). Atladottir et al. [4] used standardized case ascertainment, standardized diagnostic procedures and documented an increase in both Autism Spectrum Disorders (ASD) and Childhood Autism in Denmark. The increase was documented separately for both ASD and Childhood Autism per se and was more pronounced when the stricter diagnostic definition of Childhood Autism was used. Although diagnostic changes and increased awareness presumably play at least some role in the apparent increase, the question of how much of the increase is diagnostically related has remained an open question. In their careful analysis of Minnesota autism rates, Gurney et al. [7] concluded that changes in “federal and state policy and law” such as including ASD in the USA’s Individuals with Disabilities Act in 1991 have contributed to an increase in identification. While acknowledging that their methods cannot directly determine if there has been a secular increase, it should be noted they checked for any evidence of diagnostic substitution and found no evidence for any corresponding decrease in another disability, thus ruling out diagnostic substitution.
The Centers for Disease Control have been monitoring Autism rates in several states using careful methodology across years, and in particular, the Atlanta Georgia area has been monitored for over a decade [8-10]. In 1996, the prevalence of autistic disorder among 8 year olds was 4.7 per 1000; in 2000 it was 6.5; in 2002 it was 7.6. To be clear, these results do not use different definitions for autism across time, do not rely on different case finding methods, but do consistently use more than one method for finding cases, and age at diagnosis was controlled across time—all of which have been noted as reasons to disregard previous reports of an increase [11].
Of some interest to us is the variation in prevalence rates across areas of the USA. That is, not all states show the same amount of increase (see Figures 1 and 2). We realize that diagnostic trends matter and that some of the variation may be artifact, but it seems worthy of scientific study that in Iowa one would find that 1 in 343 children have an ASD and next door in Minnesota 1 in 81 would be seen to have autism [12]; clearly it would be unwise to a priori assume such differences are 100% artifact. This is a big difference and it seems likely there is room for more than one variable to play a role. All fifty states report the number of children in the public school system who receive special education services for any disability, including Autism as required by the IDEA.
State by state prevalence difference are seen using careful standardized monitoring as well. The Center for Disease Control (CDC) has been conducting studies of prevalence across states to determine ASD and autism prevalence via the Autism and Developmental Disabilities monitoring Network (ADDMN). For example, there are 10 sites across 10 states that use the same methods of case ascertainment and identical diagnostic criteria [13] (the methodology was adapted from the Metropolitan Atlanta Developmental Disabilities Survey, detailed by CDC, 1996). Using a common case definition, common sources for ascertainment, clinical review with checks for inter-rater reliability and numerous other quality assurances; they have found markedly different prevalence rates. For example, in New Jersey 1 in 101 children are diagnosed, while in West Virginia, only 1 in 222 are diagnosed [10]. Both the CDC and the Department of Education’s Individuals with Disability Education Act (IDEA) data find New Jersey to have high prevalence rates and Colorado to have lower prevalence rates and West Virginia to be in between. In sum, available data may suggest there is some actual variation in incidence, and the variation has not been fully explained.
2. Mercury
Much attention has been devoted to thimerosal in vaccines as a source of mercury, and the connection to de-
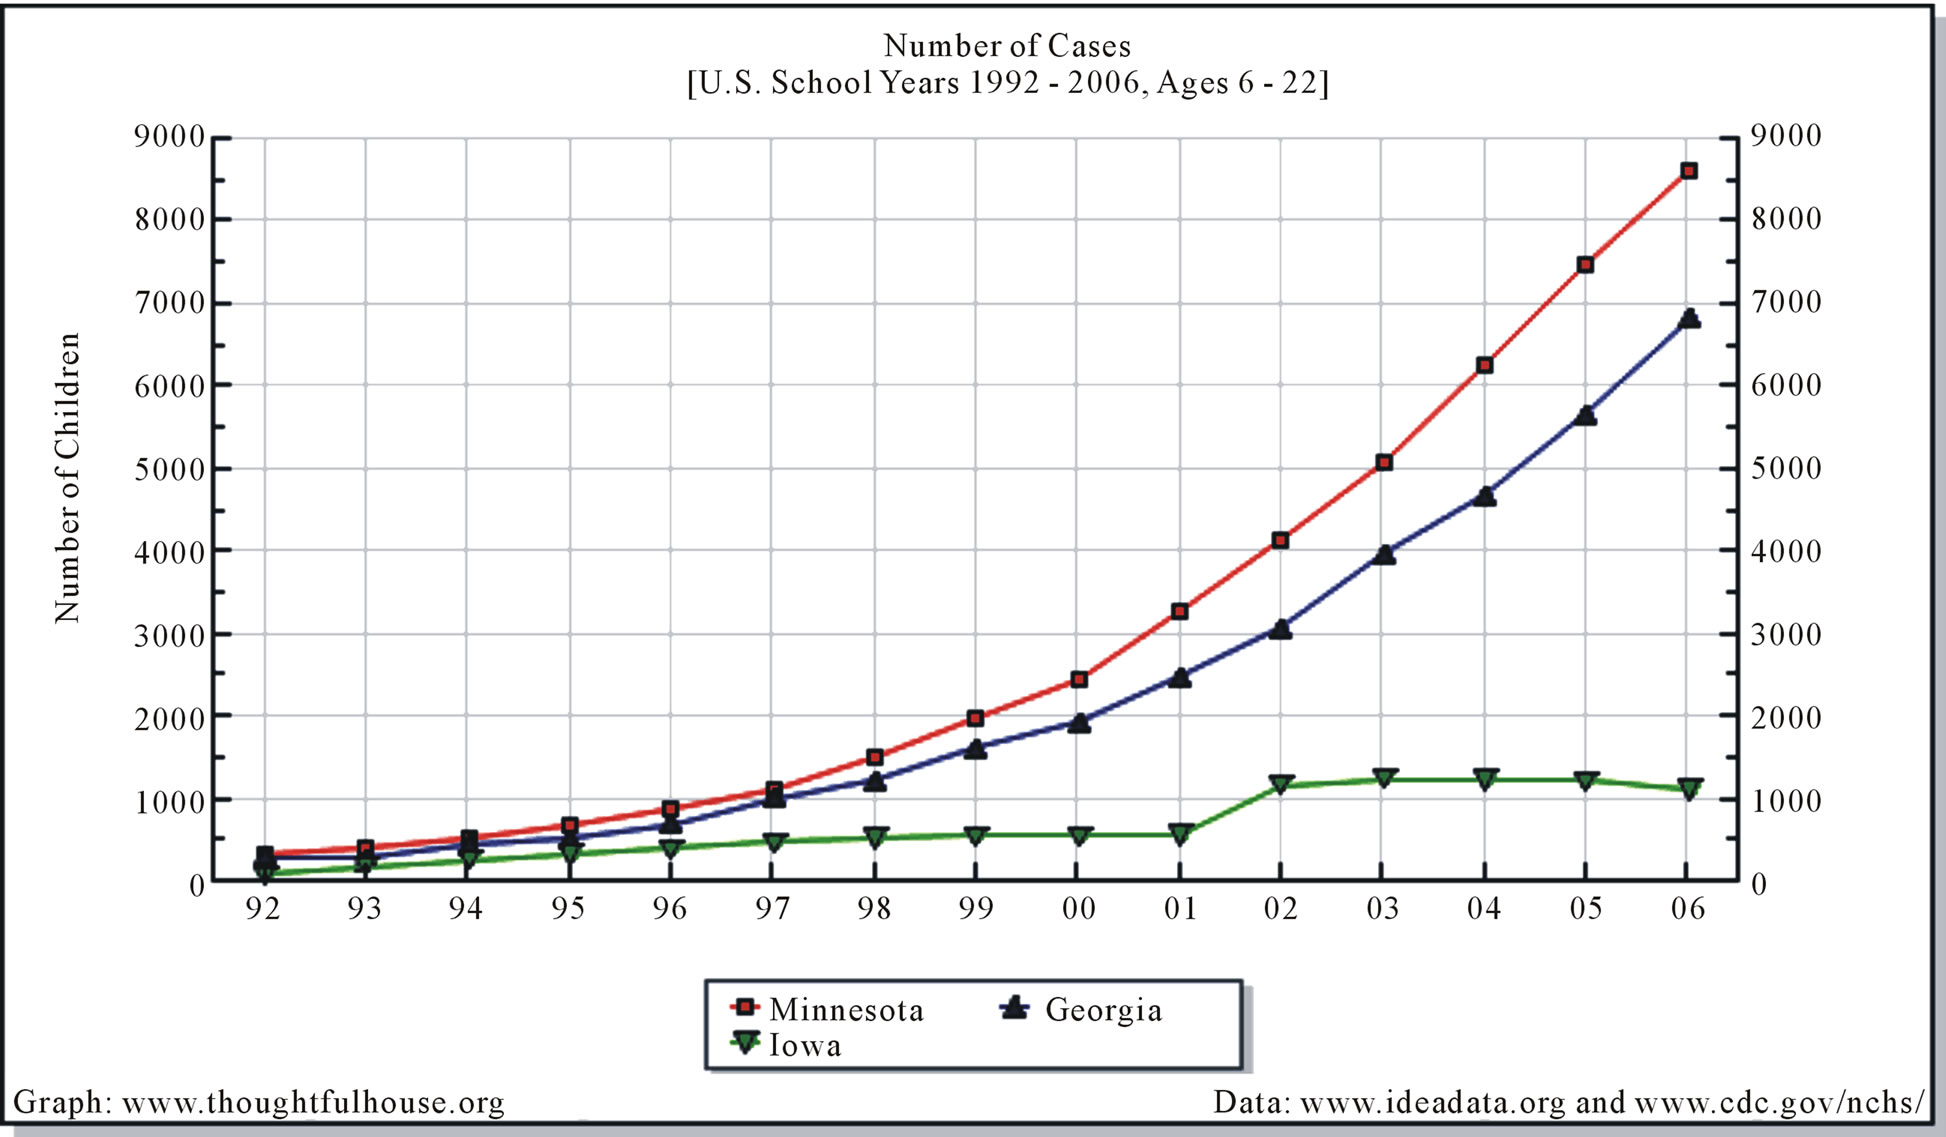
Figure 1. Since the inclusion of Autism Spectrum Disorders in the IDEA, the rate of Autism has increased, but the increase is not the same across all states.
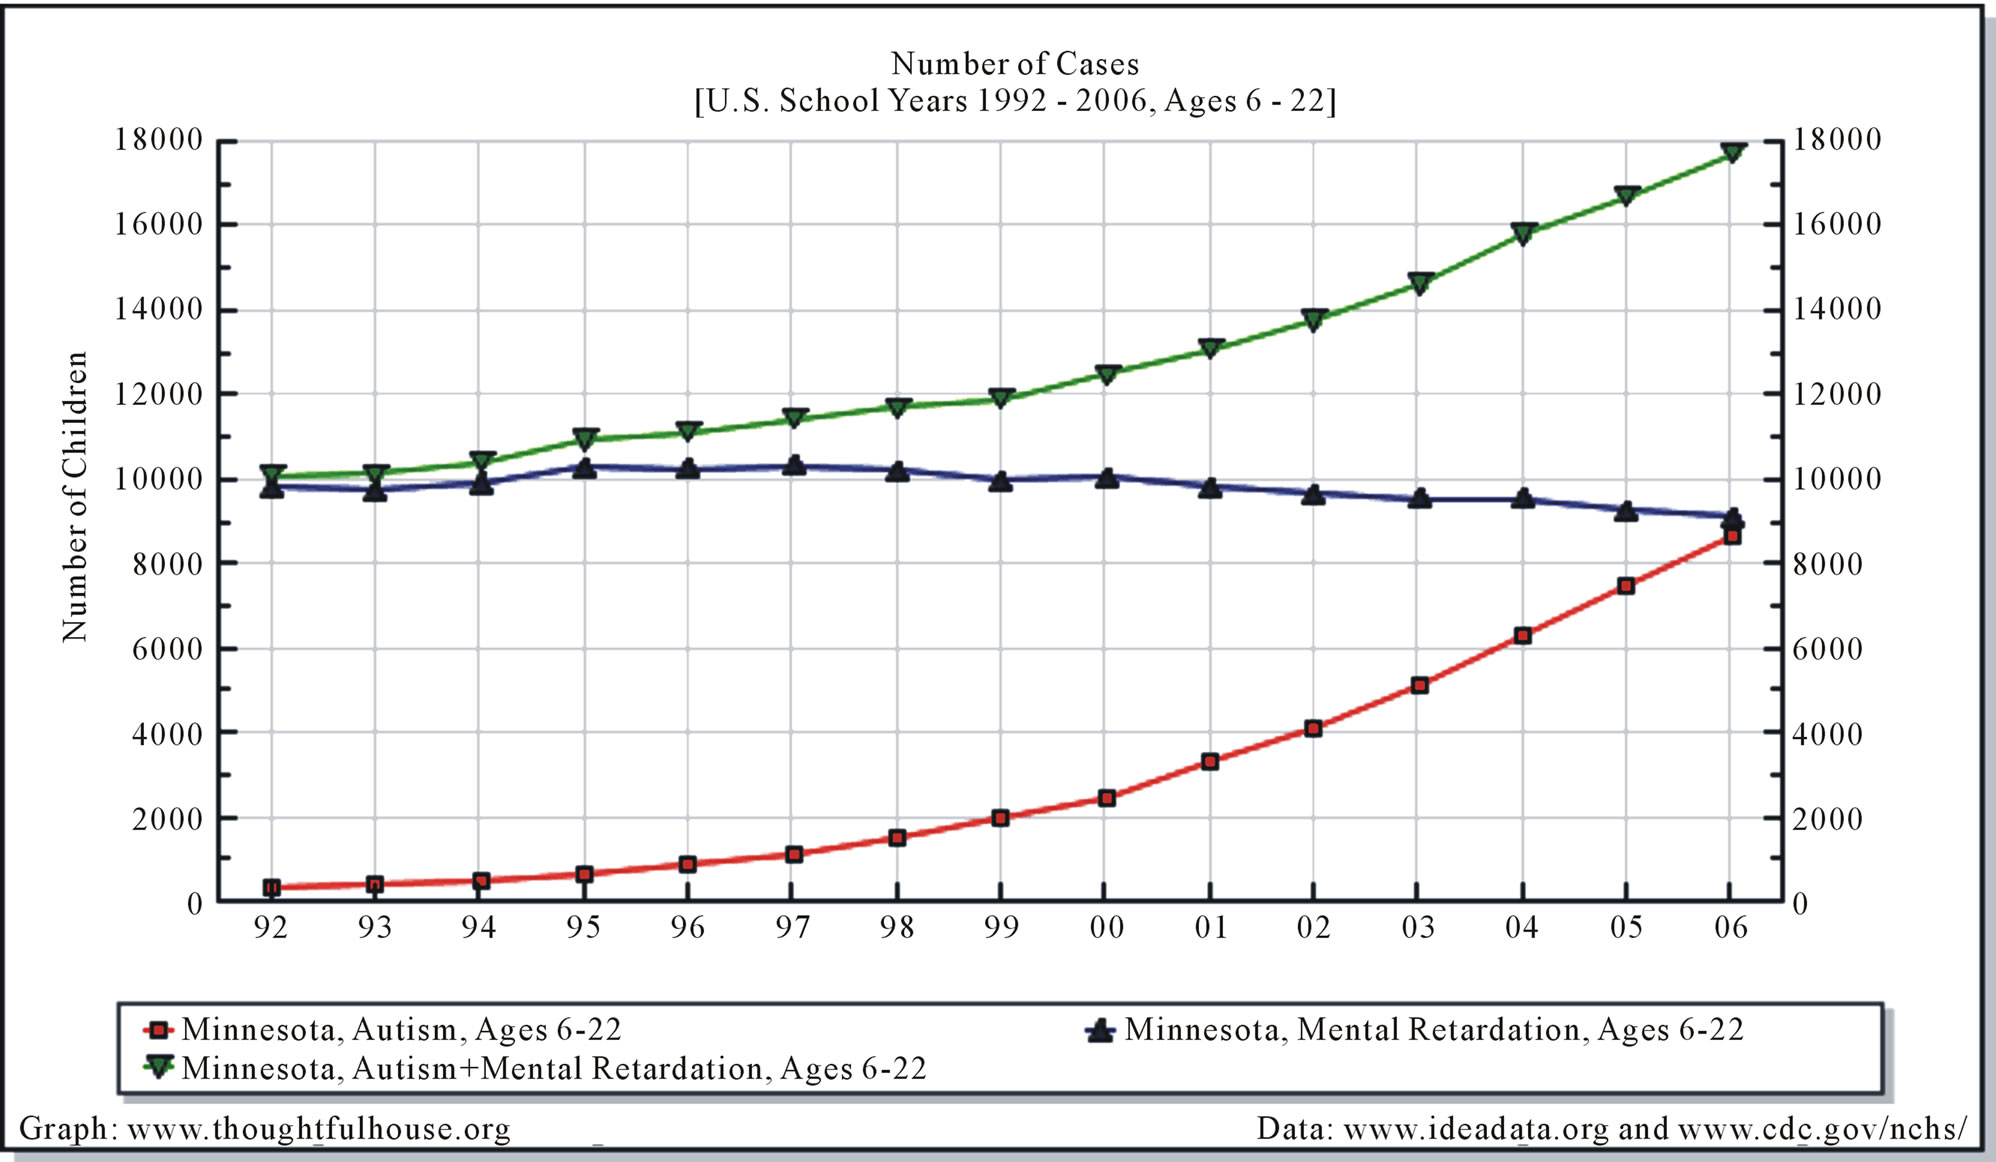
Figure 2. Autism with and without mental retardation have both been diagnosed more starting in the late 1990’s. Mental retardation diagnoses have remained steady since the early 1990’s.
velopmental disability is scientifically plausible, yet hotly debated among experts. A potential vaccine connection is not the focus of this paper. On the other hand, there is less disagreement that methyl-mercury from the environment can pose a significant risk to an unborn child’s developing brain. The National Academies of Science, writing about mercury via the toxic emissions from various factories, “The committee concludes that the risk (from mercury) is likely to be sufficient to result in an increase in the number of children who have to struggle to keep up in school and who might require remedial classes or special education services,” (p. 9). The EPA states that mercury from coal-fired utilities is the hazardous air pollutant of greatest potential public health concern [14]. The EPA and the CDC agree that about eight percent of women between the ages of 16 and 49 have mercury levels in the blood that could lead to reduced IQ and motor skills in their offspring [13,14]. Partly because newborns often have about 25% more mercury in their blood than do their mothers [15]. A delay in auditory evoked potential of children who were prenatally exposed to mercury via their mother’s eating of high mercury seafood has been demonstrated, and the delay is predicted by the mercury in the cord blood at the time of delivery and not by current mercury levels in the child [16]. The level of mercury exposure via the mother’s blood levels during gestation (again due to a high mercury seafood diet) has also been shown to relate to reductions in cognitive tests scores [17], and similar to Murata et al. [16], the effects were associated with prenatal exposure more so than postnatal exposure. Mercury appears to be a toxin that can act as a teratogen on an unborn child and effects later development even in a child who is born apparently healthy. Of some interest due to similarity to some features of autism, prenatal mercury exposure in animals leads to perseverations in behavior that tend to remain when reinforcers are diminished, and resistance to change in novel situations behavioral changes that remain into adulthood even when mercury levels are no longer elevated [18,19].
While there is some disagreement about the cost to society from mercury emissions, scientists agree that mercury in the environment is expected to lower the IQ of children. To wit, the authors of a widely cited paper [20] comparing different costs associated with the drops in IQ as a result of mercury pollution argue that the dollar amount from industrial pollution associated with IQ detriment is significant, but less than what other groups have estimated [21]. To sum, no expert really argues that mercury pollution is not damaging the central nervous system of at least some children in the USA, but do argue about the extent of damage and the associated costs.
2.1. Gestation in Areas of Pollution
A significant source of environmental mercury and other toxins is via industry that releases toxins as a byproduct of manufacturing. Recently it was demonstrated that a relationship between the autism prevalence rate within specific school districts and distance to industries that release toxins (based on the US EPA’s Toxic Release Inventory) exists. Palmer et al. [22] show that mercury emissions in 1998 were associated with Autism rates in the area four years later—even after controlling for demographics, SES and Autism rate in 2007. Furthermore, distance from the source of emission was independently related to rates as well as the amount of toxic emissions.
If prenatal exposure to environmental teratogens is playing any role, and if exposure to environmental toxins varies by location, then where a child was gestated could be an independent predictor of Autism likelihood. Thus, a test could be to compare the rates of Autism within one area as a function of where the mother was living during pregnancy. In this way, professional awareness is controlled, the same case ascertainment methods and same case definitions are used. A country where immigrants are welcome and to which many families immigrate each year from outside the country is Israel. Furthermore, Israel keeps a national registry of Autism diagnosis. Jewish children living in Israel born between 1983 and 1997 were considered and autism prevalence was calculated based on immigration status (Israeli-Born versus immigrant). Being born in Israel was associated with an increased rate of Autism (Ethiopian 8.3 per 10,000 and Non-Ethiopian 9 per 10,000) compared to those who moved to Israel—but after the pregnancy (prevalence 0 - 5.3 per 10,000), this was true for both of two genetic groups studied. The authors of the study discuss the possibility of diagnostic issues but as a whole, they conclude their results suggest, “an important environmental influence on the risk of Pervasive Developmental Disorder in Israel. Moreover, environmental contaminants of some kind associated with the urban, industrialized lifestyle, prevalent in most of Europe and the United states and increasingly in other parts of the world may be at fault for the rise in rates of Autism and other Pervasive Developmental Disabilities in other countries,” (p. 144).
Isreal’s National Marine Environmental Monitoring Program has measured heavy metals in Isreal’s coastal waters since 1978 [23]. Although mercury levels have been declining since the problem was discovered, Haifa Bay is considered to be contaminated from mercury from the Qishon River in the south and a chloralkali plant in the north. Between 15% and 20% of the fish caught in Haifa Bay continued to have elevated mercury levels at least until 2001 [23].
A study of Autism prevalence was conducted in a northern province in Japan [24]. All institutions that serviced children in the province were queried for a total for 2233 schools, nursery schools, clinics, and welfare centers. Any child for whom an institution thought might have an autism-like disorder was individually interviewed to determine a diagnosis of “Infantile Autism.” Although the rate increased for children born later than 1967, of particular interest is that the prevalence was almost three times higher in cities compared to rural areas. The authors write that in the initial query, there was no “difference in the recovery rates of cities and rural districts. Therefore, it would be difficult to explain simply the difference in prevalence rates of the two areas with respect to the difference of medical or welfare services,” (p. 123). This finding of higher rates associated with cities or industrialization is in keeping with the Kamer study of Israel [5], as well as with another Japanese study of prevalence [25]. Given the recent findings of Palmer et al. [22] that, “for very 10 miles away from the (industrial) source there is a decreased risk of autism incidence risk of 1.4%,” the findings of higher rate in urban industrialized areas begin to look less like a coincidence.
2.2. Mercury Cycle and Fish
Mercury from eating fish is an important route for mercury to enter the human body, especially in terms of the diet of a mother of an unborn child. Mercury in a pregnant mother’s cord blood increases with more seafood and fish consumption [26]. As Trasande et al. [21] summarize, “The National Academies of Sciences has found that neurodevelopment effects in children of women who ate fish in pregnancy to be the most important and best studied end point.” Here, it is hypothesized that some of the increase in autism may relate to the known terotogenic effects of methyl-mercury that occur prenatally as a result of mercury exposure. If so, then autism prevalence within the United States should vary and the variation should be partially explained by the presence of mercury contamination in the pregnant mother’s environment (such as mercury contaminated fish).
It is important to understand how mercury actually gets into the bloodstream, and eventually into the brain [27]. When the mercury is emitted (such as by burning coal) it is airborne and can remain so for some time. While it is airborne, it will move with the air based on prevailing winds, for example. Mercury may come in contact with surface waters and land at a greater or lesser amount depending on many factors (such as locations of toxic releasing factories as well as rainfall amounts) and deposition maps are available from the National Atmospheric Deposition Program [28]. The primary way that environmental mercury effects human health is via its entry into the food chain. Once the mercury is in water, bacterial processes convert the mercury into the more toxic form “methylmercury” (“methylation” occurs). Small bottom feeding fish eat the bacteria. Methylmercury is eliminated slowly so it tends to accumulate in the fish. Bigger fish eat the smaller fish. Each step in the food chain concentrates the level of mercury. People get mercury into their bloodstreams by eating these contaminated fish species. According to the EPA, “Humans are most likely to get exposed to methylmercury through fish consumption,” (part 2, p. 5). Although exposure can occur in other ways (coming in contact with contaminated dirt or water), these routes are much less than the amount that occurs from eating just one serving of contaminated fish. Once in the bloodstream, mercury readily crosses the blood-brain barrier and the placental barrier in the case of a pregnant mother. Of additional concern, the most recent studies are documenting that cord blood levels tend to be significantly higher than the mercury level in the rest of a mother’s circulation [29].
3. Methods
3.1. Participants and Measures
Public school reported prevalence. IDEA is a federal law that guarantees appropriate public education for every child with a disability. As such, all children with an ASD who receive any services from the public school system would be counted by the US Department of Special Education. The numbers are available to researchers from a variety of sources. We used the Graphing IDEA Professional, a service provided to autism researchers by the non-profit group, Fighting Autism, Austin, TX. We used the total number of cases divided by the total school age population, to get the prevalence rate within the school age population.
It is possible that school systems are more or less likely to diagnose autism, although generally to receive services requires an external diagnosis by a qualified medical doctor, clinical psychologist or other professional. Still, in as much as such differences exist, the true level of autism might be over or under-represented. To the extent this occurs, some of the variance in the numbers could be due to things not related to the actual incidence of autism in the state (funding issues, diagnostic practice). If so, then these numbers could be considered as best-guess estimates at prevalence rates within each state.
Fish advisories. The EPA has published guidelines for systematically assessing mercury and chemical contamination in waterways and fish [30]. There is a Tier One Screening to identify frequently fished locations that may have contamination. This is followed by Tier Two methods for intensive study of potentially contaminated locations; Tier Two in turn has two distinct phases. These guidelines are nationwide and exist to ensure that sampling methods allow accurate risk-based advisories for fish consumption. The guidelines are specific and would be expected to ensure that states are monitoring frequently fished sites in a standard way. Approximately 80% of all fish advisories are mercury related [31].
We used fish advisories as an index of mercury exposure. Again, this number is not a perfect measure of mercury exposure, but does represent the best index available for the amount of contamination present in the route that is assumed to be the most important route for methylmercury contamination. The fish advisories in a state will be affected by things such as the number of lakes and the number of fish species in the state. As such, it might represent one of the better indicators of exposure; because fish is the main source of environmental mercury contamination, even if deposition is high, if there are not fish to eat, it is less likely to get into the diet of pregnant mothers and young children. In other words, if there are few fish in the state, there will be few fish advisories but then an important route of mercury exposure is lessened. In many states, local fish is a part of the diet, according to the Minnesota Department of Natural Resources (DNR), three to four million walleye are harvested in the state each year [32] and unlike in neighboring Iowa where the fish advisories are to limit consumption to one meal per week in a few areas of the state, the levels of some fish in Minnesota have mercury levels above 1 ppm and some over 3 ppm, resulting in 63 “Do not eat” fish advisories for lake fish [33]. Although fish advisories may be an imperfect measure for which some of the variance in the numbers is due to numerous other variables, it is based directly on a systematic method of careful monitoring and is based on direct measures of mercury contamination.
Although the number of fish advisories does not usually change a great deal from year to year, we decided to use the fish advisory levels in place at a time when many of the school age children being counted for ASD would have been in the womb. We did so because (as reviewed above) research has demonstrated that the biggest threat to neural development comes from prenatal exposure, and that the risk is greater to developing fetus and the very young. We focused on fish advisory data from the year 2000. In addition to the total number of fish advisories in a given state, we also considered the presence of statewide fish advisories. A statewide fish advisory for inland water means all fish of at least one species have a level of contamination that may pose a risk throughout the entire state. According to the EPA, in 2000, thirteen states had issued at least one mercury-related statewide fish advisory for all inland waters [30]. The number of statewide fish advisories may have increased as a function of better monitoring since the EPA published its 2000 guidelines. It should be noted that although the number of fish advisories is related the presence of contamination, gauging changes in the level of contamination from one year to next based on fish advisory data is probably not possible. There were 24 states with at least one statewide fish advisory in 2006 [31].
3.2. Control Variables
School resources. It has been argued that differences in prevalence rates may relate to things such as awareness and improvement of a school’s ability to identify cases of ASD [7]. If so, then it might be expected that school resources are playing a role in the differences seen across states. For example, more per pupil spending may lead to lower student to teacher ratios, which may predict better student outcomes, and improve a schools ability to find cases of ASD. On the other hand, perhaps schools with higher numbers of ASD require more per pupil spending. Thus, in an effort to rule out the role of educational resources, we obtained the level of per pupil spending and the student to teacher ratio for each state [34]. It was hypothesized that the predicted relation between ASD state prevalence rate and number of within state fish advisories is due to the chemical contamination, and would remain even after controlling for educational spending and student to teacher ratio.
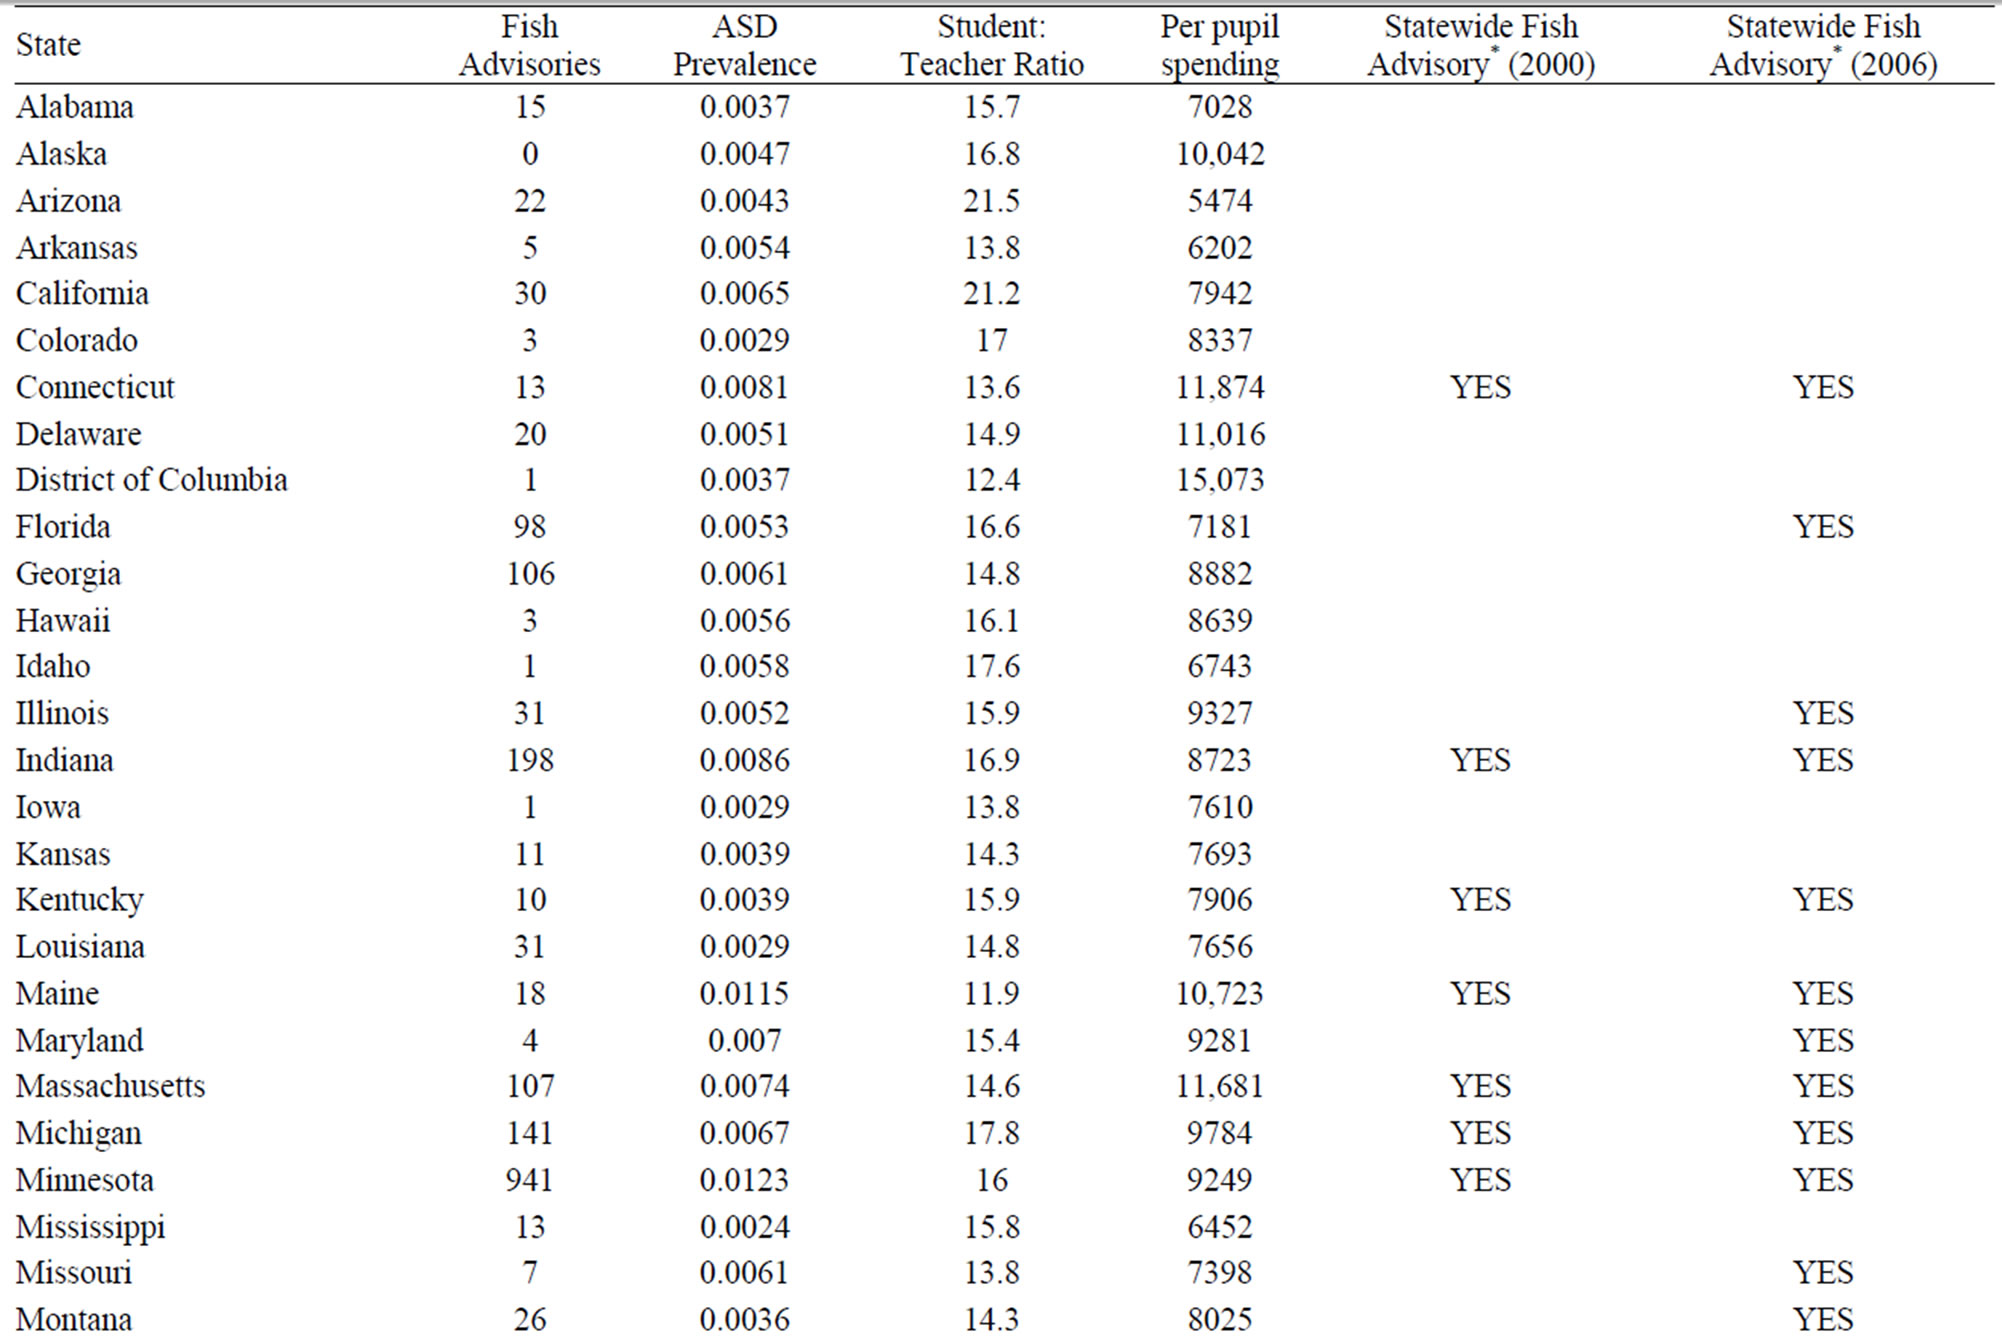
Statistical analysis. For each state in the United States as well as the District of Columbia, the prevalence of autism was entered as the number provided by the state’s Department of Special Education (2006/2007); and total number of mercury fish advisories from the Department of Natural Recourses within a state were entered into SPSS (from the year 2000) and a Pearson correlation was performed. To further examine the link between ASD prevalence and fish advisories, we split states into two groups based on a median split of the number of fish advisories present (Low FA states, n = 26, range of fish advisories 0 to 15; High Fish Advisory states, n = 25, greater than 15 fish advisories). Consistent with the rationale outlined above concerning ASD and mercury, we expected that the effect size between ASD and fish advisories would be stronger for the high fish advisory group compared to the low number of fish advisories group. Whether a state had at least one statewide fish advisory for all inland waters was also entered both for the year 2000 as well as the year 2006. Point-biserial correlations were used to measure the relation between having or not having a statewide fish advisory and prevalence. Hierarchical regression was employed to test for the effect of school resources.
4. Results
4.1. Descriptive Analyses
The mean ASD prevalence rate for the 51 locations (50 states and the District of Columbia) was .0057 (SD = 0.0022, Mdn = 0.0054, range = 0.0023 - 0.0123). The mean number of fish advisories was 55.4 (SD = 146.1, Mdn = 15, range = 0 - 941). The average teacher to student ratio was 15.3 (SD = 2.6, Mdn = 14.9, range = 10.9 - 23.6). The average per pupil spending was $8739.14 (SD = $2023.48, Mdn = $8178.00, range = $5032.00 - $15073.00).
4.2. Correlational Analysis
It was predicted that prevalence of ASD would be related to the number of mercury fish advisories. Consistent with this prediction, a significant relation emerged between ASD prevalence and number of fish advisories, r = 0.48, p < 0.001. States with high prevalence rates have more mercury fish advisories. Based on this relation we can conclude that 23% of the variance in autism prevalence across states can be explained by the number of mercury fish advisories (R2 = 0.23). This represents a moderately large effect size index, but leaves plenty of room for other variables to matter, as would be expected. It should be noted that the variance being accounted for is state by state prevalence rates, and not individual risk of autism.
It was further predicted that the effect size associated with the high mercury fish advisory states would be larger than that associated with the low mercury fish advisory group. The relation between ASD prevalence and number of mercury fish advisories for the low group was indicative of a small effect size, r = 0.22, r2 = 0.05, and the relation between ASD prevalence and number of mercury fish advisories for the high group was indicative of a large effect size, r = 0.59, r2 = 0.35. Thus, in terms of prediction, when using mercury fish advisories to predict ASD prevalence, the high mercury fish advisory group is able to account for 30% more variance in autism prevalence rates across states. Overall, the relation between ASD prevalence rate and number of mercury fish advisories is present across the data set as a whole, but it seems to show a much stronger effect for states with higher number of mercury contamination warnings, which may be states with more recreational fishing and thus more variance associated with this route of exposure.
To further examine the relation between ASD prevalence and number of fish advisories we obtained information on whether or not each state had a statewide fish advisory during the year 2000, and for completeness, the year 2006 as well. We examined the relation between ASD prevalence and statewide fish advisory for each year separately. Because one of the variables was continuous (ASD prevalence) and the other was dichotomous (whether or not each state had a statewide fishing advisory) we computed point-biserial correlations between ASD prevalence and statewide fish advisories for 2000 and 2006. Results indicated a significant relation between ASD prevalence and whether or not each state issued a statewide fishing advisory in 2000, rpb = 0.46, rpb2 = 0.21, t = 3.61, p < 0.001 and the same relationship was found if one used the statewide fishing advisories in 2006, rpb = 0.42, rpb2 = 0.18, t = 3.22, p = 0.002. This finding indicates that ASD prevalence rates for states that did not have a statewide fish advisory in 2000 (M = 0.0051, SD = 0.0018) and 2006 (M = 0.0049, SD = 0.0018) were lower compared to those states that did have such an advisory in 2000 (M = 0.0075, SD = 0.0026) and 2006 (M = 0.0067, SD = 0.0022).
We also examined the relation between statewide fish advisories for 2000 and 2006 using a chi-square test and Cramer’s phi coefficient because the data for each were both dichotomous (nominal scaling). Results indicated a significant chi-square test, χ2 = 15.71, p < 0.001, φ = 0.56, φ2 = 0.31. Essentially, this test suggests that although there was some change in which states had statewide fish advisories, they were in actual fact a similar group of states: those states that had at least one statewide fish advisory for all inland waters in 2000 were more likely to also have a statewide fish advisory in 2006.
4.3. Hierarchical Regression Analyses
It was predicted that the relation between ASD prevalence and number of mercury fish advisories would remain even after controlling for the state’s average student to teacher ratio and per pupil spending. To examine this prediction we conducted a hierarchical regression analysis using ASD prevalence as the criterion. In the first step we entered the two control variables (student to teacher ratio and per pupil spending). In the second step we entered number of mercury fish advisories. Results indicated that the control variables contributed significantly to the level of ASD prevalence, r = 0.40, r2 = 0.16, F(2,48) = 4.68, p = 0.014. Examination of the coefficients indicated that per pupil spending contributed significantly to the prediction of ASD prevalence, t = 2.82, p = 0.007, while student to teacher ratio did not relate. The association of spending to ASD levels could equally be interpreted as an increase in expenses caused by the financial pressures of more special needs children in the system, or as more funding allowing greater identification of such children. Of particular import for the purposes of this paper, results indicated that the number of mercury fish advisories added significantly to the prediction of ASD prevalence, R = 0.58, R2 = 0.34, ΔR2 = 0.18, F(1,47) = 12.52, p = 0.001, see Table 1. Thus, as predicted, the addition of number of mercury fish advisories contributed significantly to the prediction of ASD prevalence, t = 3.54, p = 0.001, even after controlling for student to teacher ratio and per pupil spending. Another way of stating this result, the level of fish advisories in a state accounted for an additional 34% of the variance in state prevalence rates over and above the differences due to spending and student to teacher ratio differences.
5. Discussion
The question of whether some or all of the increase in autism prevalence is due to diagnostic changes has led to a bitter debate within the autism research community. Perhaps the reason the debate has gotten intense is that an actual increase has rather profound implications: if the true incidence is increasing, or has increased, then there is something environmental causing it. Although autism is strongly genetic (heritability estimates have been estimated to be as high as 90%), the gene pool does not change this fast. If a change in prevalence happens over the course of one generation, the answer has to lie elsewhere, such as macrolevel environmental changes interacting with individual level genetics [35]. There is no contradiction in heritability being high in terms of individual risk but having change in the observed frequency all due to environmental changes, such a situation is likely happening with tendency towards heaviness running in families. The secular increase in prevalence of childhood obesity can be all due to macrolevel changes in typical diet and exercise levels over the past decades,
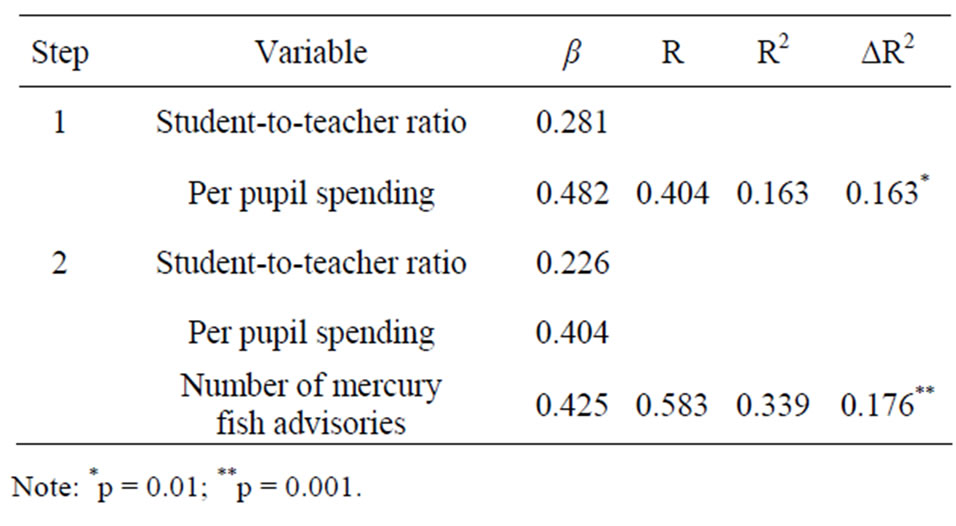
Table 1. Hierarchical regression analysis of number of mercury fish advisories on autism spectrum disorder prevalence controlling for teacher-to-student ratio and per pupil spending.
even with tendency to heaviness having a significant genetic influence.
Several studies have now found that differences in prevalence even at the same time are not random—that is they appear to vary in relation to prenatal exposure to one or more toxins [5]. In this paper, we report that within the Unites States the prevalence rates of individual states varies with the presence of a key indicator of what is usually considered to be the primary route for mercury to get into the bloodstream of women: mercury contaminated fish [36].
Fish advisories in a state are a far from perfect index of total mercury exposure. We agree that many people eat tuna and swordfish and other species high in mercury that are not related to the local fish. This may be why the correlation is not higher, and the r2 of 0.23 leaves plenty of room for other variables to play a role: over 75% of state by state variation remains unaccounted for. However, the possibility that the correlation between state autism level and fish advisories is due to chance is reflected in the probability value of p < 0.001, meaning the chance the effect found is a coincidence is less than 1 in 1000.
On the other hand, some individual state characteristics are of interest, but could certainly be coincidence. Minnesota has the highest level of Autism and the mercury level in the popular Walleye has the highest average levels of mercury contamination of any freshwater fish in the United States [36]. Just north of the Minnesota border is Wobigoon—English River system, where an extreme cases of mercury pollution occurred in Kenora, Ontario, less than 50 miles from the Minnesota border. In 1970, all fishing was banned. The levels of mercury in healthy looking walleye were 20 ppm—this is a range similar to the levels of the fish that were found in Minamata, Japan (and resulted in Minamata Disease—mercury poisoning). In Kenora, it was the native Indians who ate fish year round and developed symptoms of acute mercury poisoning while the population of mentally retarded persons later increased [15]. Future research should attempt to discover if symptoms of the lesser-affected later-born children in areas known to have resulted Minamata disease showed any symptoms of autism.
Another issue that remains unexplained is that increases in Autism rate do not appear to match up with the time of the acute mercury poisonings (such as Minamata Japan in the 1960’s, or Kenora, Ontario in the 1970’s) but rather any increase appears to have occurred a decade or more later. Future research should consider this, as no clear explanation is apparent. Perhaps the higher levels had to be present for several years before a pregnancy occurred to affect an unborn child, though this is not consistent with animal data. Is it possible for placental functioning to be altered or that the ability to eliminate mercury is altered permanently in those exposed to mercury at a young age? Is there any mechanism whereby early life exposure could permanently alter ability to effectively deal with heavy metal burden? Could a young child’s early exposure have the effect of increasing her mercury levels in later life? If so, this would be a mechanism that could ultimately explain a delayed effect. Such questions remain unanswered and are purely speculative. Further research is needed.
These data do not explain individual risk in autism, but point to a variable that might explain some of the observed prevalence differences. The variance accounted for as reported in the results refers to differences in prevalence across states and does not directly address an individual’s susceptibility to develop autism, for which a large percentage of the variance would be likely relate to genetic factors. These data, like the Palmer et al. data, suggest that environmental exposure to certain toxins may increase the net number of persons who develop autism within a population.
Although the link between fish advisories and autism rates is strong and unlikely to be due to chance, it could be caused not by mercury, but could be caused by a third variable related to industry and pollution. For example, areas that have mercury contamination might also have a lot of lead or PCB contamination. Any toxin could be causing the relationship between urban areas, living near polluting sources and higher autism rates. The data sets used are all publicly available for the year we report as well as additional years, and the data sets used in this report are included in an appendix. Future research can check additional years and additional control variables, our analyses suggested particular year chosen did not matter. We have not proved a cause and effect mercury - autism connection, but are reporting a strong correlation between the rate of Autism and a measure of environmental toxins. If anything, we think that exposure to heavy metal toxins in pregnancy or early childhood may be leading to specific changes in the developing brain or body that could play a role in setting the stage for later autism in individuals predisposed. Future research is needed.
REFERENCES
- D. C. Rimm and J. W. Somervill, “Abnormal Psychology,” Academic Press, Waltham, 1977, pp. 315-318.
- J. Merrick, I. Kandel and M. Morad, “Trends in Autism,” International Journal of Adolescent Medicine and Health, Vol. 16, No. 1, 2004, pp. 75-78. doi:10.1515/IJAMH.2004.16.1.75
- C. Gillberg, M. Cederland, K. Lamberg and L. Zeijlon, “The Autism Epidemic: The Registered Prevalence of Autism in a Swedish Urban Area,” Journal of Autism and Developmental Disorders, Vol. 36, No. 3, 2006, pp. 429- 435. doi:10.1007/s10803-006-0081-6
- H. O. Atladottir, D. Schendel, S. Dalsgaard, P. H. Thomsen and P. Thorsen, “Time Trends in Reported Diagnoses of Childhood Neuropsychiatric Disorders: A Danish Cohort Study,” Archives of Pediatrics and Adolescent Medicine, Vol. 161, No. 2, 2007, pp. 193-199. doi:10.1001/archpedi.161.2.193
- A. Kamer, R. Diamond, Y. Inbar, G. W. Zohar, D. Youngmann and A. H. Senecky, “A Prevalence Estimate of Pervasive Developmental Disorder among Immigrants to Israel and Israel Natives—A File Review Study,” Social Psychiatry and Psychiatric Epidemiology, Vol. 39, No. 2, 2004, pp. 141-145. doi:10.1007/s00127-004-0696-x
- Y. Hoshino, Y. Tachibna, H. Watanabe, R. Kumashiro and M. Yashima, “The Epidemiological Study of Autism Fukushima-Ken,” Folia Psychiatric Neurology Japan, Vol. 36, 1982, pp. 115-124.
- J. G. Gurney, M. S. Fritz, K. L. Ness, P. Sievers, C. J. Newschaffer and E. G. Shapiro, “Analysis of Prevalence Trends of Autism Spectrum Disorder in Minnesota,” Archives of Pediatrics and Adolescent Medicine, Vol. 157, No. 7, 2003, pp. 622-627. doi:10.1001/archpedi.157.7.622
- M. Yeargin-Allsopp, C. Rice, T. Karapurkar, N. Doernberg, C. Boyle and C. Murphy, “Prevalence of Autism in a US Metropolitan Area,” Journal of the American Medical Association, Vol. 289, No. 1, 2003, pp. 49-55. doi:10.1001/jama.289.1.49
- C. Rice, “Prevalence of Autism Spectrum Disorders— Autism and Developmental Disabilities Monitoring Network, Six Sites, United States, 2000,” Surveillance Summaries, Vol. 56, 2007, pp. 1-11.
- C. Rice, “Prevalence of Autism Spectrum Disorders— Autism and Developmental Disabilities Monitoring Network, 14 Sites, United States, 2002,” Surveillance Summaries, Vol. 56, 2007, pp. 12-28.
- E. Fombonne, “The Prevalence of Autism,” Journal of the American Medical Association, Vol. 289, No. 1, 2003, pp. 87-89. doi:10.1001/jama.289.1.87
- Thoughtful House Center for Children, “Graphing IDEA Professional 2008, Fighting Autism, Austin, TX,” 2008. http://www.fightingautism.org/idea/
- Centers for Disease Control and Prevention, “Prevalence of Selected Developmental Disabilities in Children 3 - 10 Years of Age: The Metropolitan Atlanta Developmental Disabilities Surveillance Program,” MMWR Surveillance Summaries, Vol. 45, 1996, pp. 1-14.
- Environmental Protection Agency, “Fact Sheet on Utility Air Toxics Report to Congress,” 1998. http://www.epa.gov/ttn/atw/combust/utiltox/utilfs.pdf
- P. A. D’Itri and F. M. D’Itri, “Mercury Contamination: A Human Tragedy,” John Wiley & Sons, New York, 1977.
- K. Murata, P. Weihle, S. Araki, E. Budtz-Jorgensen and P. Grandjean, “Evoked Potentials in Faroese Children Prenatally Exposed to Methylmercury,” Neurotoxicology and Teratology, Vol. 21, No. 4, 1999, pp. 471-72. doi:10.1016/S0892-0362(99)00026-4
- F. Debes, E. Budtz-Jorgensen, P. Weile, R. F. White and P. Grandjean, “Impact of Prenatal Methylmercury Exposure on Neurobehavioral Function at Age 14 Years,” Neurotoxicology and Teratology, Vol. 28, No. 5, 2006, pp. 536- 547. doi:10.1016/j.ntt.2006.02.005
- M. N. Reed, K. M. Banna, W. C. Donlin and C. Newland, “Effects of Gestational Exposure to Methylmercury and Dietary Selenium on Reinforcement Efficacy in Adulthood,” Neurotoxicology and Teratology, Vol. 30, No. 1, 2008, pp. 29-37. doi:10.1016/j.ntt.2007.10.003
- E. M. Paleltz, M. C Craig-schmidt and C. Newland, “Gestational Exposure to Methylmercury and n-3 Fatty Acids: Effects of High and Low Operant Behavior in Adulthood,” Neurotoxicology and Teratology, Vol. 28, No. 1, 2006, pp. 59-73. doi:10.1016/j.ntt.2005.11.003
- C. Griffiths, A. McGartland and M. Miller, “A Comparison of the Monetized Impact of IQ Decrements from Mercury Emissions,” Environmental Health Perspectives, Vol. 115, No. 6, 2007, pp. 841-847. doi:10.1289/ehp.9797
- L. Trasande, P. J. Landrigan and C. Schechter, “Public Health and Economic Consequences of Methyl Mercury Toxicity to the Developing Brain,” Environmental Health Perspectives, Vol. 113, No. 5, 2005, pp. 590-596. doi:10.1289/ehp.7743
- R. F. Palmer, S. Wood and R. Blanchard, “Proximity to Point Sources of Environmental Mercury Release as a Predictor of Autism,” Health & Place, Vol. 15, No. 1, 2009, pp. 18-24. doi:10.1016/j.healthplace.2008.02.001
- B. Herut, E. Shefer and Y. Cohen, “Environmental Quality of Israels’s Mediterranean Coastal Waters in 2001,” Annual Report of the National Marine Environmental Monitoring Program (IOLR Report H29.2002a), 2002. http://www.sviva.gov.il/Enviroment/Static/Binaries/index_pirsumim/ p0125eng_1.pdf
- Y. Hoshino, Y. Tachibna, H. Watanabe, R. Kumashiro, M. Yashima and H. Furukawa, “Early Symptoms of Autistic Children and Its Diagnostic Significance,” Folia Psychiatric Neurology Japan, Vol. 36, 1982, pp. 367-374.
- H. Haga and N. Miyamoto, “Epidemiological Study of Autistic Children in Kyoto-Fu,” Japanese Journal of Child Psychiatry, Vol. 12, 1971, pp. 160-166.
- K. A. Bjornberg, M. Vahter, G. K. Peterson, A. Glynn, S. Cnattingius, P. O. Darnerud, S. Atuna, M. Aune, W. Becker and M. Berglund, “Methly Mercury and Inorganic Mercury in Swedish Pregnant Women and in Cord Blood: Influence of Fish Consumption,” Environmental Health Perspectives, Vol. 111, 2003, pp. 637-641. doi:10.1289/ehp.5618
- Environmental Protection Agency, “Mercury Study Report to Congress,” Executive Summary, Vol. 1, Office of Air Quality Control Planning and Standards and Office of Research and Development, Washington DC, 1997.
- National Atmospheric Decomposition Program, “MDN Concentration and Decomposition Maps,” 1997. http://nadp.sws.uiuc.edu/mdn/maps/
- A. H. Stern and A. E Smith, “An Assessment of the Cord Blood: Maternal Blood Methylmercury Ratio: Implications for Risk Assessment,” Environmental Health Perspectives, Vol. 111, 2003, pp. 1465-1470. doi:10.1289/ehp.6187
- Environmental Protection Agency, “Guidance for Assessing Chemical Contaminant Data for Use in Fish Advisories, Volume 1 Fish Sampling and Analysis,” 2000. http://water.epa.gov/scitech/swguidance/fishshellfish/tech guidance/risk/upload/2009_04_23_fish_advice_volume1_ v1cover.pdf
- Environmental Protection Agency, “2005/2006 National Listing of Fish Advisories Fact Sheet,” Document No. EPA-823-F-07-003, Office of Water, Washington DC, 2007.
- Minnesota Department of Natural Resources, “News Releases DNR fishing by the numbers,” 2008. http://news.dnr.state.mn.us/index.php/2008/05/08/dnr-fishing-by-the-numbers/
- Minnesota Department of Health, “Fish Consumption Guidelines for Women who are or May Become Pregnant, and Children under Age 15,” 2008. http://www.health.state.mn.us/divs/eh/fish/eating/lakespecpop.pdf
- National Education Association Research Estimates Database, 2006. http://www.nea.org/ edstats/index.html
- C. P. Lawler, L. A. Croen, J. K. Grether and J. Van de Water, “Identifying Environmental Contributions to Autism: Provocative Clues and False Leads,” Mental Retardation and Developmental Disabilities Research Reviews, Vol. 10, No. 4, 2004, pp. 292-302. doi:10.1002/mrdd.20043
- K. Mahaffey, R. P. Clickner and C. C. Bodurow, “Blood Organic Mercury and Dietary Mercury Intake: National Health and Nutrition Examination Survey, 1999 and 2000,” Environmental Health Perspectives, Vol. 112, 2004, pp. 562-570. doi:10.1289/ehp.6587
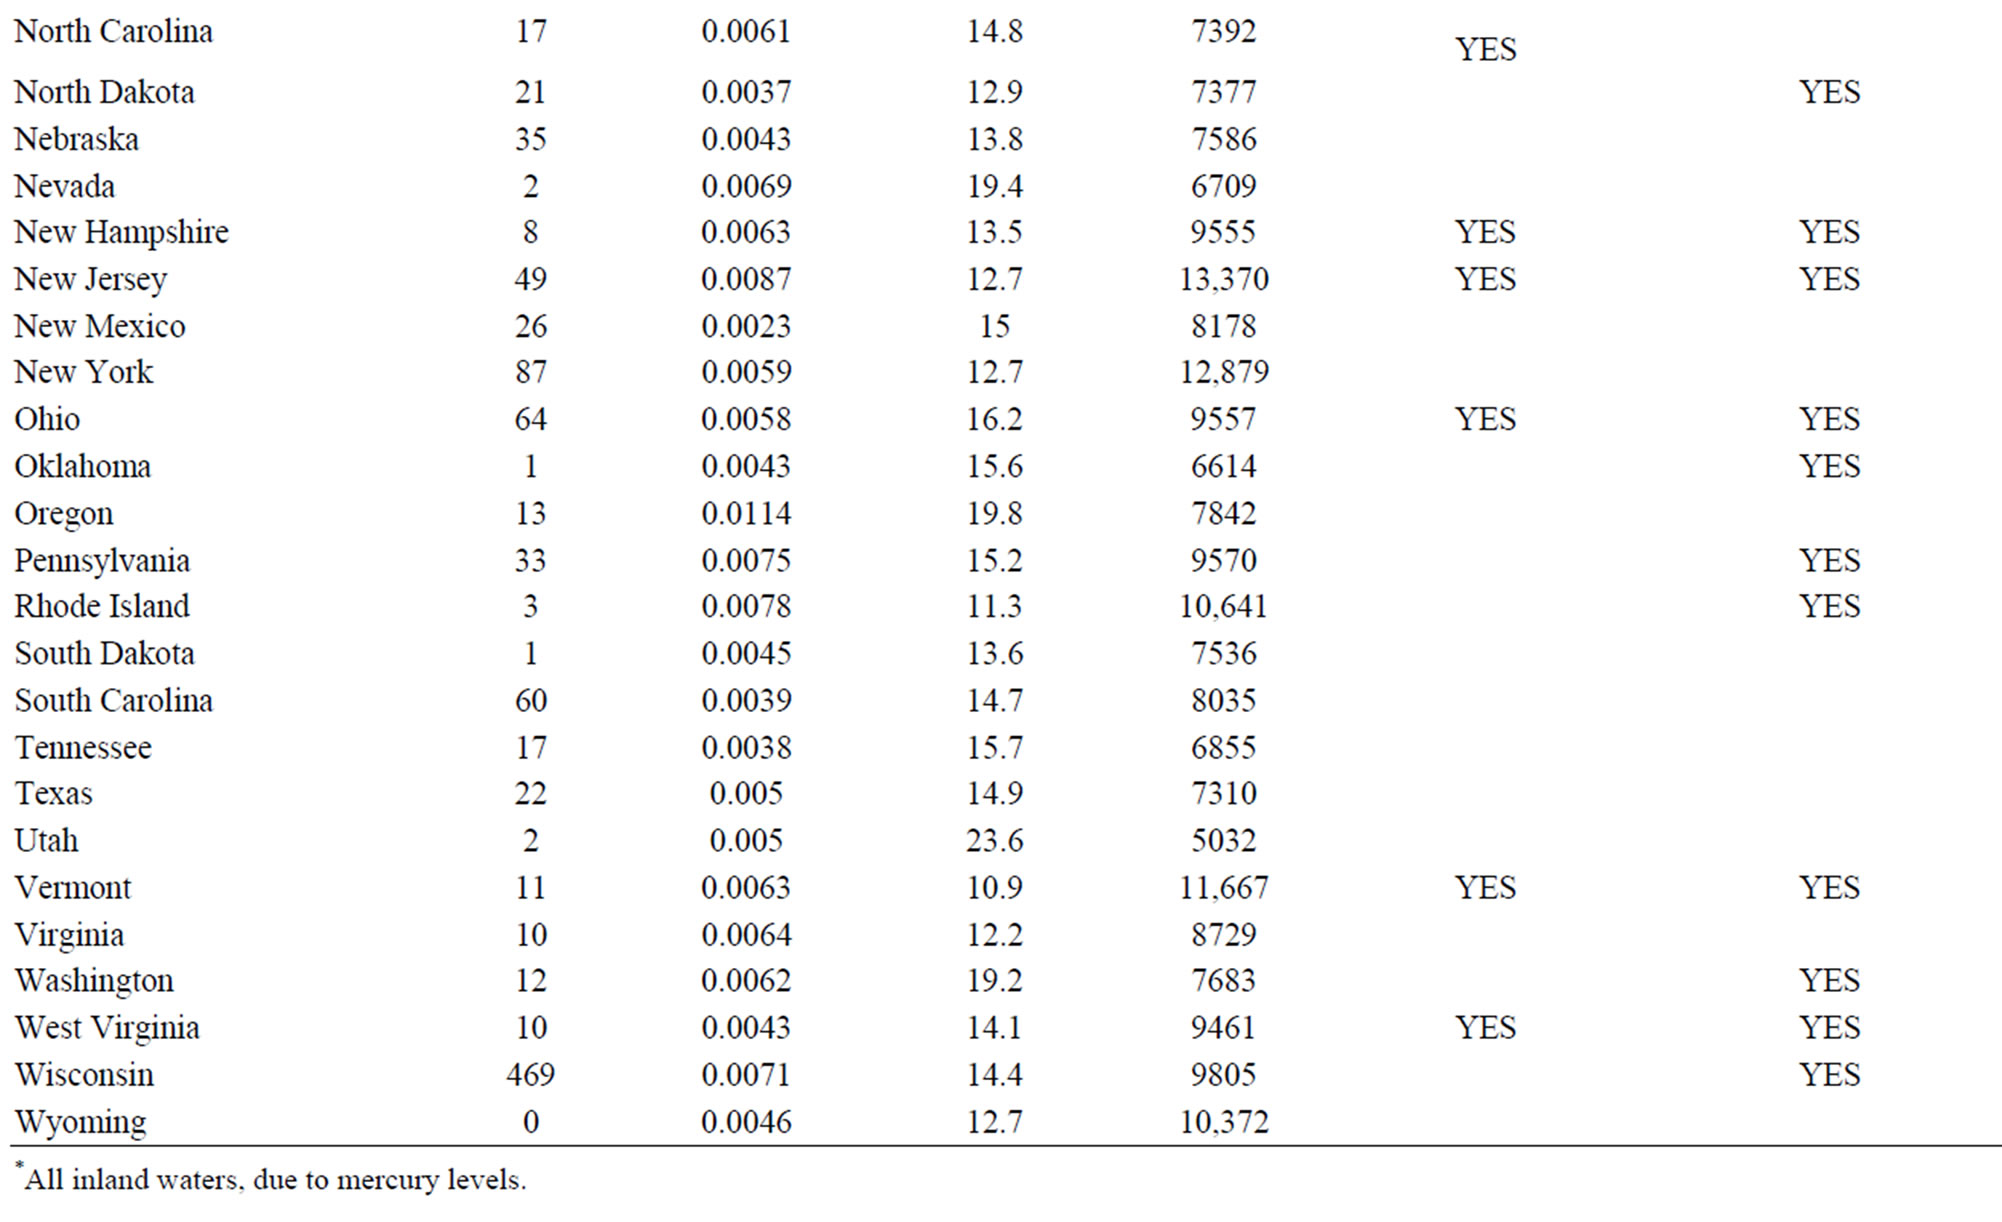
Appendix A
NOTES
*Corresponding author.