Journal of Environmental Protection
Vol. 3 No. 1 (2012) , Article ID: 16857 , 9 pages DOI:10.4236/jep.2012.31015
System Dynamics Modeling of Dumpsite Leachate Control in Ogbomosoland, Nigeria
![]()
1Department of Civil Engineering, Ladoke Akintola University of Technology, Ogbomoso, Nigeria; 2Department of Civil Engineering, University of Ibadan, Ibadan, Nigeria; 3Department of Agricultural and Environmental Engineering, University of Ibadan, Ibadan, Nigeria.
Email: soojoawo@lautech.edu.ng
Received August 19th, 2011; revised September 27th, 2011; accepted October 28th, 2011
Keywords: System Dynamics; Dumpsite; Leachate; Pollution; Ogbomosoland
ABSTRACT
Leachate pollution from landfills is a major source of environmental hazard in many Nigerian municipalities and there is the need to mitigate its effects. The aim of this study is to examine the leachate pollution and determine the effectiveness of liner system in leachate management of dumpsites in Ogbomosoland. The method of modeling using principles of system dynamics was employed to determine the interrelationships of leachate generation components for 50 years. Causal loops indicating the linkage of population, economic status, waste generation per capita and weather conditions to wastes and leachate generation were developed. A set of state model equations for Gas Produced (Gp), Precipitation (Pt), Degradation water-loss (Wg), Leachate Quantity (LQn), were formulated. Leachate management strategies of liner systems were studied, and the effectiveness of Compacted Clay (CC), High Density Polyethylene (HDPE), Low Density Polyethylene (LDPE), Geosynthetic Clay (GC), Silt (SI), Sandy loam (SL), and Sand (SA) liners were examined. A user-friendly computer program for estimating leachate generation per time and breakthrough time for liners was then developed. The results showed that a direct relationship exists between leachate and Gp, Pt, Wg and LQn. Average leachate breakthrough times for the liners, in years, were CC (41.5), HDPE (14.0), LDPE (10.0), GC (1.1), SI (0.1), SL (0.01), and SA (0.00002). In conclusion, dumpsite leachate pollution was established as having negative effects on the groundwater resource. Compacted Clay liner is therefore recommended for use in curtailing its menace.
1. Introduction
Models are versatile management tools in water resources issues [1]. Traditional forecasting methods for solid waste generation frequently count on the associated factors on a per capita basis but the dynamic properties in the processes of solid waste generation and leachate production cannot be fully characterized in those model formulations [2]. Time series forecasting, one of the alternatives to static models, is an approach in which the future forecast are derived from current forecasts of the independent variables themselves [3]. To implement the traditional statistical forecasting methods, it would require collecting thorough information/data before the forecasting analysis can be performed. In many cases like in the study area, municipalities might not have sufficient budget and management capacity to maintain a complete database of wastes/leachate generation and management on a long-term basis, hence the need for a dynamic model.
While the traditional statistical forecasting models have structures which are expressions of an illustration of trend extension in order to verify the inherent systematic features, the dynamic modeling has a promising approach for handling forecasting issues under uncertainty. The dynamic models were developed simply to resolve the data scarcity issue [4]. System dynamics model is particularly designed for handling situations in which only limited data are available for forecasting practice. As a modeling method, system dynamics is mainly suited to the simulation of complex systems such as wastes/ leachate generation and management [5]. With the insufficient database to support the traditional statistical forecasting and the rest static models analyses, the system dynamics model could integrate those separate dynamic efforts by accounting for the interrelationships among relevant features for municipal solid waste problems. System dynamics model is therefore a tool which has been employed severally in areas which include global environmental sustainability [6-8]; waste management [9,10] and environmental management [11,12].
The control of leachate can be accomplished in two major ways. One is by preventing the precipitation from entering the refuse by an appropriate cover. The other one, a more realistic approach is the containment/barrier and collection system [13]. Since it may be practically impossible to shield landfill dumps totally from precipitation, the leachate containment concept is generally embraced. This concept is premised on liner systems. Liners for leachate management constitute a barrier system intended to limit contaminant migration into the surrounding environment to levels that will result in negligible impact [14]. The liners effectively create a bathtub in the ground and may range from a thick natural clay deposit, to engineered liner systems involving one or more Geomembranes (GM) and/or Compacted Clay Liner (CCL) or Geosynthetic Clay Liner (GCL). The primary objective of the liner barrier system design however, is to minimize the escape of contaminants to groundwater and in particular, to any underlying aquifer. Bottom liners of landfills may contain one or more layers of clay or a synthetic flexible membrane (or a combination of these).
This central aim of this study is to control leachate pollution emanating from dumpsites in the Ogbomosoland with a view to mitigating its negative effects. There are five Local Government Areas (LGAs) in the study area. These are: Ogbomoso North and South representing the urban LGAs and Oriire, Ogo-Oluwa and Suurulere LGAs which have rural settings.
2. Methodology
The main Governing Equations employed are the following:
1) For leachate Production [14]
 (1)
(1)
2) For leachate Management [15]
 (2)
(2)
where LQnT = Accumulative amount of leachate generated from the system;
nΔt = No of waste cells at the given time;
W4 = Overall mass of water entering or leaving the dumpsite;
Wg = Total water loss due to degradation;
LQn = Overall leachate quantity generated from a single cell;
n & i = Counters;
t = Breakthrough time of the liner;
d = Thickness of the liner;
α' = Effective porosity;
K = Coefficient of permeability and;
h = Hydraulic head.
2.1. Leachate Production Sector
The primary sources of leachate inputs [16,17] and [18] are:
1) Moisture content of the waste;
2) Precipitation (rainfall);
3) Water components of the waste.
The primary outputs emanating from the process [15] are:
1) Evaporation;
2) Gas production;
3) Biodegradation leading to leachate.
The Primary Leachate (PL) concept:
If the moisture content of the waste is γ, γ varies between 40% - 44% [15].
Thus
 (3)
(3)
Then, the initial dry weight (DW) of the MSW is
 (4)
(4)
Decomposition gas production concept:
According to [19], the total amount of gas expected to be produced is
 (5)
(5)
Gp = gas produced (m3/ton of MSW);
C = the total organic content (TOC) kg/ton of MSW. C is taken as 60% - 90% of Gn. for rural and 30% - 59% for urban communities [20];
T = Temperature in Centigrade.
According to [21], the model for gas generation rate increases and then decreases as formulated below:
 (6)
(6)
 (7)
(7)
where G1 and G2 are volumes of gas produced prior to time t1/2 and after t1/2 respectively;
k1 and k2 are decay constants and t1/2 is the time taken for half of total gas production to occur.
Water lost to waste decomposition:
Water losses are mainly due to decomposition and vapour [16]. According to [14], the chemical reaction for waste decomposition is:
 (8)
(8)
Using Equation (8)The amount of water consumed per unit weight of MSW (CaHbOcNd) is
 (9)
(9)
Water Consumption:
Taking into account the rate of gas production, the water consumption is
 (10)
(10)
where W1 = mass of water consumed per cubic meter of gas produced;
a, b, c, d are determined from chemical analysis of the MSW.
Thus, at any given time, The amount of water consumed (W2) is W2 = W1 * G1(11a)
W3 = W1 * G2(11b)
The dry weight of SW at any given time is
 (12)
(12)
where μ = overall gas density.
Precipitation and evaporation:
 (13)
(13)
where Pt = effective precipitation (mm);
P = total precipitation (mm);
C1 = run-off coefficient.
Evaporation is given as Ea = cf * Ep(14)
Ea and Ep are actual and pan evapotranspiration (mm) respectively and cf is a correction factor.
Thus the overall mass of water (kg) entering or leaving the dumpsite is given as
 (15)
(15)
where A (mm2) is the surface area of waste receiving rainfall and subject to evaporation.
Total amount of H2O lost through waste degradation process, Wg
The amount of water lost as vapour during gas generation is assumed to be 0.01 kg per cubic meters of gas produced [16]. Therefore, the total amount of water lost through waste degradation process is
 (16)
(16)
The overall leachate quantity at time t for a single cell excluding infiltration/evaporation
The water balance in waste cells during degradation process has three components:
1) Moisture content in excess of field capacity;
2) Water consumed in gas generation and water lost as gas saturated vapour and;
3) Water entering/leaving the dumpsite due to infiltration and evaporation. Therefore, from the use of the following boundary conditions.
At t = 0FC (0) = γ
1 – γ
At t = t + Δt

The overall leachate quantity at time t for a single cell is estimated from
 (17)
(17)
Note: FC = Field Capacity.
Accumulative amount of leachate:
The accumulative amount of leachate as the waste degeneration operation progresses with time can be determined by the superposition of results of Equation (17) and the resultant effect of infiltration as:
 (18)
(18)
2.2. Leachate Management Sector
Liner systems of leachate management were applied in this study. Seven (7) different types of liner containments were examined. These are: Compacted Clay (CC); High Density Polyethylene (HDPE); Low Density Polyethylene (LDPE); Geosynthetic Clay (GC); Silt (SI); Sandy Loam (SL); and Sand (SA). The properties studied in these liners were:
1) Hydraulic conductivity;
2) Porosity;
3) Permeability (iv) Thickness and (v) Maximum slope.
Breakthrough time (t) of liners:
Liners were characterized using breakthrough time. This is the time taken for leachate to penetrate a liner before contaminating the underground water. The breakthrough time (t) of liners was predicted from the following equation [22]:
 (19)
(19)
where d = thickness of the liner (m);
α' = effective porosity;
K = coefficient of permeability (m/s).
Leakage rate through liners, qi:
The leakage rate through the liners, qi as given by [22] is determined from:
 (20)
(20)
where Kl = the saturated vertical hydraulic conductivity of the liner (m/s);
d = liner thickness (m);
φ = the liner slope (measured in angles);
y = the leachate depth over liner (m).
3. Computer Programming and Simulation
The model equations were coded in the Visual Basic language. The key elements of the model were defined and quantified as variables. These variables include precipitation, moisture content, pan evaporation, temperature and percent organic content. Their relationships were formulated mathematically and the system dynamics structures applied in developing the source codes. Once the parameters and the initial values for the State Variables (Stocks) were specified, the model became definitively determined through the program.
The stock flow diagram of the system was designed using STELLA 9.0 software and simulation package. The principles of system dynamics were applied to determine the interrelationships of wastes and leachate components. These were simulated to predict the results for the next 50 years using year 1991 data as initial values in the stocks of the flow diagram. Causal loops indicating the linkage of population, economic status, waste generation per capita and weather conditions to wastes and leachate generation were developed. Figure 1 shows the STELLA flow diagram of the model. The figure connects the key variables like precipitation, population, moisture contents etc to their main outputs which include accumulated amount of leachate and total gas generated. It also shows the inter relationships of the seven (7) selected liners with the entire system.
Model validation The model validation is considered necessary so as to compare the model results with historical data, and to check whether the model generates plausible behaviour. The developed model was validated by applying it in solving the practical problems of leachate pollution in the 5 LGAs of Ogbomosoland. As shown in Table 1, the key validation data on the wastes and leachate generation sectors were those on temperature, percent organic content, evapotranspiration and moisture content. Those on the liners were the effective porosity, hydraulic conductivity, coefficient of permeability, liner thickness and liner slope (Table 2).
These data were fed into the model to determine the total amount of wastes and leachates expected to be generated onLGA basis and to identify the most effective liner containment for leachate management in the study area.
4. Results and Discussion
1) Field Capacity, Water Consumption and Primary Leachate Formation As shown in Figure 2 for Ogbomoso North LGA, the field capacity, water consumption during waste decomposition process and the quantity of primary leachates increased with time. A similar trend was witnessed in Ogbomoso South LGA. However, in the rural LGAs, the quantity of water consumed during degradation decreased sharply over time. The changes in field capacity are expressed as the fractions of water in wastes with respect to its dry weight. The field capacity was higher in the urban LGAs perhaps due to considerably lower moisture contents in those areas.
There was a drastic reduction in the amount of water consumed during wastes decomposition for rural LGAs. This is explained as follows: the more the leachates formed, the less the decomposition water needed since the liquid nature of the leachates so produced continues to aid the decomposition process, hence less amount of external water is consumed. Primary leachates were found to be formed at faster rates in urban LGAs compared with the rates in the low-income LGAs. Meanwhile as the primary leachate increase, the accumulative amount of leachate being generated decreases with time. This may be due to degradation water-loss, water consumption due to gas production and the evaporation factor. The 50-yr simulated primary leachates in the urban and rural LGAs were 1.04 × 10⁸ and 1.88 × 10⁸ m3 respectively with the highest quantity of 0.94 × 10⁸ m3 recorded in Ogbomoso North (urban) LGA. The fact that primary leachate is a direct function of population could have been responsible for this development.
2) Simulated Wastes Moisture Content and Leachate Accumulation The relationship between moisture contents and cumulative leachate generated from the model for Oriire LGA is as shown in Figure 3. In all the LGAs, as the moisture content increases, the accumulative leachate quantity decreases with time. This may be anchored on the fact that only the primary leachate, and not accumu lative leachate, is directly related to the moisture content. Similarly, losses such as evaporation and infiltration reduce the accumulative amount of leachate over time. The sharp decrease in the quantity of cumulative leachate with time affirms the claim that its reasonable quantity interact with underground water resources into where it percolates and causes pollution.
After the 50-yr simulation, most of the rural LGAs have higher quantities of accumulative leachate when compared with their urban counterparts. This observation may be linked to the higher organic contents of wastes in rural dumpsites. Thus, as the income increases the putrescible wastes decreases and by extension, the putrescible wastes decreases and by extension, the accumulated leachate decreases. The finding corroborates an earlier observation
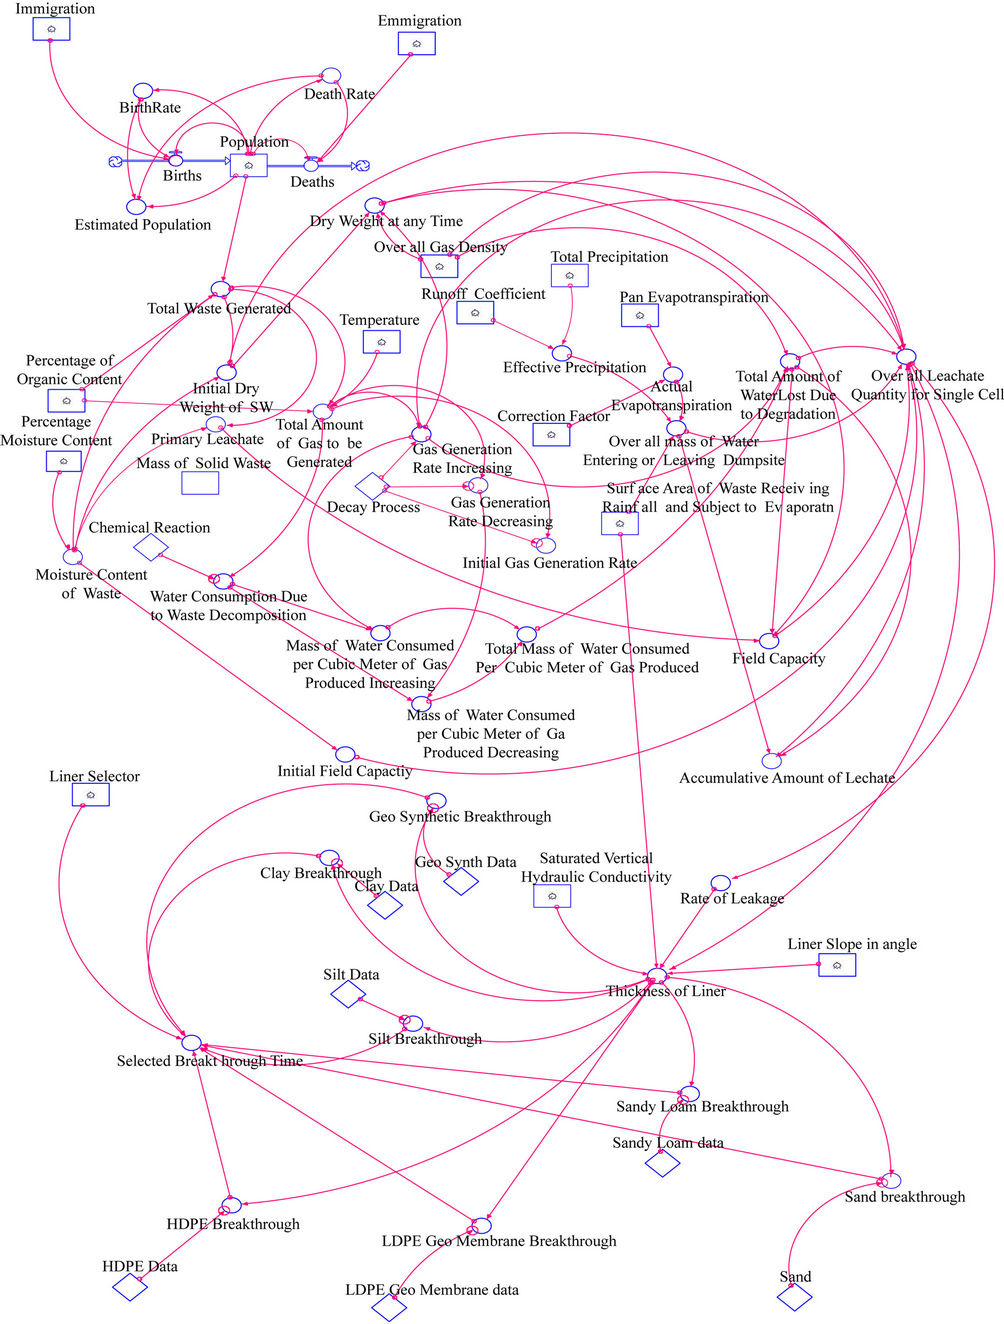
Figure 1. STELLA flow diagram of the system dynamics model for waste/leachate management systems of Ogbomosoland.
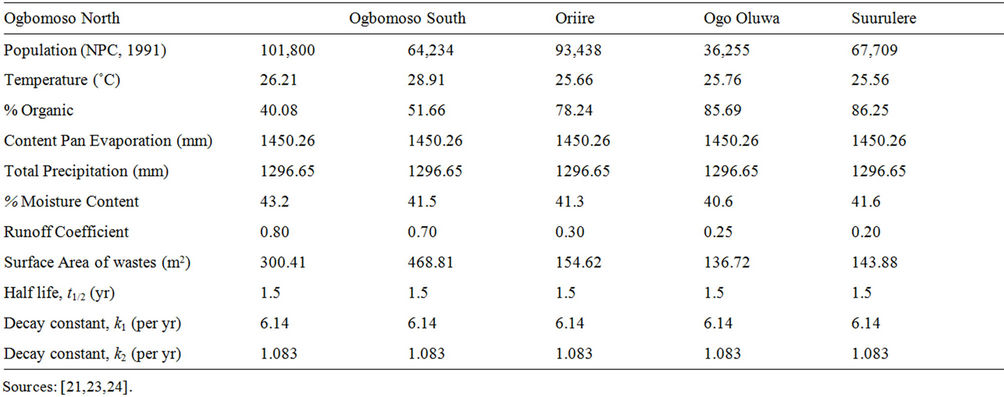
Table 1. Validation data for the wastes and leachate generation sector.

Table 2. Validation data for the leachate management sector.
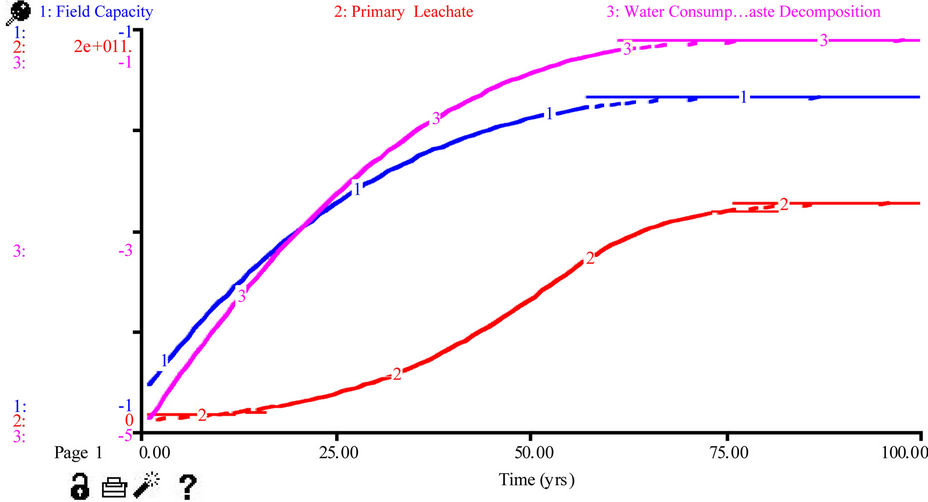
Figure 2. Simulated primary leachate, field capacity and water consumption in Ogbomoso North LGA.
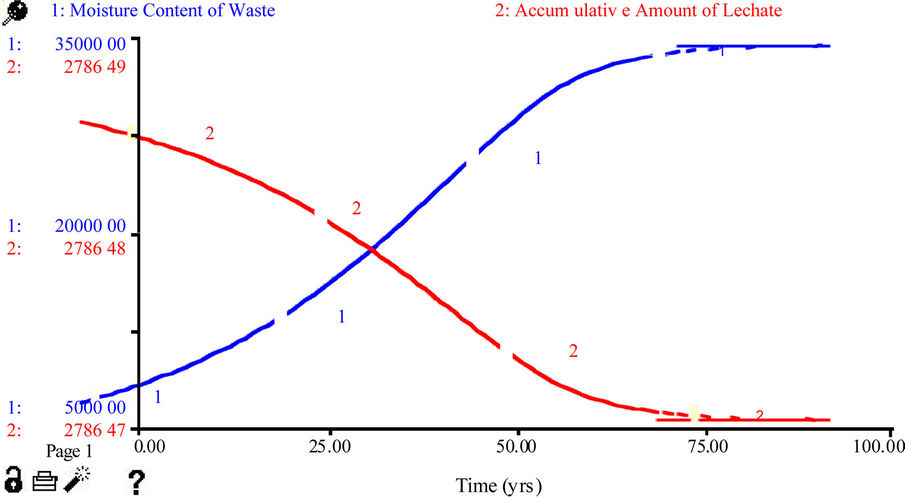
Figure 3. Simulated wastes moisture content and leachate accumulation in Oriire LGA.
that as the income increases the kitchen waste decreases [31]. The projected moisture content after 25years showed that Oriire LGA alone has about 32% of the entire wastes moisture content in the entire system. This explains further, the relatively lower values of field capacity observed in the rural LGAs. However, the simulated cumulative leachate volume generated for high and low income areas were 4.0 × 10⁶ and 2.2 × 10⁶ m3 respectively.
3) Modeling and Simulation on Leachate Management Sector Tables 3 and 4 summarize the values of the simulated breakthrough times of the studied liners. Generally it was observed that the seven liners applied in the leachate management system posses varying retention abilities. When the advection and diffusion phenomena are operational, the background knowledge is that the longer ittakes leachate to penetrate a liner system, the more effective such liner is in the containment and management of leachate pollution, and vice versa. The Simulated breakthrough time of Compacted Clay liner is as presented in Figure 4.
The result showed that it takes leachate the longest period of about 42 years to travel through the Compacted Clay (CC) liner. The approximate respective durations to penetrate other liner materials, in years as presented in Table 4 indicated that though the liners were subjected to same quantities of leachate over the 50 year simulation, the retention ability of the Compacted Clay liner exceeded those of other liners. The geomembrane liners (HDPE, LDPE and GC) also have higher efficiencies, but were not as effective as the CC. The merit of the CC could be based upon its thickness which is usually recommended as 0.6 m (minimum). Silt, Sandy Loam and Sand are however considered as poor liner materials in leachate management.

Table 3. Summary of the breakthrough times for the liners.
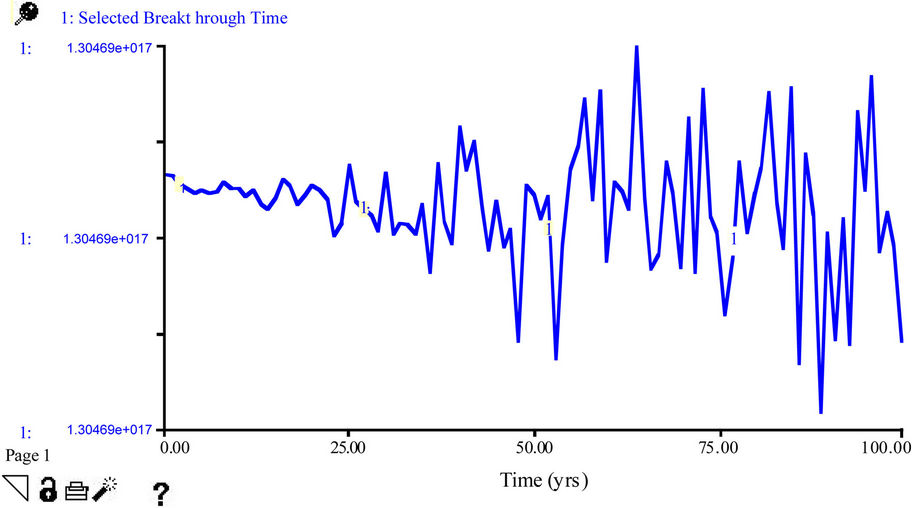
Figure 4. Simulated breakthrough time of Compacted Clay in Ogbomoso North LGA.
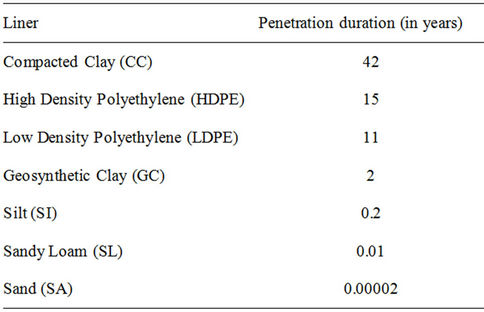
Table 4. Summary of retention capabilities of liners.
5. Conclusions
The accumulated leachates generated decrease with increasing income of the residents in Ogbomosoland. Compacted Clay liner has the longest leachate breakthrough time; it is readily available and affordable. It is therefore found as the best management solution to the leachate pollution in the dumpsites of Ogbomosoland. The developed model is a useful predictive tool for policy making in Solid Waste Management System.
REFERENCES
- O. A. Agbede, “Model as a Management Tool in Water Resources,” Modeling, Simulation and Control, Vol. 19, No. 1, 1989, p. 3.
- B. Dyson and N. B. Chang, “Forecasting Municipal Solid Waste Generation in a Fast-Growing Urban Region with System Dynamics Modeling,” Waste Management, Vol. 25, No. 7, 2005, pp. 669-679. doi:10.1016/j.wasman.2004.10.005
- N. B. Chang, Y. C. Pan and S. D. Huang, “Time Series Forecasting of Solid Waste Generation,” Journal of Resources Management Technology, Vol. 21, No. 1, 1993, pp. 1-10.
- J. L. Deng, “Control Problems of Grey Systems,” System Control Journal, Vol. 1, No. 5, 1982, pp. 2-7.
- S. O. Ojoawo, O. A. Agbede and A. Y. Sangodoyin, “A System Dynamics Modeling Approach for Dumpsite Waste Generation,” Proceedings of the International Conference on Environmental Pollution and Remediation Ottawa, Ontario, 17-19 August 2011, pp. 253-251.
- J. W. Forrester, “World Dynamics,” Wright-Allen Press, Cambridge, 1971.
- D. H. Meadows, D. L. Meadows and J. Randers, “Beyond Limits,” Chelsea Green Publisher, White River Junction, 1992, pp. 23-67.
- A. K. Saysel, Y. Barlas and O. Yengun, “Environmental Sustainability in an Agricultural Development Project: A System Dynamics Approach,” Journal of Environmental Management, Vol. 64, No. 3, 2002, pp. 247-260. doi:10.1006/jema.2001.0488
- S. Ulli-Beer, “Dynamic Interactions between Citizen Choice and Preferences and Public Initiatives—A System Dynamics Model of Recycling Dynamics in a Typical Swiss Locality,” Proceedings of the 2003 International Conference of the System Dynamics Society, New York City, 20-24 July 2003, pp. 25-34.
- B. Dyson and N. B. Chang, “Forecasting Municipal Solid Waste Generation in a Fast-Growingurban Region with System Dynamics Modeling,” Waste Management, Vol. 25, No. 7, 2005, pp. 669-679. doi:10.1016/j.wasman.2004.10.005
- A. N. Mashayekhi, “Rangeland Destruction under Population Growth, the Case of Iran,” System Dynamics Review, Vol. 6, No. 2, 1990, pp. 167-193. doi:10.1002/sdr.4260060204
- V. Sudhir, G. Srinivasan, V. R. Moraleeharan, “Planning for Sustainable Solid Waste Management in Urban India,” System Dynamics Review, Vol. 13, No. 3, 1997, pp. 223-246. doi:10.1002/(SICI)1099-1727(199723)13:3<223::AID-SDR127>3.0.CO;2-Q
- J. T. Pfeffer, “Solid Waste Management Engineering,” Prentice Hall, Upper Saddle River, 1992, pp. 235-249.
- R. K. Rowe, “Geosynthetics and the Minimization of Contaminant Migrationthrough Barrier Systems beneath Solid Waste,” Proceedings of the 6th International Conference on Geosynthetics, Atlanta, 1 March 1998, pp. 24-36.
- E. Safari and C. Baronian, “Modelling Temporal Variations in Leachate Quantity Generated at Kahrizak Landfill,” Proceedings of International Environmental Modeling Software, Passau, 7-9 April 2002, pp. 482-484.
- T. Kadlec and M. Knight, “Leachate Management in Landfills,” Environmental Hydrology, Utrecht, 1996, pp. 94-105.

