Energy and Power Engineering
Vol. 4 No. 4 (2012) , Article ID: 20231 , 13 pages DOI:10.4236/epe.2012.44039
Global Impact of Gas Flaring
Department of Mechanical Engineering, University of Ibadan, Ibadan, Nigeria
Email: os.ismail@ui.edu.ng, meetezaina@hotmail.com
Received May 1, 2012; revised June 5, 2012; accepted June 18, 2012
Keywords: Combustion; Environmental Degradation; Emissions; Flaring; Gas Flaring; Global Warming
ABSTRACT
This work deals with the multi-faceted impact of gas flaring on a global scale and the different approach employed by researchers to measure gas flared and its resulting emissions. It gives an overview of methods employed by these researchers in the oil and gas industry, academia and governments in attempt to determine ways of measuring and reducing gas flaring and its emission drastically. This approach so far includes analytical studies, numerical studies, modeling, computer simulations, etc. the goal behind each study being to mitigate the effects of gas flaring. The outcome indicates that there is a seemingly absence of a single global method, emission factor and estimation procedure used in the oil and gas industry all over the world to determine the volume of gas flared and its emissions be it from complete or incomplete combustion, sweet or sulphur present hydrocarbons and this poses a continuous problem in determining the actual impact of gas flaring and its emissions on human and its role in environmental degradation both at a local and global level. An attempt has also being made to cover up-to-date trends in gas flaring and current developments in some of the most flared countries.
1. Introduction
The impact of gas flaring is of local and global concern. Gas flaring is one of the most challenging energy and environmental problems facing the world today whether regionally or globally. It is a multi-billion dollar waste, a local environmental catastrophe and a global energy and environmental problem which has persisted for decades.
The World Bank has estimated that the annual volume of associated gas being flared and vented is about 110 billion cubic meters (bcm), which is enough fuel to provide the combined annual natural gas consumption of Germany and France. Flaring in Africa (37 bcm in 2000) could produce 200 Terawatt hours (TWh) of electricity, which is about 50 percent of the current power consumption of the African continent and more than twice the level of power consumption in Sub-Saharan Africa with the exception of the Republic of South Africa) [1]. Gas flaring is a common practice in the oil production process globally. Libya for instance flares about 21% of its natural gas, while Saudi Arabia, Canada and Algeria flare 20%, 8% and 5%, respectively. This implies that Nigeria has one of the worst rates of gas flaring in the world. In 2002, Nigeria flared about 76% of its natural gas (Atevure, 2004 cited in [2]).
Gas flaring is commonly used during petroleum refining and chemical processing for safe disposal of waste gases during process upsets, plant start-up or shutdown and process emergencies. Flaring is a high-temperature oxidation process used to burn combustible components, mostly hydrocarbons, of waste gases from industrial operations. Gas flaring is the combustion of associated gas produced with crude oil or from gas fields [3].
The option to release gas to the atmosphere by flaring and venting is an essential practice in oil and gas production, primarily for safety reasons. Flaring is the controlled burning of natural gas produced in association with oil in the course of routine oil and gas production operations. Venting is the controlled release of gases into the atmosphere in the course of oil and gas production operations [4]. Solving the problem of this “nuisance” called venting while ensuring safe operation and to minimize undesirable venting, led to the introduction of flaring [5]. Gas flares are the choice disposal option for handling waste hydrocarbon gases because of their ability to burn efficiently [6].
2. Gas Flaring Emissions
A large number of hydrocarbons are produced when waste oil-gas and oil-gas-water solutions are flared. Flaring is inefficient with combustion being most affected by ambient winds and heating value of the fuel. Inefficient burning releases raw fuel [7]. The efficiency of flares can be dependent on several factors like composition of the flare stream, Flow rate of flare gases, wind velocity, ambient turbulence, presence of hydrocarbon droplets in the flare stream and presence of water droplets in the flare stream [8].
Flaring is a high-temperature oxidation process used to burn combustible components, mostly hydrocarbons, of waste gases from industrial operations. Natural gas, propane, ethylene, propylene, butadiene and butane constitute 95% of the waste gases flared [9]. In combustion, gaseous hydrocarbons react with atmospheric oxygen to form carbon dioxide (CO2) and water. In some waste gases, carbon monoxide (CO) is the major combustible component. During a combustion reaction, several intermediate products are formed, and eventually, most of them are converted to CO2 and water. Some quantities of stable intermediate products such as carbon monoxide, hydrogen, and hydrocarbons will escape as emissions [10].
The quantity of hydrocarbon emissions generated is dependent on the degree of combustion. Theoretically, the combustion processes with complete combustion create relatively innocuous gases such as carbon dioxide and water. However, because the flaring efficiency depends on wind speeds, stack exit velocity, stoichiometric mixing ratios, and heating value, the flaring in reality is rarely successful in the achievement of complete combustion (Leahey and Preston 2001 cited in [11]). Reduced combustion efficiency must be regarded as the norm in any operation with flaring [7].
Also, depending on the waste gas composition and other factors, the emissions of pollutants from flaring may consist of unburned fuel components (e.g., methane and non-methane volatile organic compounds), byproducts of the combustion process (e.g., soot, partially combusted products, CO, CO2, NOx) and sulphur oxides (e.g., SO2).
The goal of flare is to convert, through oxidation, substances in the flare gas stream to their safest form possible. In the case of hydrocarbons, the most desirable products are carbon dioxide and water vapour. Sulphur in compounds like hydrogen sulphide is converted to sulphur dioxide. Other oxides, like the oxides of nitrogen, or partially oxygenized compounds like carbon monoxide or formaldehyde are less desirable. Toxic compounds like poly-nuclear aromatic hydrocarbons, aromatics and volatile organic compounds formed in these diffusion flames may not be fully consumed [8].
3. Impacts of Gas Flaring
The effects of gas flaring under this heading are multifaceted. These effects, have received the most attention and corrective action worldwide. Although the impacts are seen more in developing countries like Nigeria, Angola, Libya etc. where technology for utilization of such energy are only recently just be employed at a snail pace. The impacts on human, the environment and the economy remain that of a global concern. Nigeria and Russia have been mentioned to be the highest gas flaring countries in all the literatures reviewed with more literatures on the Niger Delta region of Nigeria as it concerns these impacts of gas flaring. Current developments in these countries to mitigate the effects of gas flaring have been discussed under trends of gas flaring.
3.1. Environmental Degradation
Environmental issues of gas flaring are generally described in terms of efficiency and emissions [12]. It is widely acknowledged that flaring and venting of associated gas contributes significantly to greenhouse gas (GHG) emissions and has negative impacts on the environment [1].
The environmental problems caused by flaring are mainly global, but to some extent also regional and local. For example, flaring/venting during oil production operations emits CO2, methane and other forms of gases which contribute to global warming causing climate change, and this affects the environmental quality and health of the vicinity of the flares. This negates commitments made by countries under the United Nations Framework Convention on Climate Change (UNFCCC) and Kyoto Protocol [13]. Global environmental impact is due to the burning of associated or solution gas, which produces carbon dioxide (CO2) and methane (CH4). These emissions increase the concentration of greenhouse gases (GHG) in the atmosphere, which in turn contributes to global warming [14].
Gas flaring contributes to climate change, which has serious implications for the world [15]. Gas flaring is a major source of greenhouse gases (GHG) contributing to global warming which could accelerate the problem of climatic change and harsh living conditions on earth, if not checked. Flaring releases carbon dioxide and methane, the two major greenhouse gases. Of these two, methane is actually more harmful than carbon dioxide. It is also more prevalent in flares that burn at lower efficiency. Those less efficient flares tend to have more moisture and particles in them that reflect heat and are said to have similar effect on the ozone layer like aerosols do [16-18]. Of the greenhouse gases researched so far, the global warming potential of a kilogram of methane is estimated to be twenty-one times that of a kilogram of carbon dioxide when the effects are considered over one hundred years [4].
Moreso, flaring may further contribute to local and regional environmental problems, such as acid rain with attendant impact on agriculture, forests and other physical infrastructure [14]. The acid rain which results in environmental degradation including soil and water contamination, and roof erosion. The incineration of sour gas produces sulphur oxides, which are released into the atmosphere. The end result of these compounds when they combine with atmospheric compounds, namely oxygen and water is what is called acid rain, which produces a lot of negative environmental effects [19].
This Local and regional problem is predominant in developing nations like Nigeria where environmentally unethical gas flaring and has contributed significantly to the degradation of the environment in the region. The concentration of acid in rain water appears to be higher in the Niger Delta region and decreases further away from the region [20]. The acid rain caused by gas flaring has altered the vegetation of the Niger Delta area. On a casual observation of the flares in the Niger Delta one sees that they are sooty and are evidently burn at low efficiency [16]. Gas flare sites, which often times are situated close to villages, produce “soot”, which is deposited on building roofs of nearby villages. When it rains, this soot runs off the roofs of building and pollutes the soil and water aquifers of the people [19].
Gas flaring for instance, has negative effects on the immediate environment, particularly on plant growth and wildlife. Augustine et al. [21] researched on the effects of waste gas flares on the surrounding Vegetation In south-eastern Nigeria and concluded that further studies were necessary to determine the effects of the flares on the yield of crop plants grown in the area but the present results indicate that flare effects doubtfully extend beyond a distance greater than 110 m from the stacks, except in the case of suppression of the flowering of short-day plants. Soils of the study area are fast losing their fertility and capacity for sustainable agriculture due to the acidification of the soils by the various pollutants associated with gas flaring in the area [22].
Studies show that gas flaring significantly affects not only the microclimate but also the soil physic-chemical properties of the flare sites (Alakpodia, 2000; Odjugo, 2007 cited in [2]). There is an adverse ecological and bacterial spectrum modification by the gas flaring [23].
Odjugo et al. [2] researched the effect on gas flaring on maize yield size and concluded the sand content of the soil, pH, bulk density, air and soil temperatures increased toward the flare site. For optimum yield of maize within the Niger Delta where gas flaring is taking place, a recommended that maize must not be cultivated within 2 km of the bund wall of the flare sites was made. Research findings show that there is indeed a correlation between environmental variables resulting from gas flaring and the development of certain ailments found in individuals residing in such area.
3.2. Health Implications for Humans
The health impacts of air pollution spreads across a wide area, and those who rely on locally produced food whether from their own production or bought at market, risk contamination [14]. The flares contain widely-recognized toxins, such as benzene, which pollute the air. Local people complain of respiratory problems such as asthma and bronchitis. There have been over 250 identified toxins released from flaring including carcinogens such as benzopyrene, benzene, carbon disulphide (CS2), carbonyl sulphide (COS) and toluene; metals such as mercury, arsenic and chromium; sour gas with H2S and SO2; Nitrogen oxides (NOx); Carbon dioxide (CO2); and methane (CH4) which contributes to the greenhouse gases [17].
Additionally, the US Environmental Protection Agency (EPA) has also stated that exposure to benzene causes acute leukemia and a variety of other blood related disorders in humans. World Bank Information on the adverse effects of particulate matter, suggests that gas flaring from Bayelsa alone, would likely cause on a yearly basis, 49 premature deaths, 4960 respiratory illness among children and 120 asthma attacks [24]. In a sour gas flare many reduced sulphur species are formed. Several including hydrogen sulphide and carbon disulphide are potent toxic chemicals. Exposure to H2S at concentrations below the level it can be smelled is associated with spontaneous abortion. The most common cause of Thyroid cancers is radioactivity. Thyroid cancers have an elevated median rate ratio in those geographic areas with extensive flaring operations [7].
Environmental contaminants have also been related to endocrine dysfunction, immune dysfunction, reproductive disorders and autoimmune rheumatic diseases. Gas flaring causes surrounding communities to suffer from increased health risks including premature deaths, respiratory illnesses, asthma and cancer [25]. Another effect that should be addressed is thermal pollution, since there is a limit to which the human body can tolerate the fluxes released during gas flaring. Furthermore, both habitat and structural buildings nearby also have heat threshold [26].
3.3. Economic Effects
Aside from effects on the environment/host communities, animals, plant life, and human health, gas flaring also impact grossly on the economics of a nation, in terms of the loss of funds and revenue which it could have realized if it had conserved gas instead of flaring same. Nigeria provides an appalling example of such a loss. Oil companies in Nigeria flare an estimate 2.5 billion cubic feet of gas every day and this action, amounts to the loss of revenue, estimated at 2.5 billion US dollars yearly [24].
From an economic perspective, the flaring of this associated gas is a colossal waste to the communities. The economic cost of total gas flared is quite staggering which implies great investment opportunities for the private sector. Hence, more gas intensive modes of production, greater private sector investment are encouraged in the sector and governments should recycle and seek for more trading opportunities for the gas sector [27].
Apart from the release of greenhouse gases into the atmosphere, gas flares are said to release some 45.8 billion kilowatts of heat into the atmosphere of the Niger Delta from gas flared daily. As a result of this incineration of the environment, gas flaring has raised temperatures and rendered large areas uninhabitable [21].
4. Measuring Gas Flared and Its Emissions
All oil fields contain associated gas although in varying quantities. In analogous to the way bubbles appear when the cap is removed from a bottle of carbonated drink, so the associated gas is released when oil is brought up from the deep rock strata in which it is found. One of the challenges involved in addressing environmental aspects of flaring is identifying how much gas is being released. The difficulty to evaluate the gas flaring emission is to find out the most reliable database and to understand why these databases show different data. The method for estimating emissions from natural gas flaring is based on the volume of vented and flared gas reported to EIA (assuming that all gas is flared) [10].
A major difficulty in managing flaring and venting is identifying exactly how much gas is coming from the various sources that are contributing to the overall volume flared and vented. The proportion of associated gas to oil (Gas Oil Ratio) can vary significantly between oil fields. There is debate within the industry regarding the extent to which it is possible to measure gas flow rates accurately under such varied conditions with the measuring devices presently available on the market. Although some oil companies and equipment manufacturers would disagree, low-pressure gas rate measurement can be a significant problem. Others believe that the best way to obtain consistent data is to base it on estimates and calculations [4].
Smaller flaring and venting volumes are typically estimated by first measuring the gas-oil ratio in the crude oil stream and then inferring the amount of gas flared or vented from the measured amount of oil produced. Larger-volume sites may use orifice plates or other measurement devices. Battery operators are not currently required to report the composition of gas being flared or vented on an on-going basis. Thus, there is no direct way to determine the composition of solution gas flared. Apart from the physical and environmental differences among battery sites, there are significant variations in the composition and phase of materials being flared and vented [28].
Despite the ubiquity of flares in the world, there have been relatively few successful studies investigating their emissions and most have focused on quantifying gasphase carbon conversion efficiencies. Progress has been hampered by the inherent difficulties in accurately sampling emissions from an unconfined, turbulent, inhomogeneous, elevated plume of a flare. General understanding is further complicated by the incredibly wide range of operating conditions (i.e. exit velocities, cross-wind conditions, fuel compositions) encountered in different applications [29].
There are various methods of detecting air pollution in an industrial environment. These experimental methods are capital intensive; hence only large or well-established industries can afford them [30]. Accurate and transparent determination of environmental impacts of flaring and venting of gas associated with oil production, and potential benefits of mitigation, are severely hampered by the lack of publically available gas composition data [31].
Only very limited data are available that describe methane emissions from natural gas and oil activities. Estimating the types of emissions defined above is complicated by the fact that emissions rates from similar activities in various regions and countries are influenced by differences in the industry’s supporting infrastructure, operating and maintenance practices, and level of technology used. Because natural gas and oil activities are complex, it is not easy to define simple relationships between emissions and gross descriptors of the activities undertaken. The following data have been identified: surveys, estimates based on “reported unaccounted for gas”, engineering studies and measurements.
Different methods, emission factors, estimations and ratios from International organization and recognized environmental agency and boards globally have been used to give statistical data and estimation of both the quantity of gas flared and the emissions from gas flaring. The seemingly absence of a single global method, emission factor and estimation procedure used in the oil and gas industry all over the world to determine the volume of gas flared and its emissions be it from complete or incomplete combustion, sweet or sulphur present hydrocarbons has pose a continuous problem in determining the actual impact of gas flaring and its emissions on human and its role in environmental degradation both at a local and global level.
Subject to this, researchers from wide range of disciplines such as environmentalist, engineers etc. have taken different approach to predicting, estimating the concentration and quantity of gas flaring emissions be it greenhouse gases like methane and CO2 or other components of gas flare emission such as the sulphide compounds. This approach so far includes analytical studies, numerical studies, modelling, computer simulations, etc. The goal behind each study being to mitigate the effects of gas flaring.
5. Analytical and Experimental Developments
Abdulkareem [30] carried out experimental analysis on gas flare to determine the extent of air pollution by the petroleum refinery industry on the concentrations of NO, CO, SO2 and total hydrocarbon. Pollutant concentration from the flare point was modelled using visual basic. The result of the simulation of model developed from the modified principle of gaseous dispersion by Gaussian showed a good agreement with the experimental results. The quality of air with respect to the pollutant measured was unacceptable when compared with Federal Environmental Protection Agency (Nigeria) set limit. The dispersion pattern of pollutants showed that the extent of spreading is dependent on nearness to the source of flare, wind speed, temperature etc.
In the University of Alberta flare research project experiments, gases and liquids flared at battery sites in western Canadian sedimentary basin were characterized with samples drawn at the base of the flare stacks so that they would be representative of the materials being flared and found no liquid present at any of the sites tested. Hence, no correlation was found between smoke emissions from the flare and the compositional variations of the flare stream and statistical argument that flare streams containing liquids are far less likely to exist than previously assumed [26].
David et al. [32] in other to obtain a quantitative understanding of how crosswind may affect the operation of industrial flares carried out a 3D simulation to predict the effect of crosswind velocity on the efficiency of high momentum, turbulent combustion flames by using the commercial software Fluent 6.2. A  air flame was simulated for quiescent conditions and temperature and concentration profiles were compared to experimental data. Results show that high momentum flames are more sensitive to the crosswind problem as the jet velocity increases. Also pollutant concentrations became quite large at an unstable condition on the ground level.
Kahforoshan et al. [3] studied gas flare by modelling of a typical gas flare using MATLAB. The results were compared with experimental data obtained from a gas flare in petroleum company in an industrial city of Nigeria. Also the effects of some parameters i.e. flare height and atmospheric conditions were studied on the dispersion pattern of pollutants.
Abdulkareem [33] through experimental methods evaluated ground level concentration of CO2, SO2, NO2 and total hydrocarbon (THC), which are product of gas flared for different flow stations in oil producing areas in the Niger-Delta area of Nigeria with data collected from the oil companies’ logbooks. Volumes of gas flared at different flow station were collected as well as geometrical parameters. The results of simulation of model developed based on the principles of gaseous dispersion by Gaussian showed a good agreement with dispersion pattern. The results showed that the dispersion pattern of pollutants at ground level depends on the volume of gas flared, wind speed, velocity of discharge and nearness to the source of flaring. Hence, continuous gas flaring irrespective of the quantity deposited in the immediate environment will in long run lead to change in the physicochemical properties of soil. Model equations that represent ground level concentration of pollutants were presented. The model equations were simulated using QBasic programme to show the operation and behaviour of the system.
Sonibare [34] reviewed for the purpose of air pollution control strategy the significance of these gaseous emissions in the formation of secondary air pollutants in the atmosphere. Three important secondary air pollutants formed in the atmosphere due to the presence of primary air pollutants from natural gas flares were reviewed with their environmental impacts and formation mechanisms discussed for the purpose of control measures.
Johnson [35] developed quantitative model for yearly averaged solution gas flare efficiency and GHG prediction, but need industry flare composition data to start making comprehensive calculations of emissions inventories and GHG reduction.
Nwaichi et al. [36] investigated the level and distribution of CO2 and other associated potential contaminants at some flare sites in the Niger Delta to evaluate possible environmental characteristics. Two flow stations, Agbada 1 and 2 of Shell Petroleum Development Corporation were monitored while Eneka village with no history of gas flaring was introduced as control for comparison for a period of three months. Results show that CO2, CO and associated air pollutants gave significant and more or less worrisome concentrations at the choice sites evident in recorded values in comparison to the Control site and reference regulatory set standard. Further 200 m distance from flare stack did not show statistically significant difference in terms of emissions and risk of death from carbon dioxide poisoning could threaten if there are no interventions.
Abdulkareem et al. [37] quantified the extent of air pollutants i.e. CO2, CO, SO2, NO2, and THC by predictive model for pollutant dispersion from gas flaring. The volume of gas flare and conditions of flare as well as experimental data on concentration were collated. The dispersion model based on the principle of Gaussian distribution. The simulated results shows the dispersion pattern of pollutants from gas flaring and the effect of change in the volume of gas flared, stack efficiency, wind speed and atmospheric stability on the concentrations of pollutants from gas flaring were investigated.
Susu et al. [38] modelled air pollution systems relating to gas flaring with chemical reactions. The Eulerian model was used for the prediction of air pollutants in some gas flare locations in Niger Delta region of Nigeria. A continuity equation (mass balance) that incorporates second order reaction schemes for the generation of pollutants at source or in the ensuing atmosphere was used to characterize the n species in the fluid element and the finite difference method (the Crank-Nicholson formulation) was applied for the numerical scheme. Different simulations were carried out at ground levels and altitudes and the Eulerian model provided a satisfactory prediction of the spatial and transient concentration profiles for the pollutants in the gas flares.
For pilot-scale flares in the absence of cross flow, Pohl et al. [39] traversed a sample probe above the flare and found gas phase carbon conversions efficiencies in excess of 98%, except at low heating values near the limits of flame stability. Strosher [40] found local efficiencies (calculated to include carbon emissions from the flare) ranging from 62% - 84% downstream of the flame tip and suggested that these lower efficiencies might be linked to carry-over of liquids into the flare gas stream.
Flaring creates other pollutant emissions such as particulate matter (PM) in the form of soot or black carbon (BC). McEwen et al. [29] reviewed available PM emission factors for flares and found questionably accurate, or based on measurements not directly relevant to openatmosphere flares. In addition, most previous studies of soot emissions from turbulent diffusion flames considered alkene or alkyne based gaseous fuels, and few considered mixed fuels in detail and/or lower sooting propensity fuels such as methane, which is the predominant constituent of gas flared in the upstream oil and gas industry. Quantitative emission measurements were performed on lab-scale flares for a range of burner diameters, exit velocities, and fuel compositions. Total soot emissions from turbulent jet-diffusion flames representative of associated gas flares were studied. Both a gravimetric sampling method and a laser induced incandescence instrument were used in conjunction with a hood sampling system to measure the soot yield per mass of fuel burned for a wide range of conditions, including five different burner exit diameters, a broad range of flow rates, and six different fuel mixtures. A specific sampling protocol was developed for these measurements, based on current PM test protocols for stationary sources and diesel engines. This provides a preliminary empirical relationship between fuel heating value and soot yield.
6. Theoretical and Numerical Approach
The aviation industry utilizes weather forecast as a necessary tool to avert air disasters. So also there is a need also for a perfect knowledge of anticipated gaseous emissions from associated natural gas of known composition being flared on daily basis through combustion activities under several operating conditions of oil and gas companies globally. This will help in the control of gaseous emissions from these flares and thus in the protection of their immediate and distant environment against environmental degradation via air pollution.
Quantifying the performance of flares in oilfields is difficult due to its dependence on a wide range of operating variables, such as wind speed, “waste” gas composition and jet exit speed, to mention a few. Therefore, accurate measurement of emissions from gas flares still poses a significant challenge to all stake holders in the oil and gas industry [41].
It is in the light of this that theoretical and numerical models employing a set of equations such as material balance, equation of state, energy equation etc. have been investigated with natural gas of various origins as combustibles. Operating conditions favouring complete combustion generate the least gaseous emissions specie (CO only) while those that favour incomplete combustion and high temperature produce CO2, NO2, and NO as additional species if the natural gas contains no sulphur compound.
Sonibare et al. [42] in his study predicted gaseous emissions based on possible individual combustion types anticipated in flare operations. Of seven reaction types he considered, natural gas composition was observed to be a prominent factor in the determination of non-methane gaseous emission characteristics as it determines the stoichiometric air required for combustion. A Fortran 90 program was developed to study gaseous emission pattern for seven different types of combustion reactions model using mass balance equations. CO2, CO, NO, and NO2 are the anticipated gaseous emissions from combustion of “sweet” natural gas using these equations while SO2 is released in addition if the natural gas is “sour” in nature. Carbon contents of the natural gas plays a prominent role in the determination of air quantity requires for combustion in addition to availability of this air which is one of the factors that determine if the combustion reaction type is to be complete or incomplete. Sonibare’s work complements several other researches at accurate prediction of non-methane gaseous emissions from natural gas, though with its own peculiarities.
Several studies over the past years have evaluated flare efficiencies. These include major flare research programs by the US EPA, the Alberta Research Council, and the University of Alberta. Other work includes a CMA study; surveys of operating flares by BP/Statoil, the German Aerospace Centre and Shell in Europe, and Shell Nigeria; and a multi-year Petroleum Environmental Research Forum (PERF) study of external combustion. These studies have consistently shown that appropriately designed and operated flares are highly efficient, converting 98% - 99.5% or more of the hydrocarbon feed to carbon dioxide and water. However, in certain situations, particularly cases of incomplete liquid knock-out, low BTU flare gas, or high wind conditions, the efficiency can be lower. The Alberta Research Council found efficiencies as low as 62% for unpiloted field pipe flares, with no flame stabilization or wind protection, subjected to liquid hydrocarbon carryover. Based on past studies, John et al. [43] reviewed flaring efficiency studies and drew the following conclusions:
• The combustion efficiency of properly operated flares burning dry, hydrocarbon gases, under low to moderate wind conditions, is very high. Even under high wind conditions, efficiency can be maintained by sufficient stack exit velocity and by the multiple pilots with continuous pilot monitoring, flame retention and wind protection devices that are found on all modern flares.
• Liquid droplets in the gas stream can reduce efficiency.
• Low BTU gases can burn inefficiently when exposed to moderate or high cross-winds. Combustion is stabilized by increasing stack exit velocity, but this can be a balancing act since low BTU gases can also experience blow-out if the exit velocity gets too high.
Francesco et al. [44] worked on the detailed modelling and numerical simulations of a confined flare, to investigate the possibility of optimization of geometric and combustion parameters. The numerical model was based on the Large Eddy Simulation (LES) approach developed at NIST and implemented in the open source code FDS. The unsteady structures of the thermo-fluid dynamic fields are reproduced as some of the most important operating conditions are varied. The Large Eddy Simulation of a real appliance for the flaring of the gases coming from an oil well were conducted with results that, both qualitatively and in terms of global efficiency, agree satisfactorily with those expected. The results provided useful information for a better design of confined flare. Accurate quantitative comparison was not possible, even in terms of global quantities, due to the lack of experimental data. Post processing of data was also considered for the evaluation of the major pollutant species.
Clearly casting the physical problem into the mathematical one is essential prior to any simulation to be carried out properly. Pablo [45], presented a simulation of the aero-thermo-dynamical effects produced by the gas emissions that come out from industrial stacks, generating either flue gases or gas flares, in a dry calm environment. The simulation was carried out with real world data from a propane dehydrogenation plant (PDH) in Tarragona (Spain). Starting from the Navier-Stokes equations in conservative form he obtain integral model from the Conservation of mass, momentum, energy principles and the equation of state. Validation of these models required comparisons with experimental data, which he claimed no knowledge of its existence. These are simple mathematical models, nevertheless physically useful. Earlier papers are biased towards the analytical simplifications leading to less compact and widely diversified models.
Chris [46] developed the actual differential equations that characterize the behaviour or each of the six attributable variables that constitute the carbon dioxide emissions, namely, gas fuels, liquid fuels, solid fuels, FLARING, cement and bunker. A differential equation for each attributable variables that constitute CO2 emmisions and a differential system of the sum of the variables was modelled. Real historical data was used on the subject phenomenon to develop the analytical form of the equations. This model was used to predict 10 - 50 year rate of change of the entities that constitute CO2 emissions which is useful for strategic planning and formulating policies to mitigate global warming.
Ribert et al. [47] conducted systematic numerical analysis to explore supercritical mixing and combustion dynamics of liquid oxygen and methane separated by a splitter plate. The formulation based on the full conservation laws, and takes into account real-fluid thermodynamics and transport phenomena. Turbulence closure is achieved using a large-eddy-simulation technique. Two different classes of turbulent combustion models were employed to treat sub-grid scale (sgs) turbulence/flame interactions: the laminar flamelet model and direct-closure approach. The results indicated that the combustion process is mixing dominant throughout the entire flow field under the present simulation conditions.
Thornock et al. [48] worked on Large Eddy Simulation (LES) of sour gas flares in western Canada. The numerical simulation tool (ARCHES) employed, uses a LES model coupled with chemistry and radiation models to provide a high-fidelity (time and space) description of the flow field.
Singh et al. [49] researched on flare minimisation during plant start-up by using dynamic simulation. Dynamic simulation was developed for recovery area in an olefin plant and used to examine start-up procedures. The dynamic simulation gives an insight into the process dynamic behaviour that is not apparent through the use of steady state simulation and process engineering calculation. The process simulation is a cost-effective approach for identifying pollution prevention opportunities. This information is crucial for plant start-up in order to minimise the flaring. His work demonstrated a feasibility of pollution prevention through flare minimisation for an olefin plant.
Johnson et al. [50] researched measurements of the combustion efficiencies of jet diffusion flames in a cross flow. The purpose for studying these flows was to understand and model the combustion of gas flares burning in the atmosphere. His results showed that the overall combustion efficiencies of these flames, based on a gaseous carbon balance, were measured as a function of jet velocity, cross flow velocity, and volumetric energy content of the fuel gases. Results also show that wind speed can have a profound effect on efficiency (i.e. efficiency drops by approximately the cube of wind speed) and that having higher jet exit velocities makes the flames less susceptible to these wind effects. As well, the data shows a dramatic decrease in combustion efficiency as the volumetric energy content of the fuel is reduced.
Experimental analysis of noise dispersion and weather conditions used for simulation was carried out by Abdulkareem et al. [51]. The modeling and simulation of noise dispersion from flare stations using visual basic programme was the main focus of his work. Results obtained show some variation between the simulated results and experimental results, with correlation coefficient ranging from 0.955 - 0.995. Simulation results of the developed model show that the noise intensity level reduces with increasing in distance from the flare point and that weather conditions has an important influence on noise dispersion. Noise dispersion from the flare station is adversely felt within 20 - 80 m away from the flare station.
Desam et al. [52] studied Natural gas flares with different conditions using LES to understand the different flame shape regimes such as buoyancy dominated, wake attached and wake stabilized. A set of calculations was performed to validate the computed flame shape by matching experimental conditions. There is a good agreement between the simulations and experiments, which gives confidence for subsequent parametric studies. The effect of large flare tip diameters and different magnitudes of crosswind and jet velocities were also studied using the simulation tool. These parametric studies show evidence that the flame shape also depends on the diameter of the flare tip and individual velocity magnitudes of flare jet and crosswind.
Lawal et al. [41] investigate the influence of changes in the velocity of the jet and the cross-flow on flame length, radiant fraction and emission index of pollutant of a jet flame in cross-flow. The flow field was computed using the Reynolds averaged Narvie r‐Stokes (RANS) equations incorporating the realizable kε turbulence closure. The combustion process is modelled based on the Eulerian particle flamelet model, while the heat loss by radiation is accounted for using the discrete ordinates method. Comparison of the predicted flame length and the trend of emission indices of the pollutant species with experimental data revealed good agreement for the range of jet to cross‐flow momentum flux ratios investigated.
Ismail and Fagbenle [53] developed a model for an accurate prediction of heat flux at any point within the vicinity of a gas flare through numerical methods to eliminate the severe inaccuracies that may result from empirical formulae. Singhal et al. [54] did a theoretical development for Offshore Stack-enclosed gas flares. A systematic procedure for evaluating heat radiation from a stacked enclosed gas flare was developed by analyzing many different aspects of the flaring process which determine the amount of heat radiation incident on a target some distance away.
7. Trends in Gas Flaring
Distinct data on the magnitude of the gas flaring remains elusive. The amount of gas disposed of through flaring over the last decade has trended down modestly despite a sizeable increase in crude oil production. Much of the official information on the amount of gas flaring comes from environmental ministries or statistical agencies within various governments. However, during the last decade, military satellites and sophisticated computer programs have been used to measure gas flaring. Years of satellite data have provided the current best estimates for temporal trends in flaring activity globally as illustrated in Figure 1. Global estimates of flaring activity have been relatively stable, increasing slightly in 2005 to 172 bcm, and decreasing since then [55].
The Global Gas Flaring Reduction Public-Private Partnership (GGFR) and the US National Oceanic Atmospheric Administration (NOAA) efforts to use satellite data to improve the reliability and consistency of global gas flaring data has resulted in more consistent national and global estimates of gas flaring volumes from 1995 through to 2010. Reductions in gas flaring in several countries helped bring down flaring worldwide in 2010. These latest estimates reinforce a positive downward trend in flaring. The satellite data has excellent global coverage but also has several sources of uncertainty, including variation in flare intensity, inclusion of processing plant flaring, misidentification of flares, inability to track gas venting, and the difficulty in distinguishing flares from other urban lighting sources. The most recent information from the satellite data from GGFR in November 2010 indicates that global flaring levels are 146 bcm per year. But there are some large uncertainties at the country and regional level. The most striking discrepancy is in Russia, where satellite estimates of more
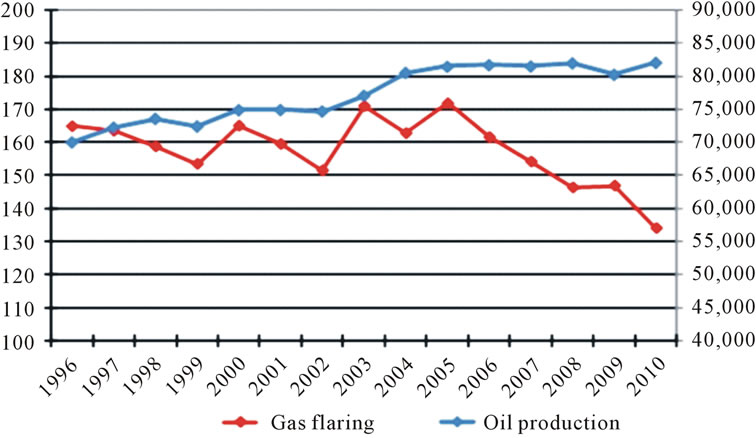
Figure 1. Global gas flaring from satellite data. Adapted from [61].
than 40 to 50 bcm were nearly three times greater than the government reported levels of gas flaring [56].
7.1. Local and Regional Trends
Gas flaring is most serious in places where investment is difficult (Nigeria, Iraq, Iran), especially at brownfield sites and where oil projects are extremely remote (West Siberia, deep offshore, etc.). Focus here would be on the two most sited gas flaring countries in all works reviewed; namely, Nigeria and Russia. Although Russia and Nigeria have achieved the largest flaring reductions since 2006, they still top the list of flaring countries for 2010, which also includes Iran, Iraq, Algeria, Angola, Kazakhstan, Libya, Saudi Arabia, and Venezuela [57].
7.1.1. Nigeria
Gas flaring is a menace that has brought multiple effects to Nigeria as an important country in the African region. Whatever the reasons for flaring the gas, the fact remains that it is wastage of valuable resources much needed for economic development [13].
The role of multinational oil companies in the exploration for crude oil in the Niger-Delta has remained contentious as a result of the activity of gas flaring that is perpetuated by these companies. Though the total amount of gas that is being flared has dropped from an all-time high of 49.8% (2000-2002 period) to around 26% in 2008. It must be pointed out that these companies have made some effort at reducing the amount of gas flared. However, these reductions do not go far enough in terms of eliminating this unacceptable practice [58].
GGFR data as at 2003 show that In Nigeria, 17% of total daily gas production is re-injection, 33% is used commercially, and the remaining 50% flared. The ICF in 2006 reported Nigeria’s annual flaring of 19 bcm in 2006 amounts to 44 million tons of CO2 emission. The level of flaring in 2008, when scaled to 1999 production levels, is only 12% lower than 1999 levels, showing an insignificant amount of reduction in 9 years despite years of promises to reduce gas flaring in the Niger-Delta [55].
Due to efforts already underway in Nigeria to curb flaring and the likely insistence by the oil companies and the Nigerian government to regard Nigeria as a “success story”, it is recommended that gas flaring problem should be addressed more broadly, with issues and lessons from Nigeria as only one component. The petroleum companies, notably Shell and Chevron, would probably argue that they have the problem under control, and the attitude of the Nigerian authorities could be expected to be similar. The one flaring related issue that is unresolved, and where some collective efforts possibly could make a difference, is the development of markets for the un-flared gas in Nigeria and the region [14].
Plans outlined decades ago are only now being fully realized. A few of the most significant of these have been the Bonny Island LNG export terminal, the West Africa Gas Pipeline (WAGP), and the gas processing infrastructure associated with the Escravos GTL project. More recently, a number of flare gas to power projects have begun feeding the severely short Nigerian power sector. Shell recently committed $2 billion to reduce gas flaring at 24 sites across the delta. These projects have been under development for many years, but have been delayed. One of the larger efforts, the Gbaran-Ubie project, will use flare gas to feed a power project in Bayelsa state. In addition, Chevron is investing in its 3A and 3B gas processing plants in the Escravos region. These will double processing capacity by 2013 and should reduce flaring in the western parts of the Delta. In the offshore regions of Nigeria, gas is captured and brought to the Bonny LNG facility or re-injected. Exxon has increasingly relied on offshore processing [56]. Although Nigeria has reduced flare gas emissions by 28 percent from 2000 levels, the country’s oil industry still wastes about 15 bcm of natural gas every year [59]. The Table 1 gives
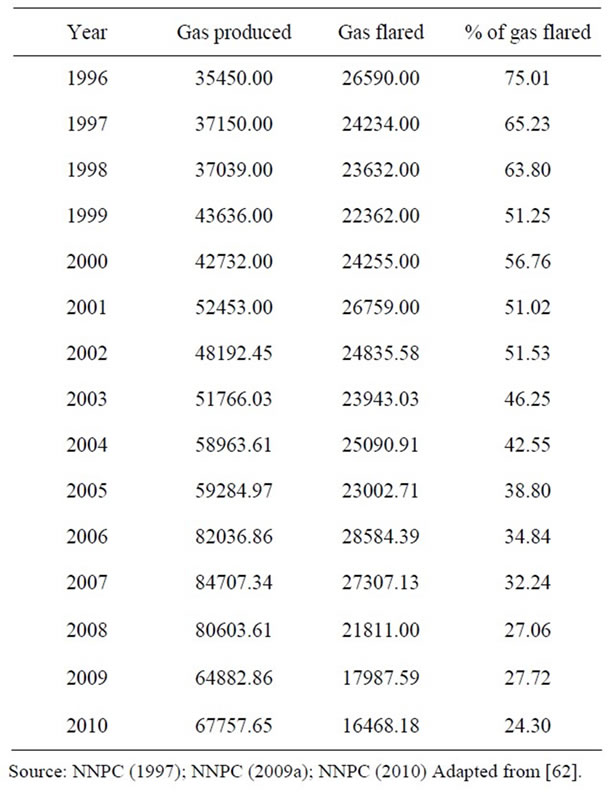
Table 1. 15 years gas flaring volumes for Nigeria (million cubic metres).
a 15 years gas flaring volumes for Nigeria.
7.1.2. Russia
Russia is the world leader in the flaring of associated petroleum gas (APG). Russia has 13.6 percent of the world’s oil reserves. Meanwhile the country flares 30 percent of total APG flared in the world. Different sources provide different quantitative assessments of APG flared in Russia, since no reliable system for metering flared gas is available. According to domestic assessments, about 15 - 20 bcm of APG is flared annually in Russia. Western countries using satellite data estimate 50 bcm per year [60].
As aforementioned, the absolute scale of flaring is uncertain (15 to 50 bcm per year), but company efforts to reduce flaring have intensified after Prime Minister Vladimir Putin brought focus to the issues in a 2007 presidential address. Current plans are for a steep increase in penalties in 2014. The International Energy Agency (IEA) stated in 2006 that there is no specific legislation to regulate flaring or venting, nor any limits on gas flaring levels. The absence of competitive markets for gas and other fuels, and the little financial incentive for oil producers to re-inject, sell or make judicious use of the country’s vast associated gas has retarded efforts to value associated gas at its opportunity cost.
7.1.3. Other Regions
Firstly, the Caspian countries which includes the key oil producing countries of Azerbaijan, Kazakhstan, Turkmenistan, and Uzbekistan. Of these countries, Kazakhstan has been an industry focal point in recent years for its giant yet complex oil reservoirs. Oil production has increased substantially, but high levels of toxic hydrogen-sulphide (H2S) have made associated gas projects especially challenging. Data on associated gas flaring is less available in places like Uzbekistan and Turkmenistan. Satellite data shows increasing flaring levels in both nations. On the other end is the Middle East where the largest volumes of gas flaring occur in Iran and Iraq. However, Saudi Arabia, Kuwait, Qatar, and other parts of the region have flaring issues. Both satellite and reported data sources indicated seven to ten bcm per year of gas flaring.
7.2. Best Practises
Associated Petroleum Gas (APG) flaring is completely prohibited in the USA and Norway, and in 2004 the same prohibition was introduced in Kazakhstan as well. In other developed countries, APG utilization is between 97 - 99 percent due to the technologies of the oil majors and severe environmental requirements. What follows is summary of measures adopted by countries with minimal gas flaring history.
Norway: Norway reduced gas flaring and venting significantly through successful implementation of regulations and close cooperation between the authorities and the industry. The oil producing companies are required to check the sensors of the internal metering system every six months, submit an emissions inventory once a year and ensure the regulations are being meet.
Canada: In 2007, the total associated gas production for Canada was 23.7 bcm, 94% of which was utilized in domestic heating and power generation as well as industrial and commercial use. Canadian provincial regulators require annual and public reporting of flaring volumes from each oil producer, and strict compliance with fines and licence cancelations.
USA: Onshore and offshore producers of oil and associated gas are required to manage associated gas through transportation to a market, power generation, re-injection. The well-established gas pipeline system and high national demand for gas makes it economically feasible to use associated gas instead of flaring it [55].
8. Conclusions
Gas flaring and its impacts globally have continued for decades ever since the exploration of crude oil and natural gas began. With the continuous increase in demand for energy from fossil fuels like hydrocarbons in the next few decades, different researchers need to come together harnessing research works of decades in the oil and gas industry, academia and governments to determine ways of reducing gas flaring drastically. And if gas must be flared, an accurate means to determine volume of gas flared, its emissions quantity and concentration must be agreed upon.
These impacts of gas flaring emissions and radiant heat from flare are key element in petroleum industries, which requires accurate and efficient prediction method which should not be subjected to large errors. Estimation used by most oil and gas companies and agencies worldwide is unsure and uncertain as they are based on assumptions of certain factors such as flare efficiency, complete combustion etc. Experimental and analytical approach is based on empirical formulae which may result in severe inaccuracies and are carried out in controlled environment. Numerical and theoretical models studied by other researchers have employed large eddy simulation, computational fluid dynamics (CFD) with different differential equations to predict the combustion of methane and sour flares. However, these predictions are often compared with experiments which were carried out in flare sites and laboratories under certain assumptions as aforementioned.
All literatures reviewed agreed on the global implications of continuous gas flaring and the urgent need to mitigate its consequences. There is also a unanimous view that there is Inconsistent data and under-reporting of gas flaring by governments and companies, which has complicated the global effort to track progress on flaring reduction as there are some large uncertainties at the country and regional level. It appears that control of gas flaring and its emissions remains elusive. However, with proper numerical methods applied to solving differential equations that may govern the gas flaring process, accurate prediction of gas flared and the resulting pollutants that degrade our environment can be made. Natural gas is a vital component of the world’s supply of energy. It is one of the cleanest, safest, and most useful of all energy sources. To flare it, is to degrade energy, to mitigate it is to stop its resulting environmental degradation.
REFERENCES
- World Bank, “Regulation of Associated Gas Flaring and Venting. A Global Overview and Lessons from International Experience,” World Development Report, Washington, 2000/2001.
- P. A. O. Odjugo and E. J. Osemwenkhae, “Natural Gas Flaring Affects Microclimate and Reduces Maize (Zea mays) Yield,” International Journal of Agriculture & Biology, Vol. 11, No. 4, 2009, pp. 408-412.
- D. Kahforoshan, E. Fatehifar, A. A. Babalou, A. R. Ebrahimin, A. Elkamel and J. S. So Ltanmohammadzade, “Modelling and Evaluation of Air pollution from a Gaseous Flare in an Oil and Gas Processing Area,” WSEAS Conferences in Santander, Cantabria, 23-25 September 2008.
- The International Association of Oil & Gas Producers (OGP), “Flaring & Venting in the Oil & Gas Exploration & Production Industry: An Overview of Purpose, Quantities, Issues, Practices and Trends,” Flaring and Venting Task Force Report, Report No. 2.79/288, 2000.
- F. A. Akeredolu and J. A. Sonibare, “A Review of the Usefulness of Gas Flares in Air Pollution Control,” Management of Enviromental Quality, Vol. 15, No. 6, 2004, pp. 574-583. doi:10.1108/14777830410560674
- M. Strosher, “Investigation of Flare Gas Emissions in Alberta,” Final Report, Environment Canada, Conservation and Protection, The Alberta Energy and Utililities Board and the Canadadian Association of Petroleum Products, Environmental Technologies, Ottawa, 1996.
- J. Argo, “Unhealthy Effects of Upstream Oil and Gas Flaring,” Save Our Seas and Shores (SOSS), Nova Scotia, 2002.
- The Combustion and Environment Research Group of the Department of Mechanical Engineering, University of Alberta Edmonton, Alberta, “Flare Research Project,” University of Alberta Edmonton, Alberta, 2004. http://www.mece.ualberta.ca/groups/combution/flare/index.html
- United States Environmental Protection (USEPA), “Stationary Point and Area Sources,” Compilation of Air Pollutant Emission Factors, 5th Edition, Vol. 1, 1993.
- B. Gervet, “Gas Flaring Emission Contributes to Global Warming,” Master’s Thesis, Luleå University of Technology, Luleå, 2007.
- M. Ishisone, “Gas Flaring in the Niger Delta: The Potential Benefits of Its Reduction on the Local Economy and Environment,” 2004. http://nature.berkeley.edu/classes/es196/projects/2004final/index.html
- A. E. Gobo, G. Richard and I. U. J. Ubong, “Health Impact of Gas Flares on Igwuruta/Umuechem Communities in Rivers State,” Applied Science & Environmental Management, Vol. 13, No. 3, 2009, pp. 27-33.
- G. I. Malumfashi, “Phase-Out of Gas Flaring in Nigeria By 2008: The Prospects of a Multi-Win Project (Review of the Regulatory, Environmental and Socio-Economic Issues),” Nigeria Gas Flaring Petroleum Training Journal, Vol. 4, No. 2, 2007, pp. 1-39.
- A. C. Christiansen and T. Haugland, “Gas Flaring and Global Public Goods,” FNI Report 20/2001, Fridtjof Nansen Institute (FNI), Lysaker, 2001, 34 p.
- O. O. I. Orimoogunje, A. Ayanlade, T. A. Akinkuolie and A. U. Odiong, “Perception on Effect of Gas Flaring on the Environment,” Research Journal of Environmental and Earth Sciences, Vol. 2, No. 4, 2010, pp. 188-193.
- N. Bassey, “Gas Flaring: Assaulting Communities, Jeopardizing the World,” Proceedings at the National Environmental Consultation, The Environmental Rights Action in Conjunction with the Federal Ministry of Environment, Abuja, 10-11 December 2008.
- “Gas Flaring in Nigeria,” Friends of the Earth Media Briefing, 14 October 2004. www.foe.co.uk/resource/media_briefing/gasflaringinnigeria.pdf
- C. O. Orubu, A. Odusola and W. Ehwarieme, “The Nigerian Oil Industry: Environmental Diseconomies, Management Strategies and the Need for Community Involvemen,” Journal of Human Ecology, Vol. 16, No. 3, 2004, pp. 203-214.
- S. O. Aghalino, “Gas Flaring, Environmental Pollution and Abatement Measures in Nigeria, 1969-2001,” Journal of Sustainable Development in Africa, Vol. 11, No. 4, 2009, pp. 219-238.
- E. Uyigue and M. Agho, “Coping with Climate Change and Environmental Degradation in the Niger Delta of Southern Nigeria,” Community Research and Development, Centre Benin City, 2007.
- O. I. Augustine and W. W. Sanford, “The Effects of Waste Gas Flares on the Surrounding Vegetation in South-Eastern Nigeria,” Journal of Applied Ecology, Vol. 13, No. 1, 1976, pp. 177-187. doi:10.2307/2401936
- A. A. A. Imevbore and S. A. Adeyemi, “Environmental Monitoring in Relation to Pollution and Control of Oil Pollution,” Proceedings at the Seminar on the Petroleum Industry and the Nigerian Environment, Vol. 6, 1981, pp. 135-142.
- V. O. Nwaugo, R. A. Onyeagba and N. C. Nwahcukwu, “Effect of Gas Flaring on Soil Microbial Spectrum in Parts of Niger Delta Area of Southern Nigeria,” African Journal of Biotechnology, Vol. 5, No. 19, 2006, pp. 1824- 1826.
- C. Collins and O. Oshodi, “Improper Abandonment of Oil,” Nigerians in America, 2010. http://www.nigeriansinamerica.com/articles/4403/1/Improper-Abandonement-Of-Oil/Page1.html
- Canadian Public Health Association, “Background to 2000 Resolution No. 3: Gas Flaring,” Canadian Public Health Association 2000 Position Paper, 2000.
- L. W. Kostiuk and G. P. Thomas, “Characterization of Gases and Liquids Flared at Battery Sites in the Western Canadian Sedimentary Basin,” Technical Report, University of Alberta, Edmonton, 2004, 95 p.
- S. Madueme, “Economic Analysis of Wastages in the Nigerian Gas Industry,” International Journal of Engineering Science and Technology, Vol. 2, No. 4, 2010, pp. 618-624.
- M. R. Johnson, L. W. Kostiuk and J. L. Spangelo, “A Characterization of Solution Gas Flaring in Alberta,” Journal of Air & Waste Management Association, Vol. 51, No. 8, 2001, pp. 1167-1177. doi:10.1080/10473289.2001.10464348
- J. D. N. McEwen and M. R. Johnson, “Black Carbon Particulate Matter Emission Factors for Buoyancy Driven Associated Gas Flares,” Journal of the Air & Waste Management Association, Vol. 62, No. 3, 2012, pp. 307- 321. doi:10.1080/10473289.2011.650040
- A. S. Abdulkareem, “Urban Air Pollution Evaluation by Computer Simulation: A Case Study of Petroleum Refining Company, Nigeria,” Leonardo Electronic Journal of Practices and Technologies, Vol. 6, 2005, pp. 17-28.
- M. R. Johnson and A. R. Coderre, “Compositions and Greenhouse Gas Emissions Factors for Flared and Vented Gas in the Western Canadian Sedimentary Basin,” Journal of the Air & Waste Management Association, in Press.
- D. Castineira and T. F. Edgar, “CFD for Simulation of Crosswind on the Efficiency of High Momentum Jet Turbulent Combustion Flames,” Journal of Environmental Engineering, Vol. 134, No. 7, 2008, p. 561. doi:10.1061/(ASCE)0733-9372(2008)134:7(561)
- A. S. Abdulkareem, “Evaluation of Ground Level Concentration of Pollutant Due to Gas Flaring by Computer Simulation: A Case Study of Niger-Delta Area of Nigeria,” Leonardo Electronic Journal of Practices and Technologies, Vol. 6, 2005, pp. 29-42.
- J. A. Sonibare, “A Critical Review of Natural Gas Flares-Induced Secondary Air Pollutants,” Global NEST Journal, Vol. 13, No. 1, 2011, pp. 74-89.
- M. R. Johnson, “Quantifying Flare Efficiency and Emissions: Application of Research to Effective Management of Flaring,” 2006, www.worldbank.org/html/fpd/ggfrforum06/berg/johnson.ppt
- E. O. Nwaichi and M. A. Uzazobona, “Estimation of the CO2 Level Due to Gas Flaring in the Niger Delta,” Research Journal of Environmental Sciences, Vol. 5, No. 6, 2011, pp. 565-572.
- A. S. Abdulkareem, J. O. Odigure and S. Abenege, “Predictive Model for Pollutant Dispersion from Gas Flaring: A Case Study of Oil Producing Area of Nigeria,” Energy Sources, Part A, Vol. 31, No. 12, 2009, pp. 1004-1015. doi:10.1080/15567030801909318
- A. A. Susu, K. E. Abhulimen and A. B. Adereti, “Modelling of Air Pollution Systems with Chemical Reactions: Application to Gas Flares in Nigeria,” International Journal for Computational Methods in Engineering Science and Mechanics, Vol. 6, No. 3, 2005, pp. 201-213. doi:10.1080/15502280590923766
- J. H Pohl, J. Lee, R. Payne and B. A. Tichenor, “Combustion Efficiency of Flares,” Combustion Science and Technology, Vol. 50, No. 4-6, 1986, pp. 217-231. doi:10.1080/00102208608923934
- M. T. Strosher, “Characterization of Emissions from Diffusion Flare Systems,” Journal of Air & Waste Management Association, Vol. 50, No.10, 2000, pp. 1723-1733. doi:10.1080/10473289.2000.10464218
- M. S. Lawal, M. Fairweather, D. B. Ingham, L. Ma, M. Pourkashanian and A. Williams, “Numerical Study of Emission Characteristics of a Jet Flame in Cross-Flow,” Combustion Science and Technology, Vol. 182, No. 10, 2010, pp. 1491-1510. doi:10.1080/00102202.2010.496379
- J. A. Sonibare and F. A. Akeredolu, “A Theoretical Prediction of Non-Methane Gaseous Emissions from Natural Gas Combustion,” Energy Policy, Vol. 32, No. 14, 2004, pp. 1653-1665. doi:10.1016/j.enpol.2004.02.008
- J. Cain, J. Seebold and L. Young, “Overview of Flaring Efficiency Studies,” ChevronTexaco Energy Research and Technology Company, 2002. http://content.lib.utah.edu/u?/ir-admin2,21350
- S. M. Francesco and G. Continillo, “Numerical Simulation of Confined Flares,” Proceedings of the European Combustion Meeting, Naples, 14-17 April 2009.
- P. R. Iturralde, “Revisited Models of Buoyant Plumes for Simulation,” Proceedings at the Applied Simulation and Modelling, Plama De Mallorca, 29-31 August 2007.
- C. P. Tsokos and Y. Xu, “Modeling Carbon Dioxide Emissions with a System of Differential Equations,” Nonlinear Analysis, Theory, Methods and Applications, Vol. 71, No. 12, 2009, pp. e1182-e1197. doi:10.1016/j.na.2009.01.146
- G. Ribert, N. Zong and V. Yang, “Large Eddy Simulation of Combustion of Liquid Oxygen and Methane in a Supercritical Environment,” 2007. http://nonpremixed.insa-rouen.fr/~vervisch/.../LES.../Ribert-LES.pdf
- J. Thornock, P. Smith and A. K. Chambers, “LES Simulations of Sour Gas Flares in Western Canada,” American Flame Research Committee (AFRC), 2009. http://content.lib.utah.edu/u?/ir-admin2,21400
- A. Singh, K. Li, H. H. Lou, J. R. Hopper, H. B. Golwala, S. Ghumare and T. E. Kelly, “Flare Minimisation via Dynamic Simulation,” International Journal of Environment and Pollution, Vol. 29, No. 1-3, 2007, pp.19-29. doi:10.1504/IJEP.2007.012794
- M. R. Johnson, O. Zastavniuk, D. J. Wilson and L. W. Kostiuk, “Efficiency Measurements of Flares in a Cross Flow,” Proceedings at Combustion Canada 1999, Calgary Alberta, 26-28 May 1999.
- A. S. Abdulkareem and J. O. Odigure, “Deterministic Model for Noise Dispersion from Gas Flaring: A Case Study of Niger—Delta Area of Nigeria,” Journal of Chemical and Biochemical Engineering, Vol. 20, No. 2, 2006, pp. 157-164.
- P. R. Desam, P. J. Smith, S. G. Borodai and S. Kumar, “Computing Flare Dynamics Using Large Eddy Simulations,” American Flame Research Committee (AFRC), 2004. http://content.lib.utah.edu/u?/ir-admin2,21353
- O. S. Ismail and R. O. Fagbenle, “Accurate Safety Zone Determination during Gas Flaring,” Journal of Engineering and Applied Sciences, Vol. 4, No. 5-6, 2009, pp. 295-302.
- S. N. Singhal, M. A. Delichatsios and J. de Ris, “Offshore Stack Gas Flares Part I and Part II,” Fire Safety Journal, Vol. 15, No. 3, 1989, pp. 211-225, 227-244. doi:10.1016/0379-7112(89)90008-8
- B. Buzcu-Guven, R. Harriss and D. Hertzmark, “Gas Flaring and Venting: Extent, Impacts, and Remedies,” Future Science-Carbon Management, Vol. 3, No. 1, 2012, pp. 95-108.
- M. F. Farina, “Flare Gas Reduction: Recent Global Trends and Policy Considerations,” GE Energy Global Strategy and Planning, 2010.
- World Bank, “Gas Flaring Reductions Avoid 30 Million Tons of Carbon Dioxide Emissions in 2010,” World Bank Press Release, Washington, 2011.
- S. I. Oni and M. A. Oyewo, “Gas Flaring, Transportation and Sustainable Energy Development in the Niger-Delta, Nigeria,” Journal of Human Ecology, Vol. 33, No. 1, 2011, pp. 21-28.
- General Electric Company (GE), “Eliminating Wasteful Global Gas Flaring Could Be the Next Big Energy and Environmental Success Story,” Press Releases, Washington, 2011. http://www.genewscenter.com/content/Detail.aspx?ReleaseID=12212&NewsAreaID=2
- “Flaring Up—Companies Pay High Costs to Be Green,” Oil and Gas Eurasia Press, No. 4, 2009. http://www.oilandgaseurasia.com/articles/p/97/article/883/
- Global Gas Flaring Reduction (GGFR), “Newsletter,” No. 12, 2011.
- T. Adole, “A Geographic Information System (GIS) Based Assessment of the Impacts of Gas Flaring on Vegetation Cover in Delta State, Nigeria,” Master’s Thesis, Environmental Sciences University of East Anglia, Norwich, 2011.