Atmospheric and Climate Sciences
Vol.3 No.4(2013), Article ID:37126,14 pages DOI:10.4236/acs.2013.34057
Analysis of Storm Structure over Africa Using the Trmm Precipitation Radar Data
1Department of Meteorology, Federal University of Technology, Akure, Nigeria
2Vice Chancelor’S Office, Redeemer’s University (RUN), Lagos, Nigeria
Email: *dejimaniang2002@yahoo.com
Copyright © 2013 Ayodeji Richard Balogun, Zechariah Debo Adeyewa. This is an open access article distributed under the Creative Commons Attribution License, which permits unrestricted use, distribution, and reproduction in any medium, provided the original work is properly cited.
Received May 17, 2013; revised June 18, 2013; accepted June 26, 2013
Keywords: Storm Height; Storm Structure; Storm Counts; Histogram
ABSTRACT
A 5-year mean seasonal analysis of mean storm height data and histograms from the Tropical Rainfall Measuring Mission (TRMM) Precipitation Radar (PR) have been used to study the storm structure of the major climatic regions in Africa and over the adjacent Atlantic ocean. The analysis was carried out in two ways. First, the mean storm height and histogram were analyzed for the entire continent bounded by 40˚N to 40˚S and 20˚W to 60˚E. Secondly, the analysis was carried out on sub-regional basis, on which Africa was structured into ten regions: Desert (North), Semi-desert (north), Deciduous forest (North), Brush Grass Savanna (North), Tropical Rainforest, Deciduous forest (South), Brush Grass-Savanna (South), Temperate Grassland/Montane Forest, Steppe (East) and Atlantic Ocean. As observed over Africa, and some parts of the Atlantic Ocean and the Indian Ocean, the storm height over the land is higher than that over the sea because ground surfaces tend to be heated more and convections are more easily developed over the land than over the Ocean. There are high storm counts over the land at 250 mb whereas the storm counts are high over the Ocean at 700 mb. Over the regions, the vertical structure of the histograms reveals a distinct bi-modal distribution in the northern hemisphere and the southern hemisphere, but a unimodal distribution is close to the equator both in the northern and southern hemisphere.
1. Introduction
It’s documented [1] that a major modeling-based effort is taken to evaluate a sensitivity of their rainfall, and heating results (among other aspects) in partitioning methods that classify precipitation echoes into various types (i.e. stratiform and convective). The convective-stratiform distinction is important because of differences in Z-R (The relationships between reflectivity and rainfall rate are referred to as Z-R Relations) relationships, e.g. [2], which affect not only the radar-based rainfall estimation, but also the latent heat release profile, and hence the energy balances of the tropical atmosphere [3]. Differences in precipitation types may lead to distinctly different vertical profiles of latent heat released to the atmosphere [4- 7], which has implications for the large-scale circulation and climate [8].
There appear to be two primary modes of how the atmosphere is affected by moist processes: Young vigorous convective cells induce an atmospheric response that is two-layered, with air converging into the active convection at low levels and diverging aloft, and the other, weak intermediary and stratiform precipitation areas induce a three-layered response, in which environmental air converges into the weak precipitation area at mid levels and diverges out from it at lower and upper levels [9]. The convective mode thus displays a heating release throughout the depth of the troposphere (associated with precipitation particles growing in the updraft) whereas the stratiform mode exhibits warming (from growth supported by rising air motion) in the upper half of the troposphere and a cooling (caused by melting and evaporation of particles in subsiding air) at lower levels [4- 6].
Storms are classified based on the precipitation types; thus, we have convective storms and stratiform storms. Yet either type of storm structures, which are ambiguous in nature, may neither be classified as convective or stratiform existance [10]. These types are generally termed “unconditioned or unclassified”. When air is sufficiently moist and unstable, convective clouds can grow to great heights which develop vigorous updrafts and produce rain, lighting, hail and sometimes flooding. R. A. Houze [11] has noted the importance of high vertical velocities in the convective clouds, which could cause serious flooding, wind and hail damage.
Spaceborne rainfall estimation, which is usually guided by raingauge data and also NWP (Numerical Weather Prediction) output, has evolved dramatically over the last two decades [12]. This is particularly important in Africa where large parts have a poor raingauge record. Spaceborne techniques have been developed based on IR brightness temperatures (e.g. [13]), and 14 GHz radar reflectivities (e.g. [14]). Often a combination of these is used to benefit from specific strength, e.g. IR-based techniques using geostationary satellite data can be used continuously, day and night. Obviously IR-based techniques are much inferior to radar-based techniques, in principle at least, because the anvil of large convective systems is much larger than the radar echoes underneath, and its topography is much more uniform. But large differences exist even between passive microwave and radar-based rainfall estimates, both on instantaneous and cumulative bases [15].
Radar has been used as an essential tool for studies of convective storms for over a generation. Pictures of individual vertical slices through convective storm have been a classic method of gaining insight into storm structure. An individual vertical slice, however, does not necessarily show that the maximum reflectivity at each altitude unless storm is aligned perfectly along the plane of the vertical scan. We define this desired Vertical Profile of Radar Reflectivity (VPRR) as the maximum reflectivity of a cell and a function of height. Because individual cells tend to tilt, the VPRR requires some attention to derive quantitatively in details [16,17]. Such a study is performed, and a classic paper is derived from the VPRR for convective cells in New England. Comparing the VPRR for thunderstorms with rain only, or with rain and hail, or with tornadoes, the storms with hail and tornadoes had greater radar reflectivity at all altitudes, but had the greatest differences in the mid troposphere. One of the principal sensors onboard the Tropical Rainfall Measuring Mission (TRMM) satellite is the Precipitation Radar (PR). Being the first space-borne radar designed to capture more comprehensive structure of rainfall than any space-borne sensor before it, the PR has produced three-dimensional rainfall data from space unprecedented by any previous scientific spacecraft [18,19]. An example of the superior observation capability of PR is its ability (with suitable methodology) to discriminate between stratiform and convective precipitation. Such details are not easily detectable by passive microwave radiometer and visible infrared sensors [20].
The purpose of this work is to analyze storm heights statistics from the TRMM PR, focusing on storms over Africa and the Atlantic Ocean. Histograms of storm heights are used to map regions where storms are dominant and to determine the modal height of the distribution.
2. Data and Methods
The TRMM Science Data Information System (TSDIS) derived the data utilized in this study from TRMM-PR observation. The PR algorithm version 5, provided by the TRMM Science Team, was used by TSDIS to derive storm height and rainfall characteristics for 5 years. The level 3 data, 3A25, which is the monthly and seasonal observations of the PR, have been used for this study. The 3A25 (monthly product) has two resolutions: a low horizontal resolution (5˚ × 5˚ latitude/longitude from 40˚N to 40˚S) and high horizontal resolution (0.5˚ × 0.5˚ latitude/longitude from 37˚N to 37˚S) [18]. Level 3 products also include histogram data, composite within the 5˚ × 5˚ cells for all storms and for convective and stratiform storms separately. Counts of storm heights are recorded in 30 intervals having vertical resolutions of 0.5 km from the surface to 13 km, increasing to 1 km from 13 km to 16 km, ending with a final 4 km bin covering the interval from 16 to 20 km. All storm height values represent height of storm top above the standard geoide an imaginary surface of the earth that coincides with mean sea level over oceans and extend through the continent. The ten regions used in this study, which covers the entire Africa and some part of the Atlantic Ocean are summarized in Table 1.
For the sake of brevity, the analyses were conducted on quarterly basis: December-January-February (DJF), Marc-April-May (MAM), June-July-August (JJA) and September-October-November (SON). The region 40˚N to 40˚S and 20˚E to 60˚W was structured into a 16 × 16 grid points and the latitude and longitude axes respectively [18,19].
Most TRMM data are written in Hierarchical data format (HDF), containing array of data called scientific data sets. Codes were written to extract and analyze the data set over the region used for this study. The software packages used include Noesys for extraction of data set, transform and excel for plotting. Noesys was used for the computation of seasonal averages of the storm height mean and histograms.
3. Results and Discussions
3.1. Seasonal Distribution of Mean Storm Height
3.1.1. Distribution of Mean Storm Height over Africa
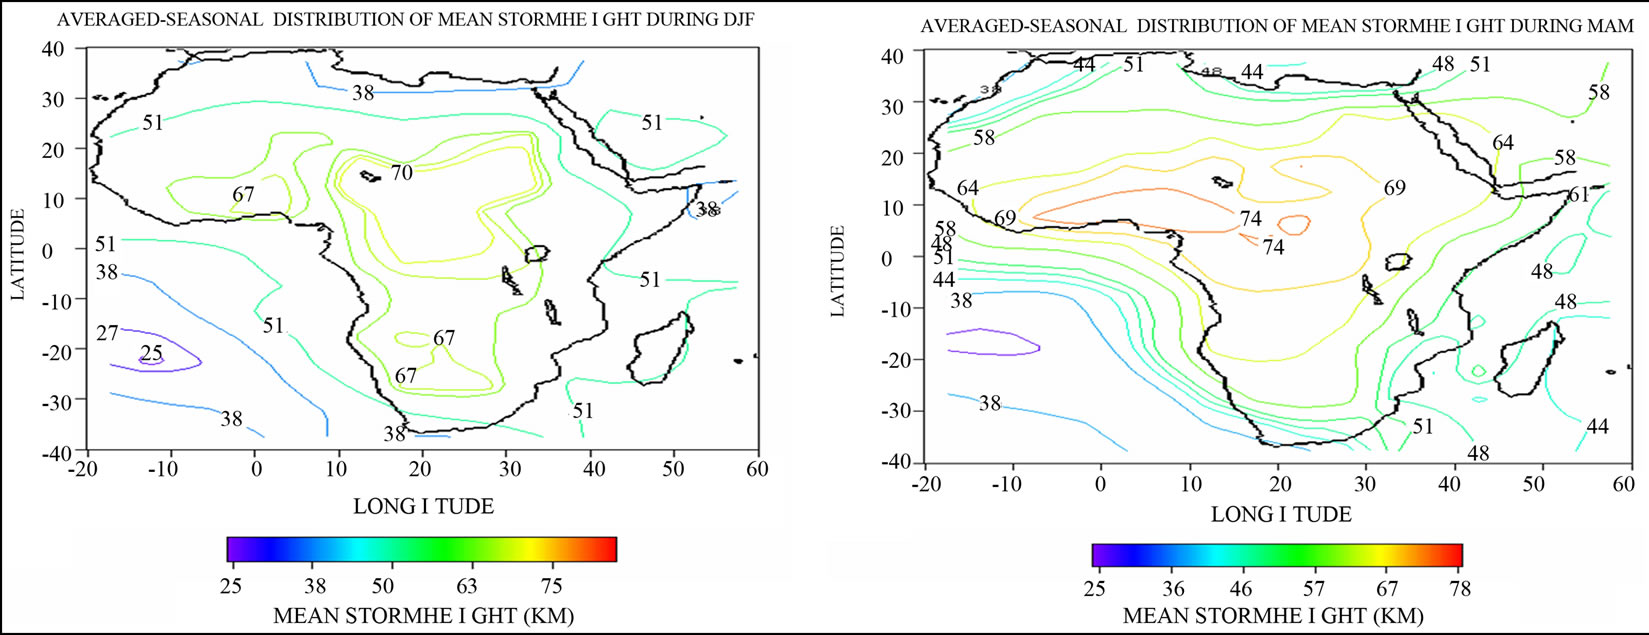
The averages of the total (stratiform, convective and un-
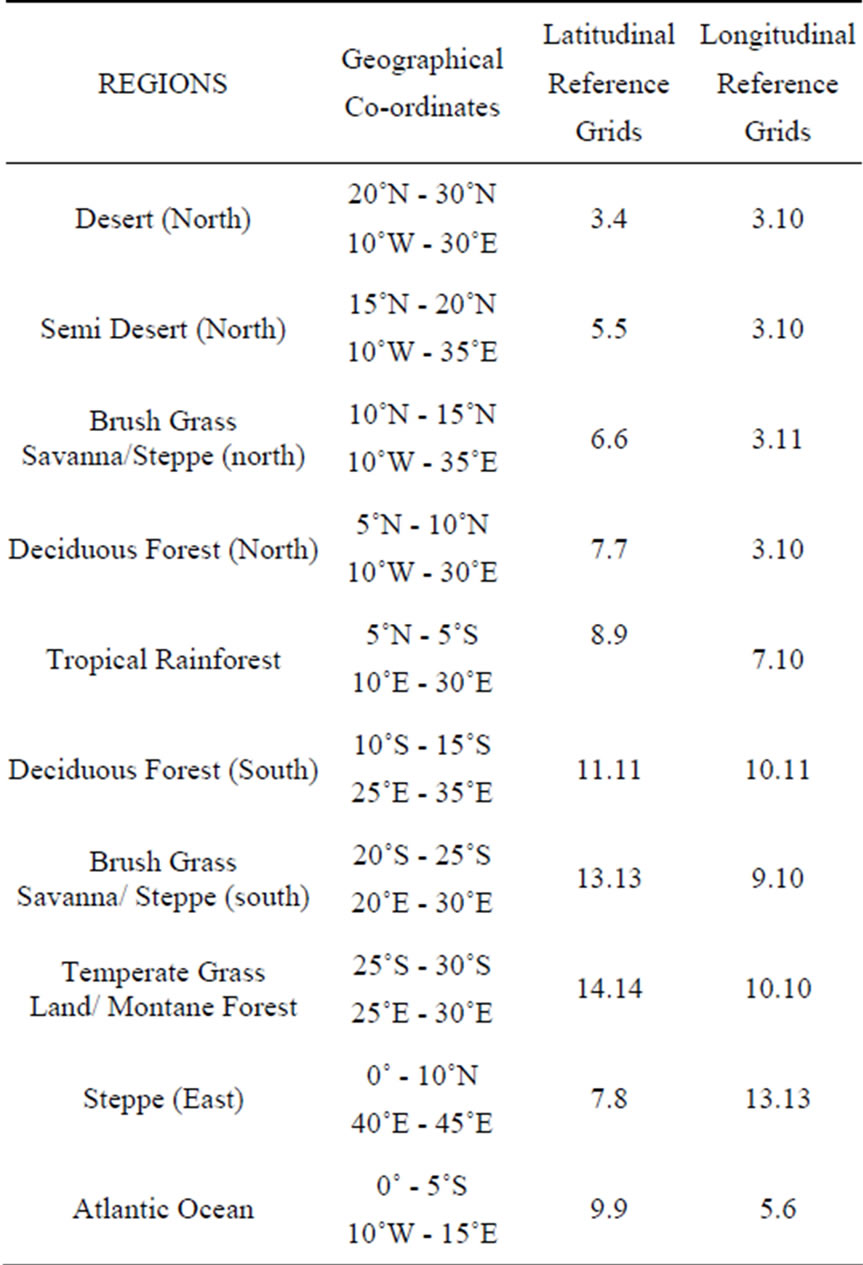
Table 1. Grid points and locations of selected climatic regions in Africa.
conditioned storm types) are shown in Figure 1, for each of the seasons. It shows the true features of all the storms combined. The effects or presence of other types of storms, apart from the stratiform and convective, is visualized here. In Figure 1(a) (DJF), stratiform storm tops are observed in East of West Africa, that is, the Northcentral region in Africa while convective storms are far in the South, the unconditioned is in the same locations as the stratiform, indicating dominance of the stratiform and unclassified types. Because both the stratiform and convective have dominance in West Africa, thus, the average storm tops are concentrated around West Africa, in Figure 1(b) (MAM). In Figure 1(c) (JJA), convective storm tops are observed in the West through central Africa to the East whereas the stratiform is overshadowed already and the unconditioned is both in the South and North. This indicates the spread of the storms across Africa-South, West and East. The pattern observed in Figure 1(a) (DJF) above also applies to Figure 1(d) (SON), because the strong convective activities are dying down giving way for the stratiform, thus, making stratiform and unclassified storm tops to dominate. Slight influences of convective storm tops are observed in the savanna south region.
3.1.2. Regional Distribution of the Mean Storm Heights
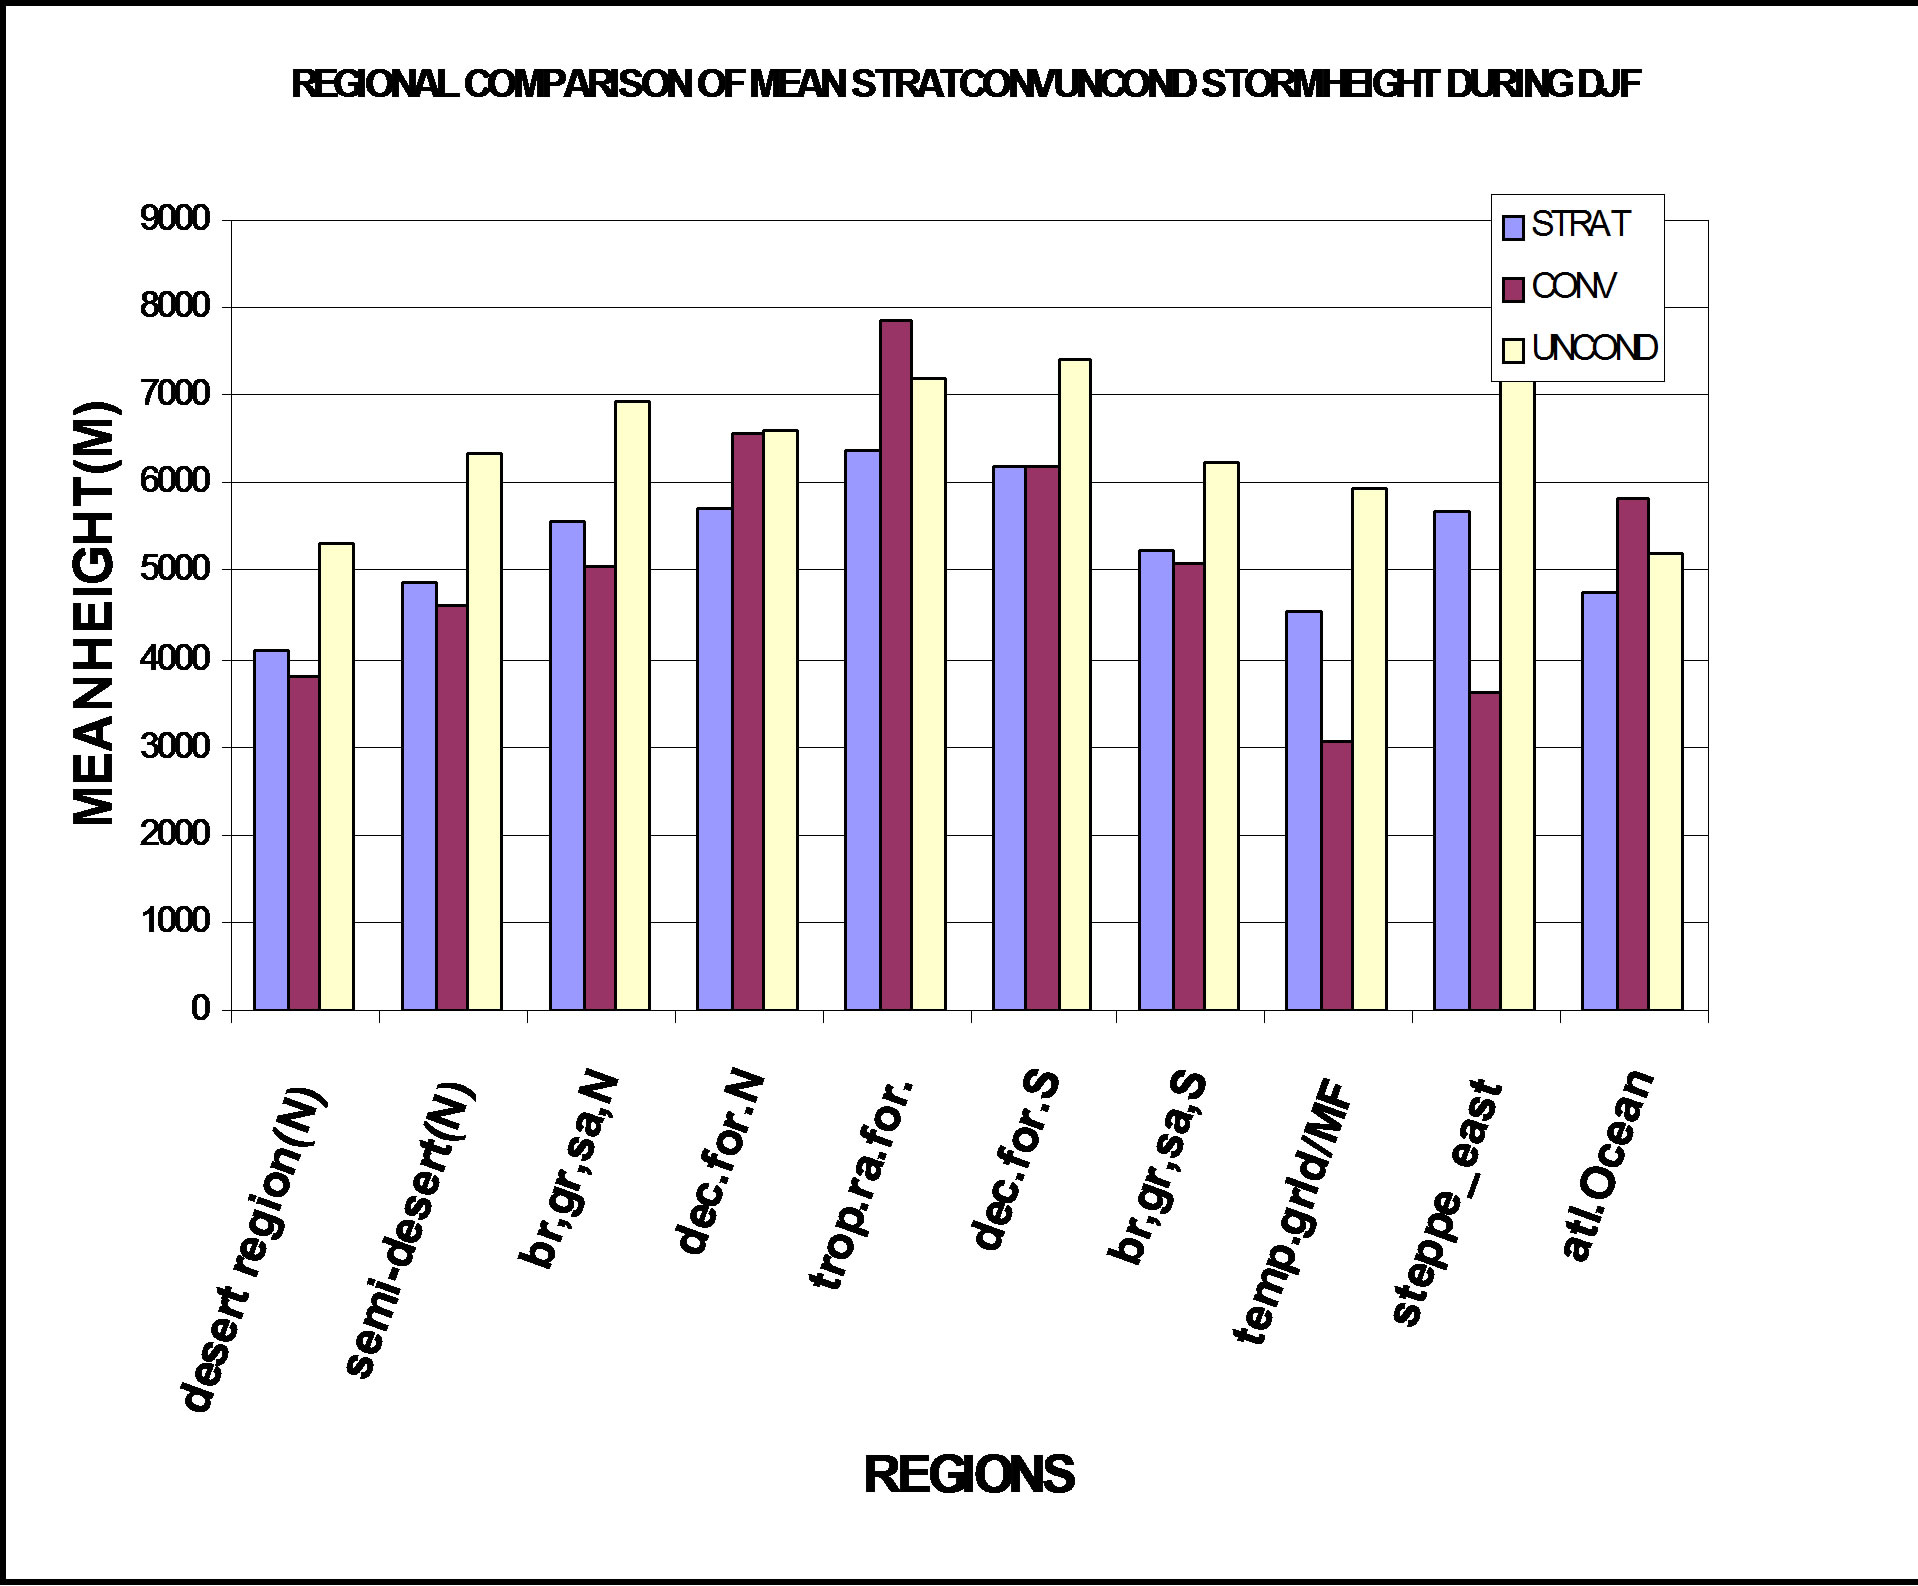
Figures 2 compares the stratiform, convective and unclassified storm types on regional basis. In the desert (Sahara), semi-desert (Sahel) and brush grass savanna (North), in Figure 2(a) (DJF), unclassified storms have tops greatest while the stratiform is greater than the convective storm tops. The unclassified decreases slightly in deciduous forest (North) and tropical rainforest, giving way for the convective which overshadowed both of them, having tops close to 8 km.
The unclassified gained vertical momentum again from deciduous forest south through brush grass savanna (South), temperate grassland/Montane forest to steppe East with mean heights of storm tops around 7.3 km. The stratiform also follow suite as in the first three regions in the north above. In the Atlantic, Convective storms have greater height of storm tops followed by the unclassified and stratiform. A very similar pattern is observed in Figure 2(c) (JJA), as in DJF, except that in the desert, semidesert and brush grass savanna (North), the convective is second to the unclassified unlike in DJF where stratiform is second to unclassified, also in deciduous forest (South) and brush grass savanna (South), the convective storm top heights are greater but are decreasing unlike in DJF where the unclassified is Greater.
3.2. Seasonal Distribution of Storm Height Histograms
3.2.1. Seasonal Distribution of Storm Height Histograms over Africa
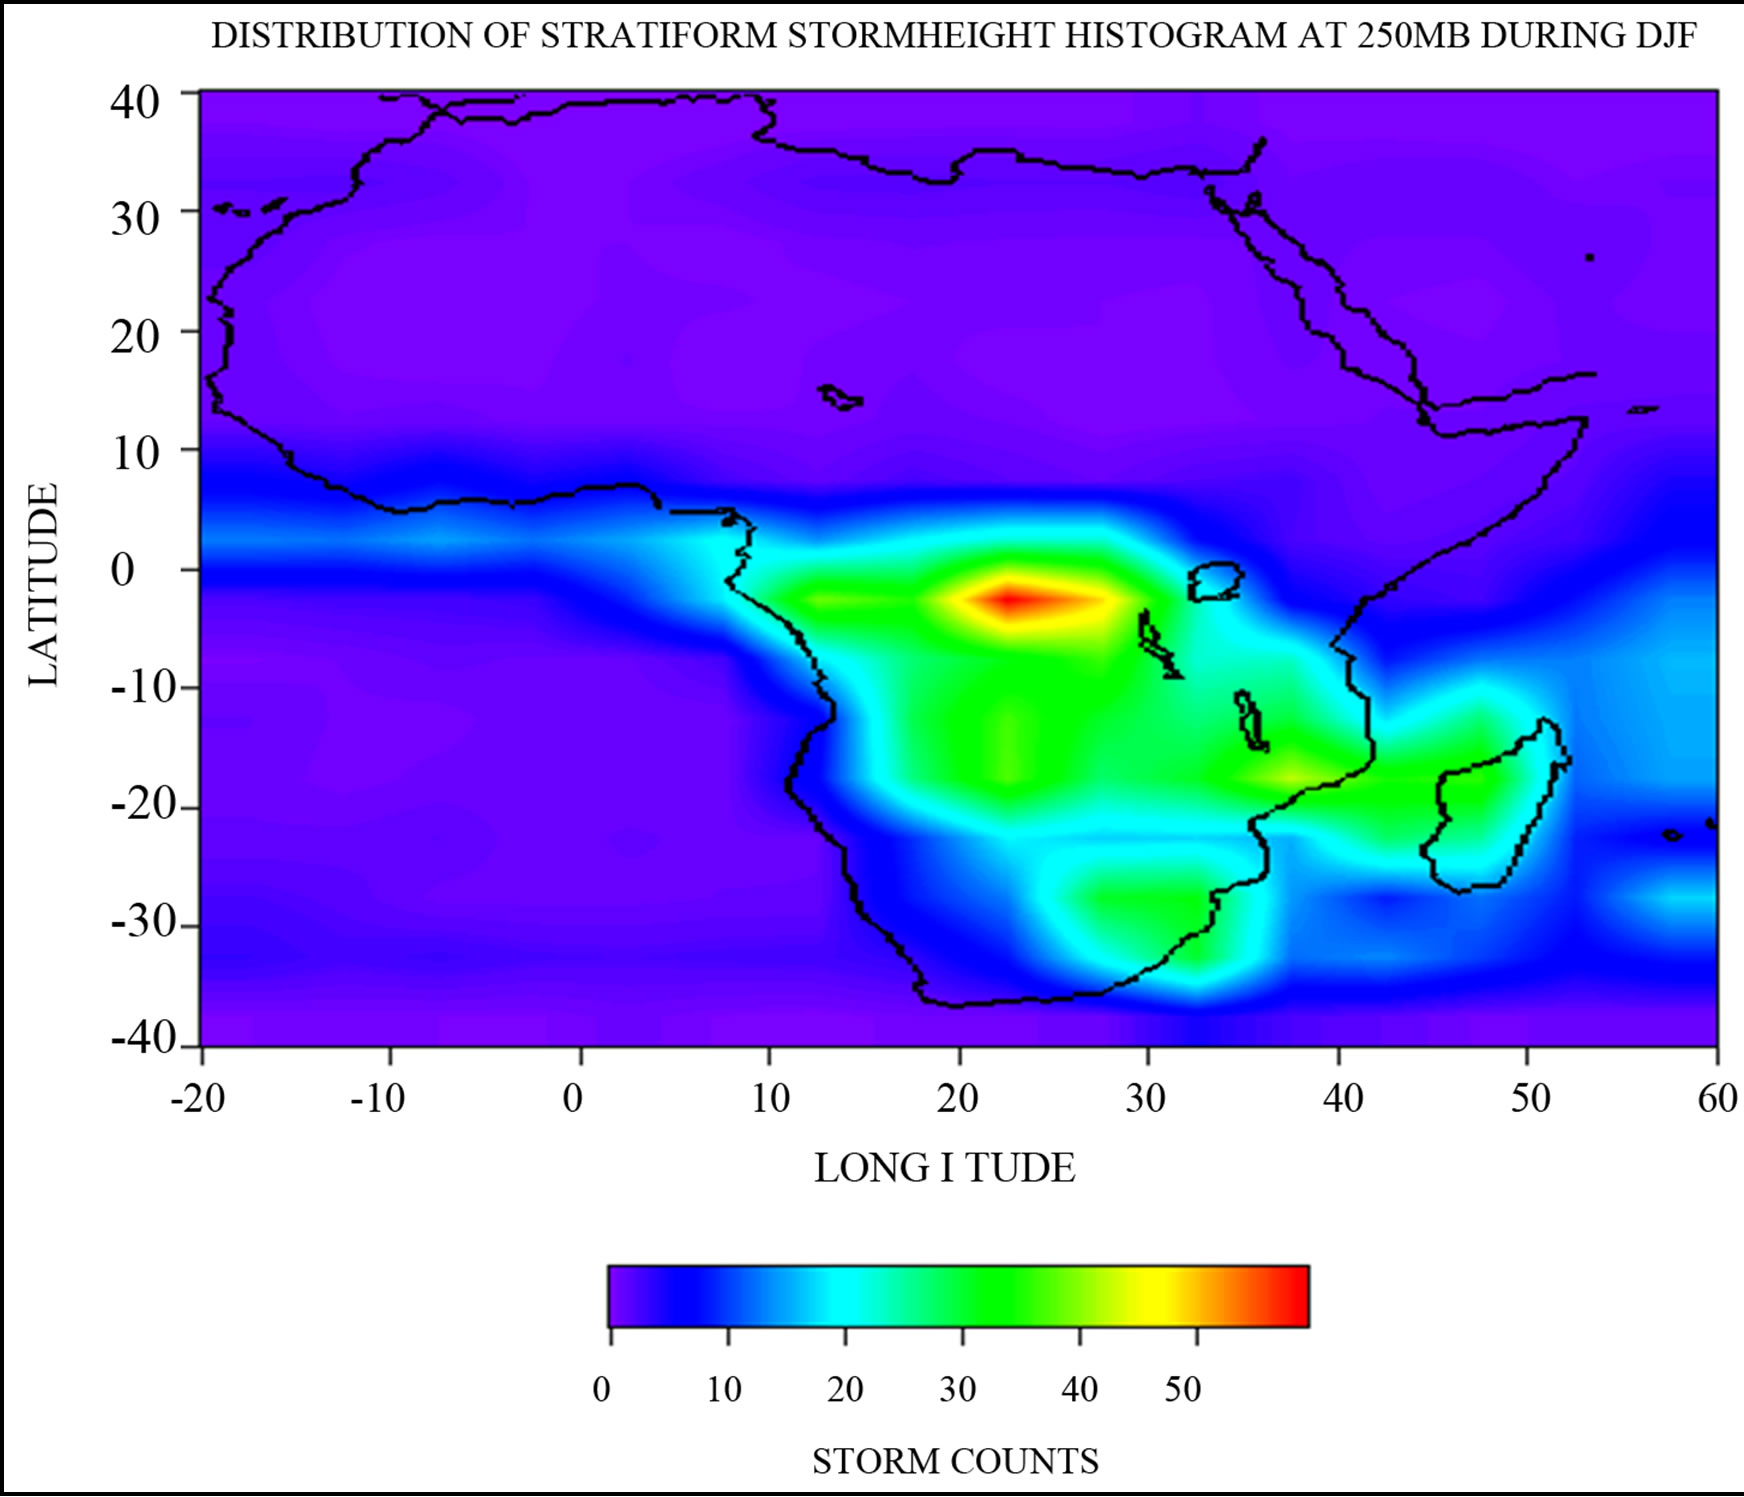
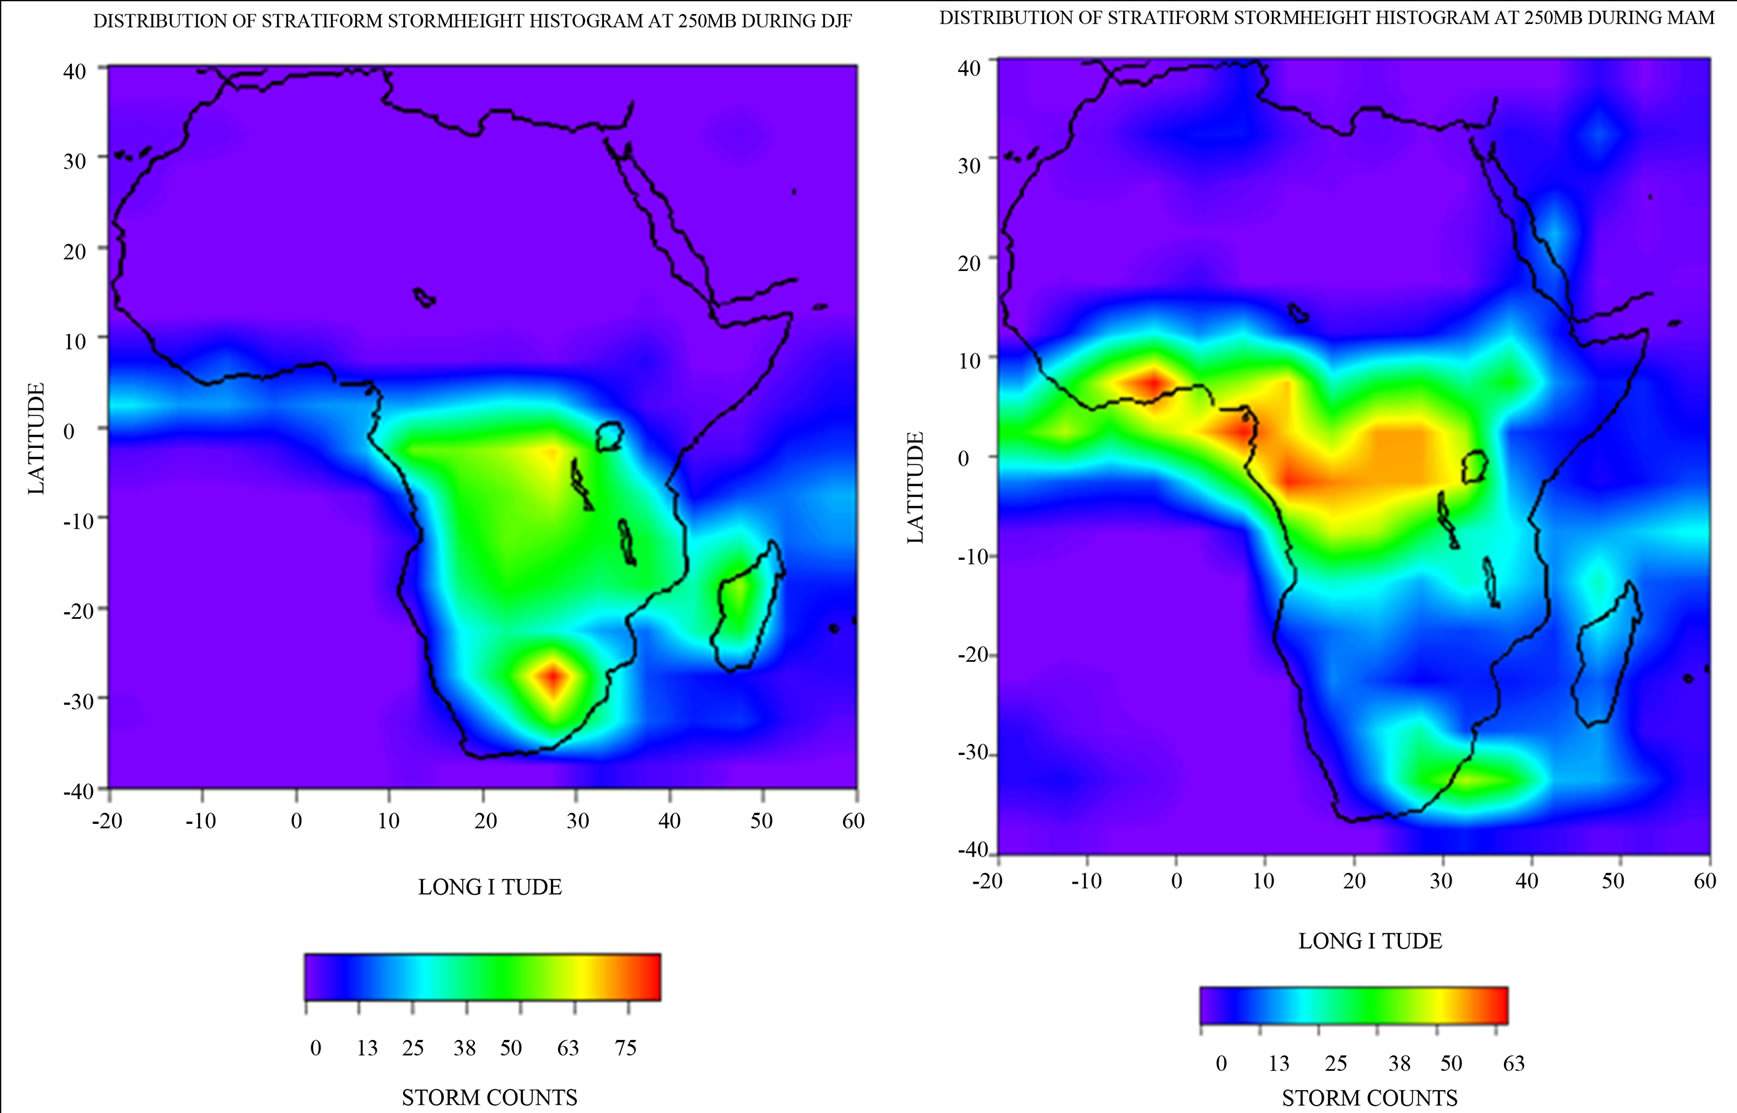
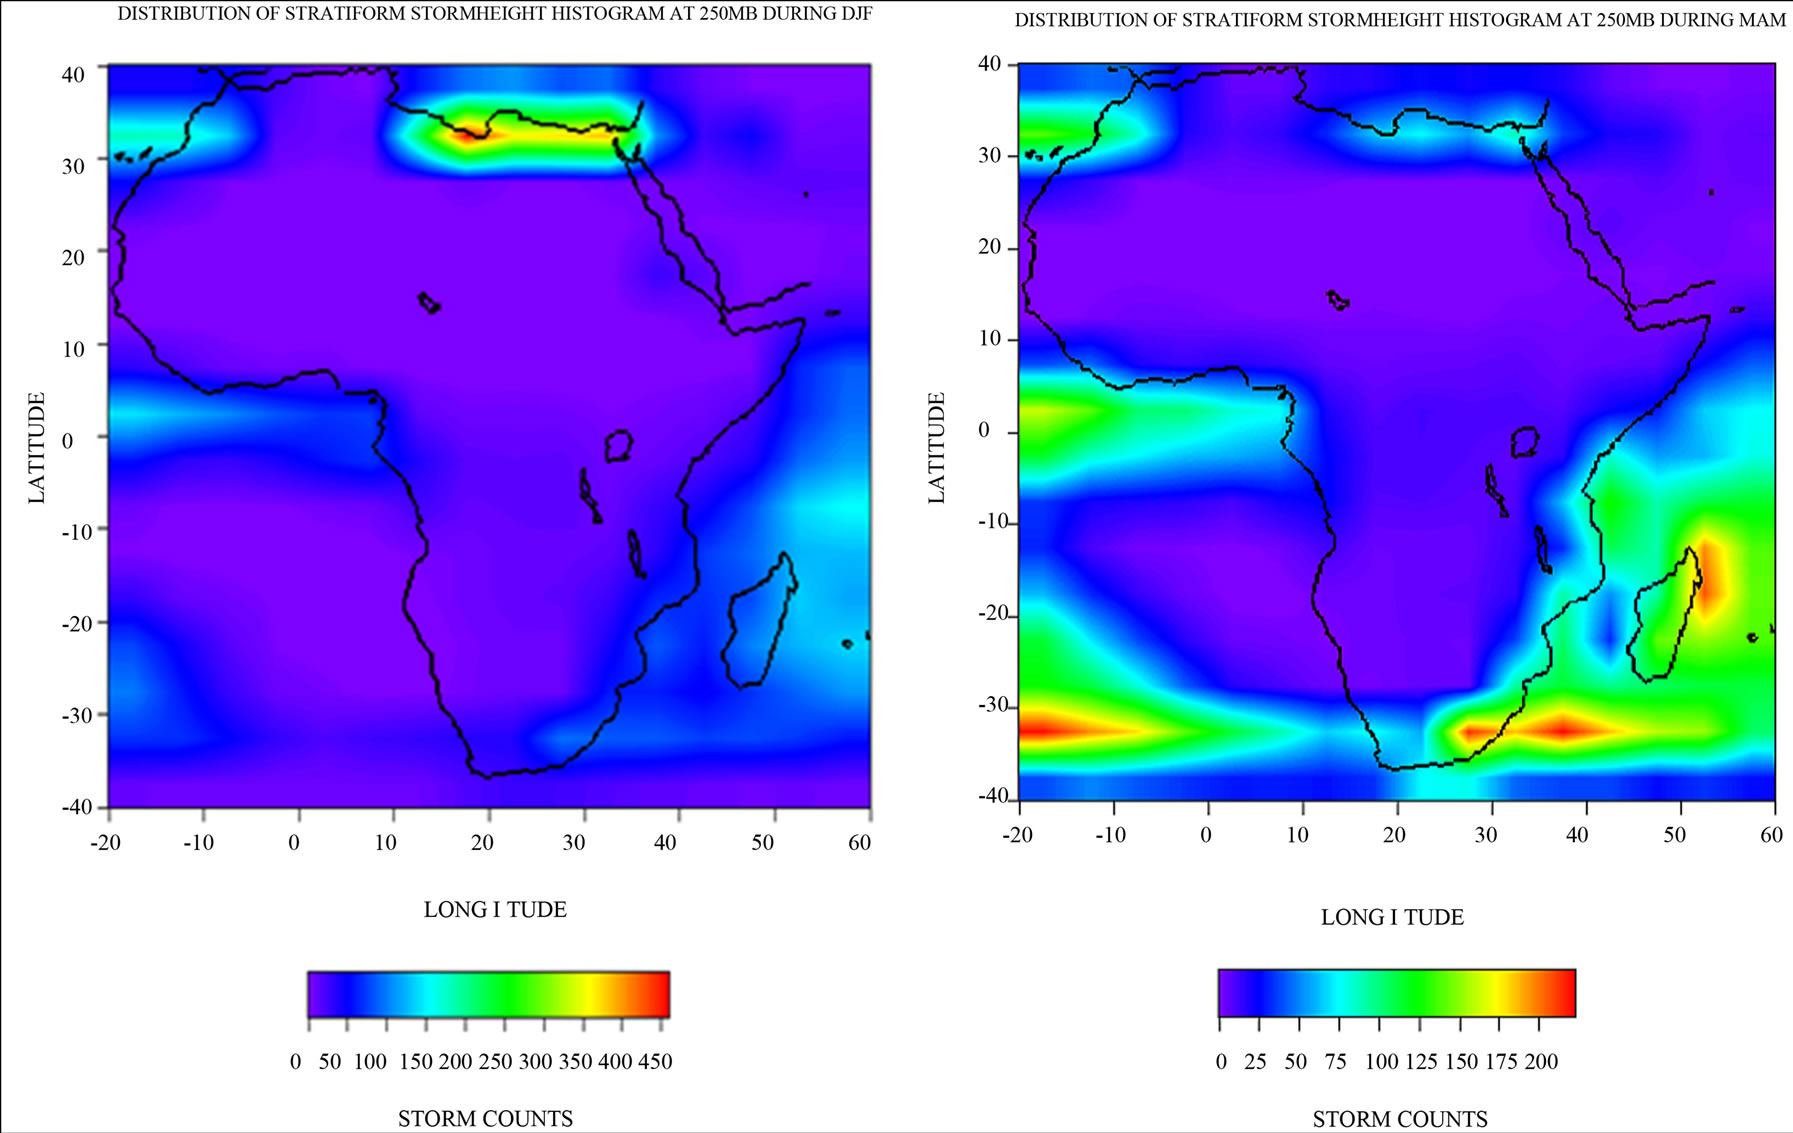
Here, emphasis will be laid only on histograms at 250 mb (TEJ level) and 700 mb (AEJ level) levels because of the importance of the Tropical Easterly Jet and Africa Easterly Jet in the continent. Simple storm counts in Figure 3(a) shows that there are high concentrations of stratiform storms extending from central Africa down to the East of Southern Africa, including Madagascar. Although, the AEJ, which has it southernmost limit at about 3˚N, is not observed, the TEJ has its southernmost limit at about 8˚S in February. The influence of the TEJ at this latitude could be the cause of the very high concentration of stratiform storms in the Congo (DRC). Another possible cause of the high storms especially in the Madagascar could be the winter Monsoon in the Indian Ocean. Although, the cool, dry air from the land in Asia is poor in moisture content, but on reaching the Madagascar region, it would have been moistened because of the large ocean mass and distance covered before reaching there, thus inducing storms and hence precipitation in the region. In spring (MAM), as shown in Figure 3(b), storm activities
 (a)
(a)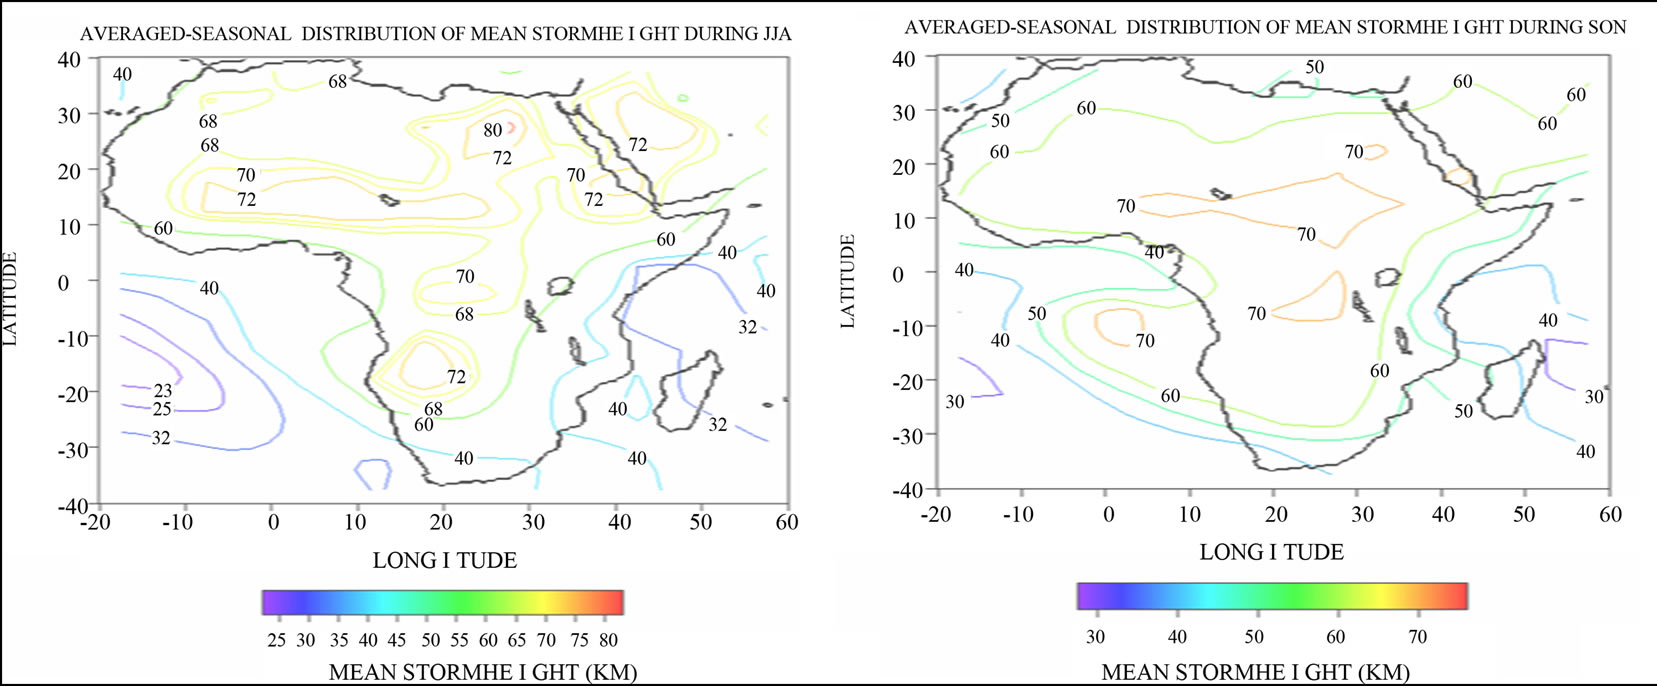 (b)
(b)
Figure 1. Composite averaged storm height distribution during: (a) DJF; (b) MAM; (c) JJA; and (d) SON. Units are hundreds of meters with contours between 20 and 80 × 102 meters.
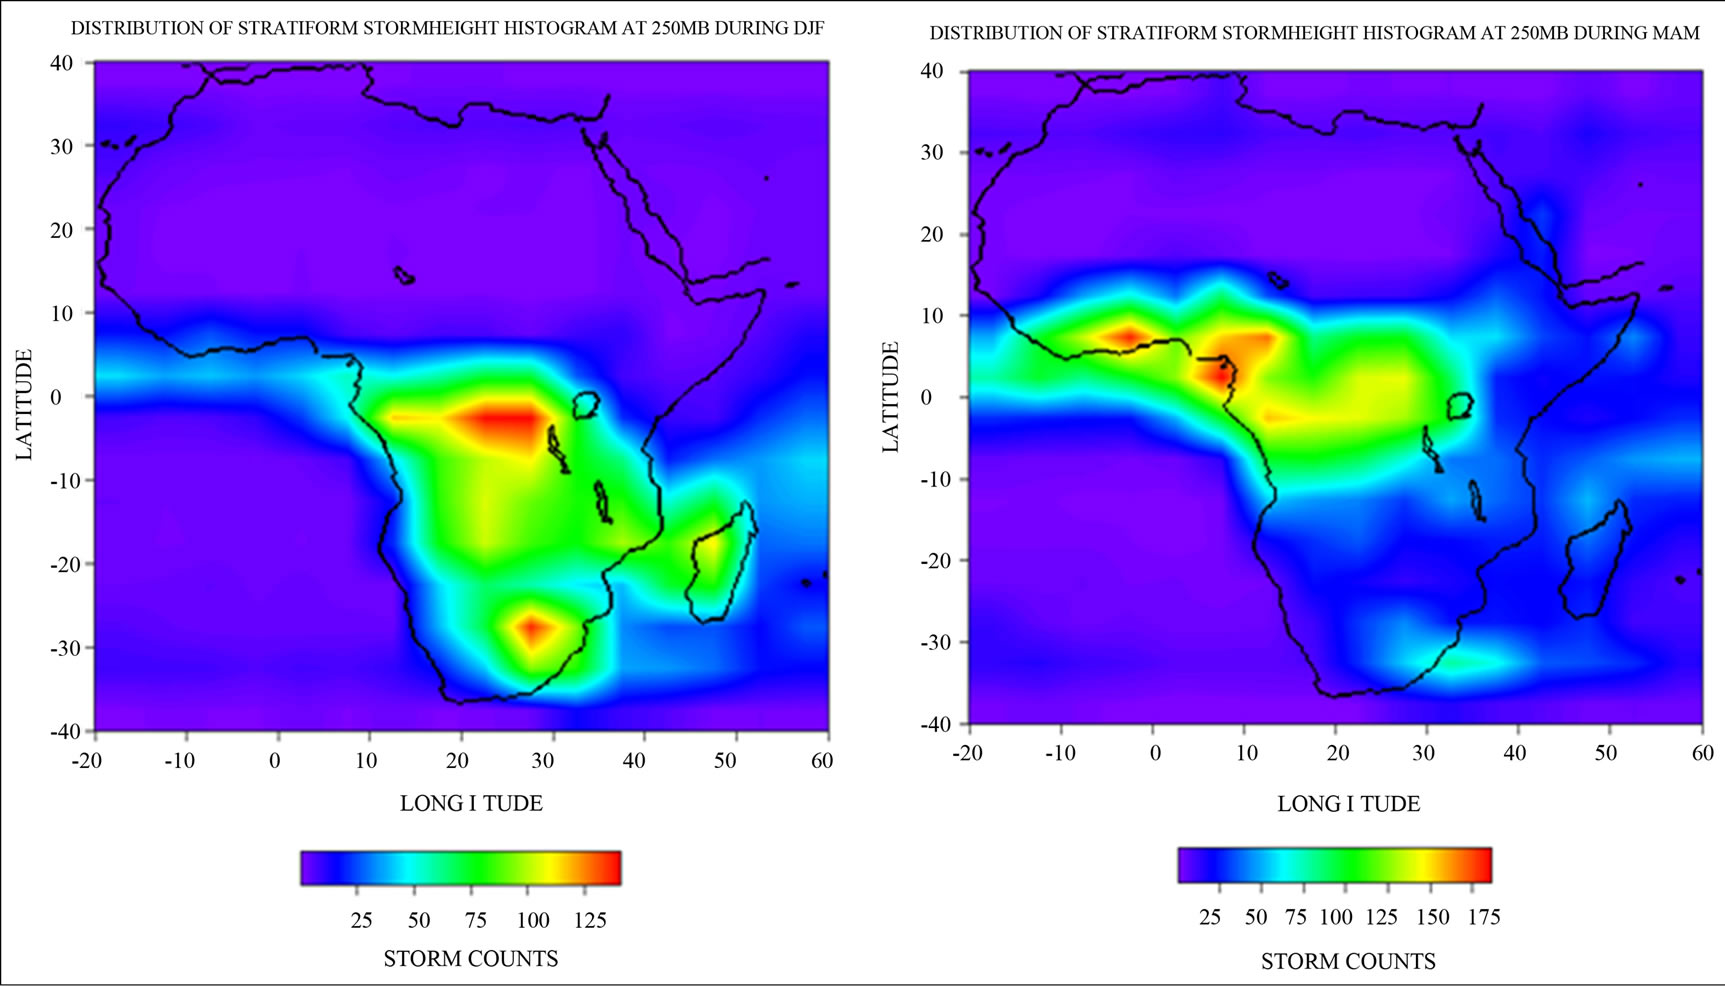
have already shifted to W/Africa with a strong core around 3˚N, this corresponds to the southernmost position of the AEJ. The ITD is already ahead and the Southeasterly have started gaining strength over the landmasses. During the summer, as shown in Figure 3(c), the storms at this level have already migrated up to the savanna and Sahel region having the TEJ core at around 12˚N, which correspond to the core of the storm. By autumn, in Figure 3(d), storms concentrations are in the central Africa region.
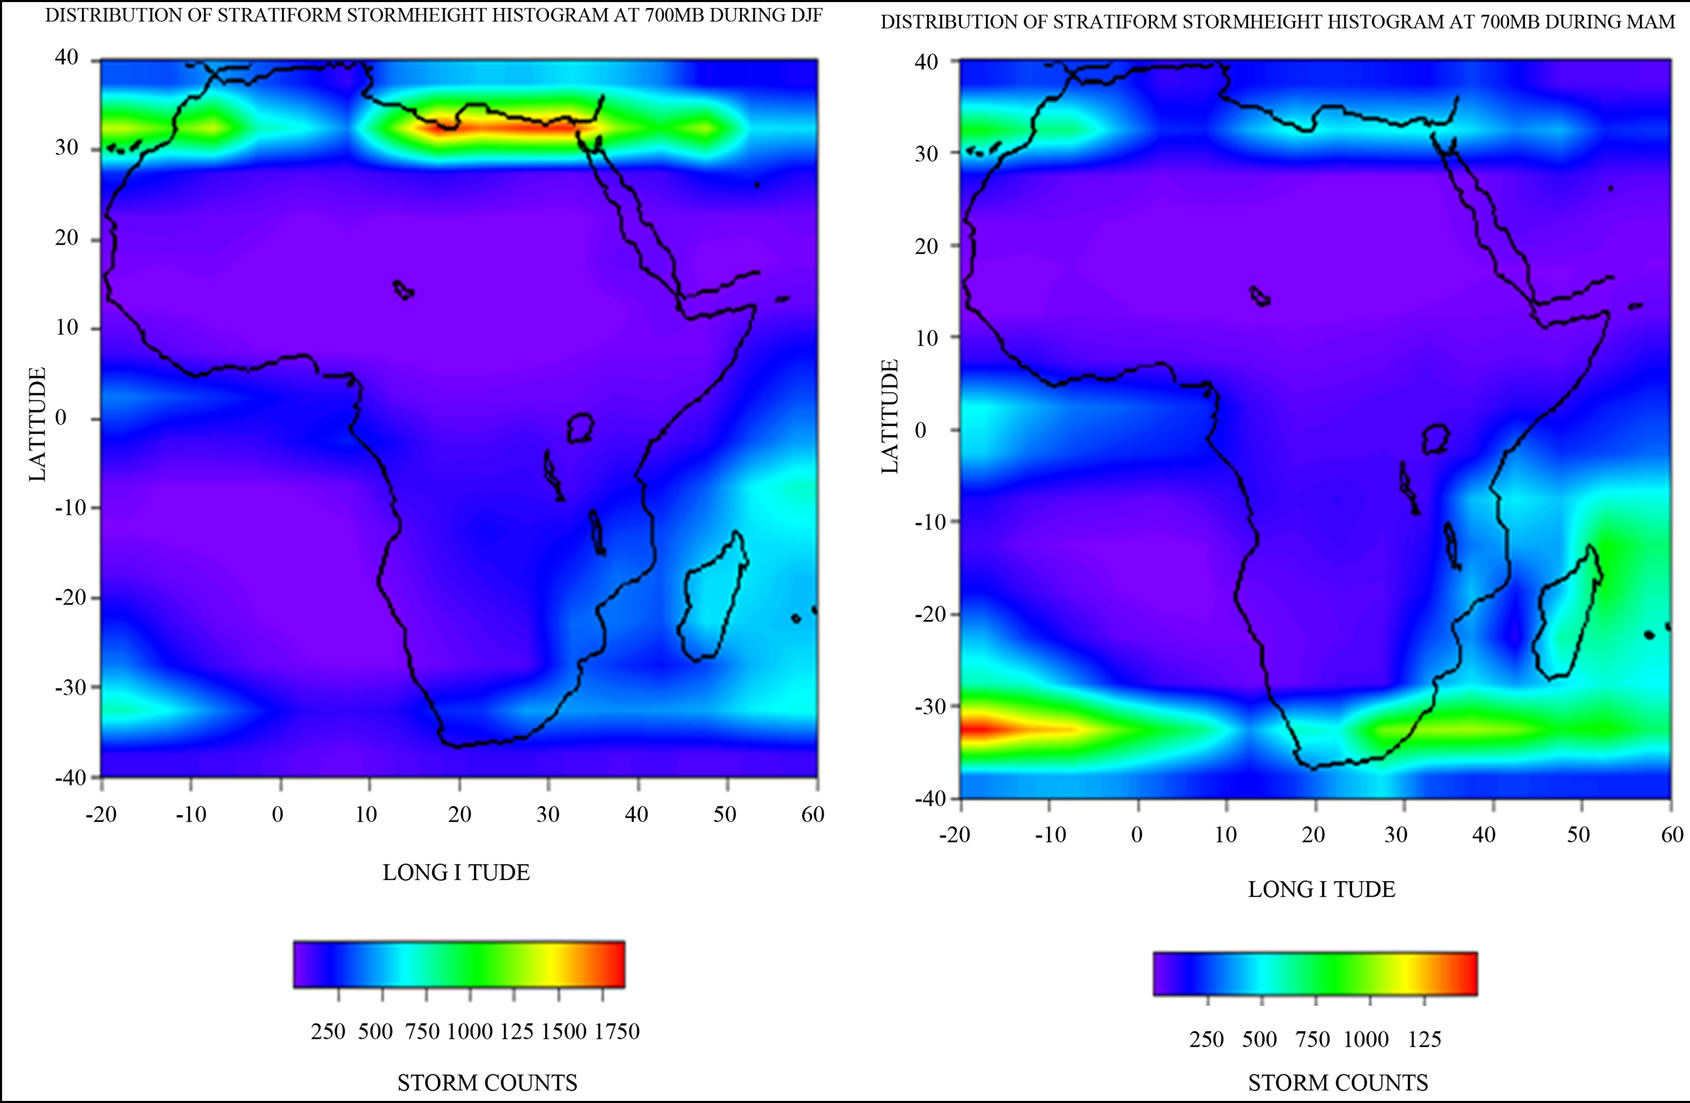
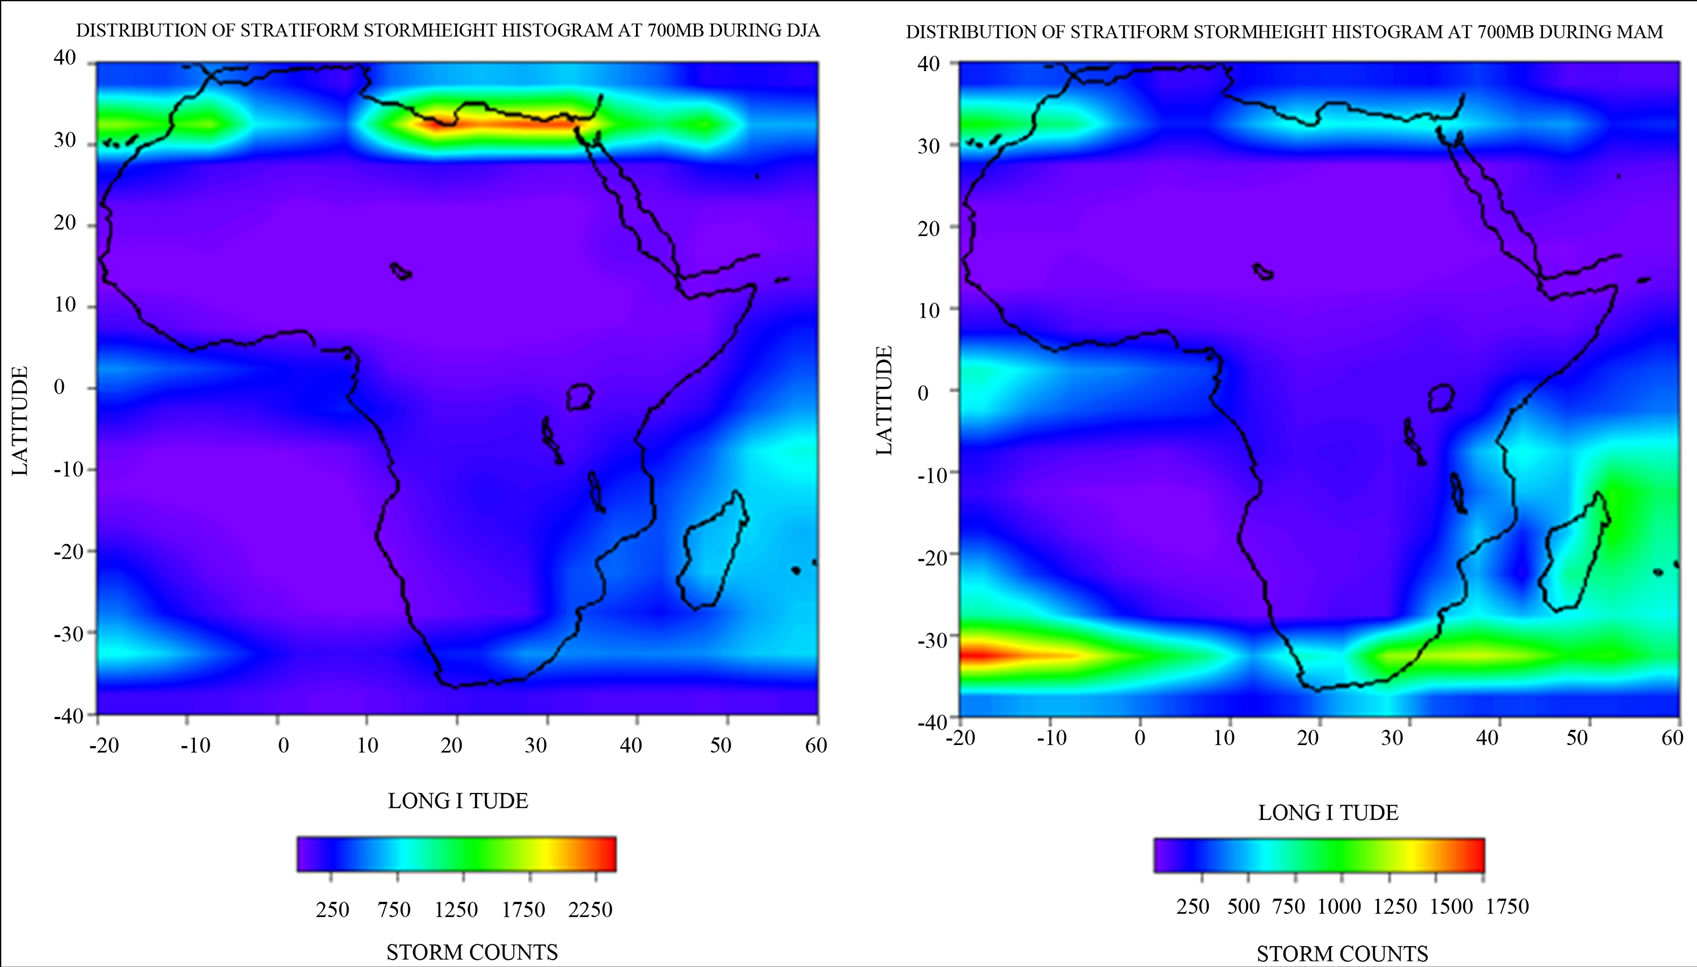
As shown in Figure 4, all through the year, at 700 mb, stratiform storms are majorly concentrated around the oceans and the Mediterranean sea and some parts of the land near the sea where the storm core (high storm counts) are located, in Figure 4(a) (DJF). In Figure 4(b) (MAM), we have high concentrations of storm counts in the South Atlantic Ocean extending through South Africa to Madagascar in the Indian Ocean. Similar occurrence is observed in Figures 4(c) (JJA) and 4(d) (SON) but in SON the storm histogram is very low almost disappearing in the Indian Ocean.
Figure 5 shows the seasonal distribution of convective storm height histogram at 250 mb. As compared to stratiform storm height histograms, in Figure 5(a) (DJF), the convective storms covers the same region but with a larger land masses than the stratiform storm, and having a core in Southern Africa; this time the storms are located on the land due to convection over the land surface but shallow storms are observed over the Ocean as seen in Madagascar for the stratiform storm above. During MAM, as shown in Figure 5(b), the same pattern is observed, with storm concentration migrating to West Africa where the core (region of high storm counts) extend over a large area from central to some parts of West Africa. Some small storm counts are concentrated in southern Africa region where the core was located in DJF, the previous season. The African Easterly waves are prominent during June to early October. In summer (JJA), as
 (a)
(a)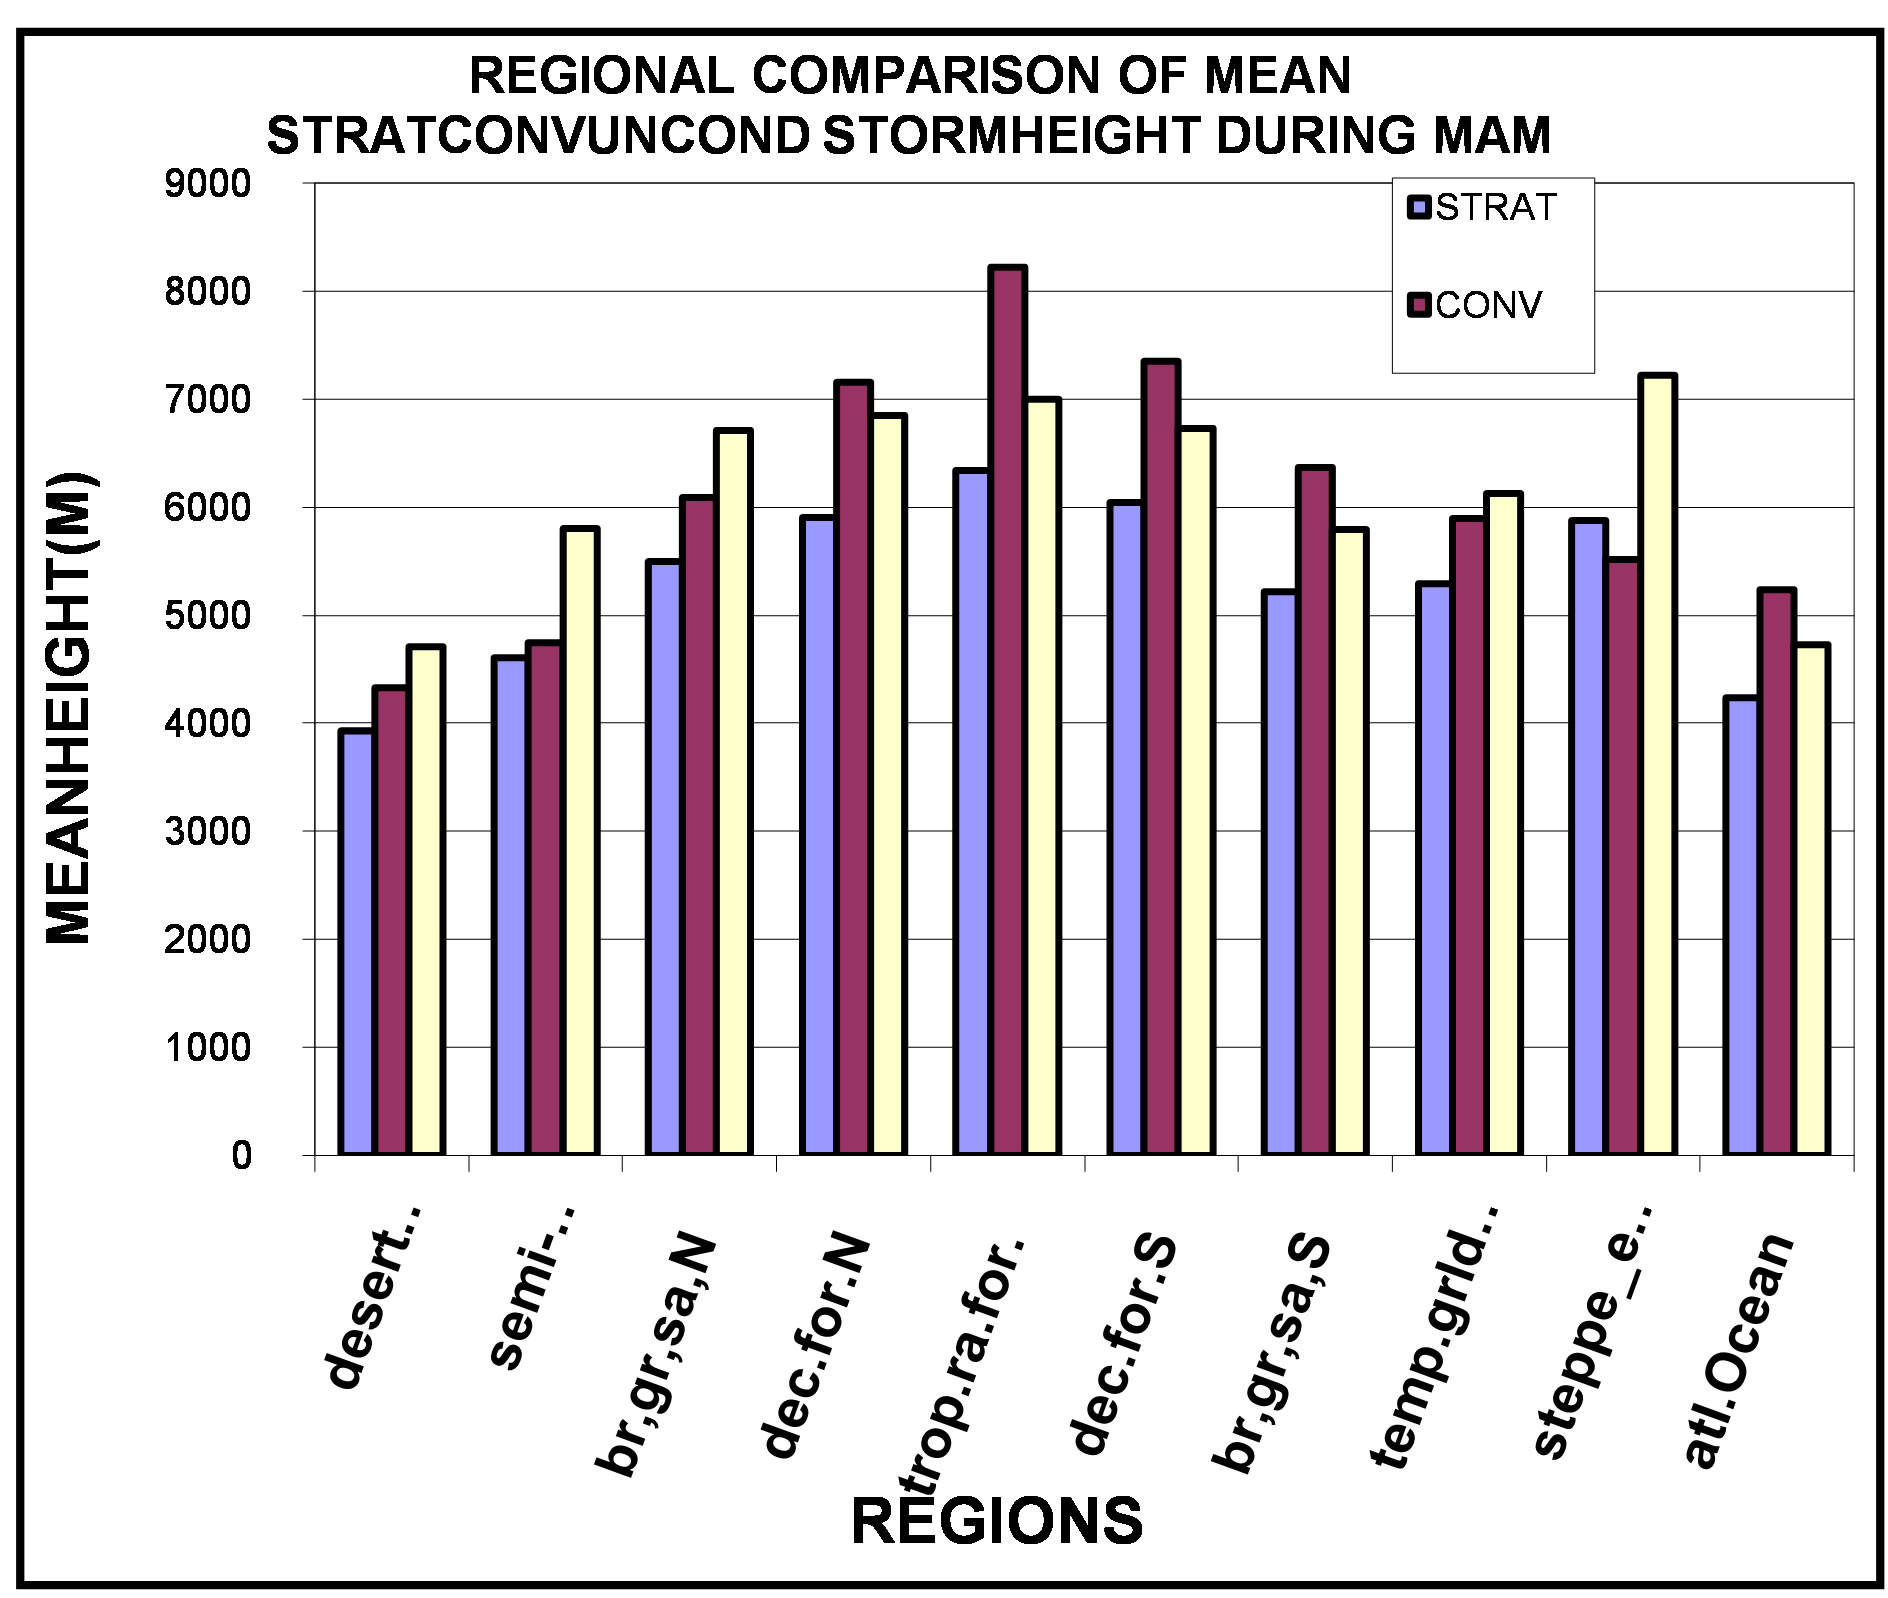 (b)
(b) (c)
(c) (d)
(d)
Figure 2. (a) and (b) Regional comparison of the mean seasonal stratiform, convective, and unconditioned storm height, during: (a) DJF, and (b) MAM; (c) and (d) Regional comparison of the mean seasonal stratiform, convective, and unconditioned storm height, during: (c) JJA, and (d) SON.
shown in Figure 5(c), the storm had spread from West Africa through central Africa to the horn of Africa having a very small core in the horn of Africa. The AEJ’s instability creates ridges and troughs that form the wave features, which underlay the upper tropospheric TEJ. As the wave propagates westward above the convergence zone of the ITD, it appears to modulate the ITD features on the ground thus providing additional moisture along the west coast of Africa that wouldn’t otherwise exist with the monsoon alone. Summer heating causes the development of a strong latitudinal pressure gradient and the development of an easterly jet stream (TEJ), which migrate the storms to the west coast of Africa, at an altitude of about 15 km and a latitude of 25˚N. By autumn, in Figure 5(d), the easterly jet stream is replaced with strong westerly winds of the mid-latitude which tends to shift storm activities towards central and eastern Africa, in the upper atmosphere. Thus, movements begins in the South to West Africa, from DJF to MAM, it spreads from West Africa through central Africa to East Africa, from MAM to JJA, and by SON, there is a downward migration of storm core to the South again. Storms from deep convective systems generate latent heat.
As for the stratiform, at 700 mb, convective storm histograms are concentrated over the ocean rather than in the land. In Figure 6(a) (DJF), core is located close to the Mediterranean Sea but around 33˚N inland, which is the same location as the stratiform core in DJF. In Figure 6(b) (MAM), the pattern is exactly the same as in stratiform, but the convective cores are stronger at South Atlantic Ocean, Lesotho and Madagascar regions. During JJA, as shown in Figure 6(c), storms are still concentrated in the South but are weakening with only one core at Lesotho region, by SON, in Figure 6(d), the core is
 (a)
(a)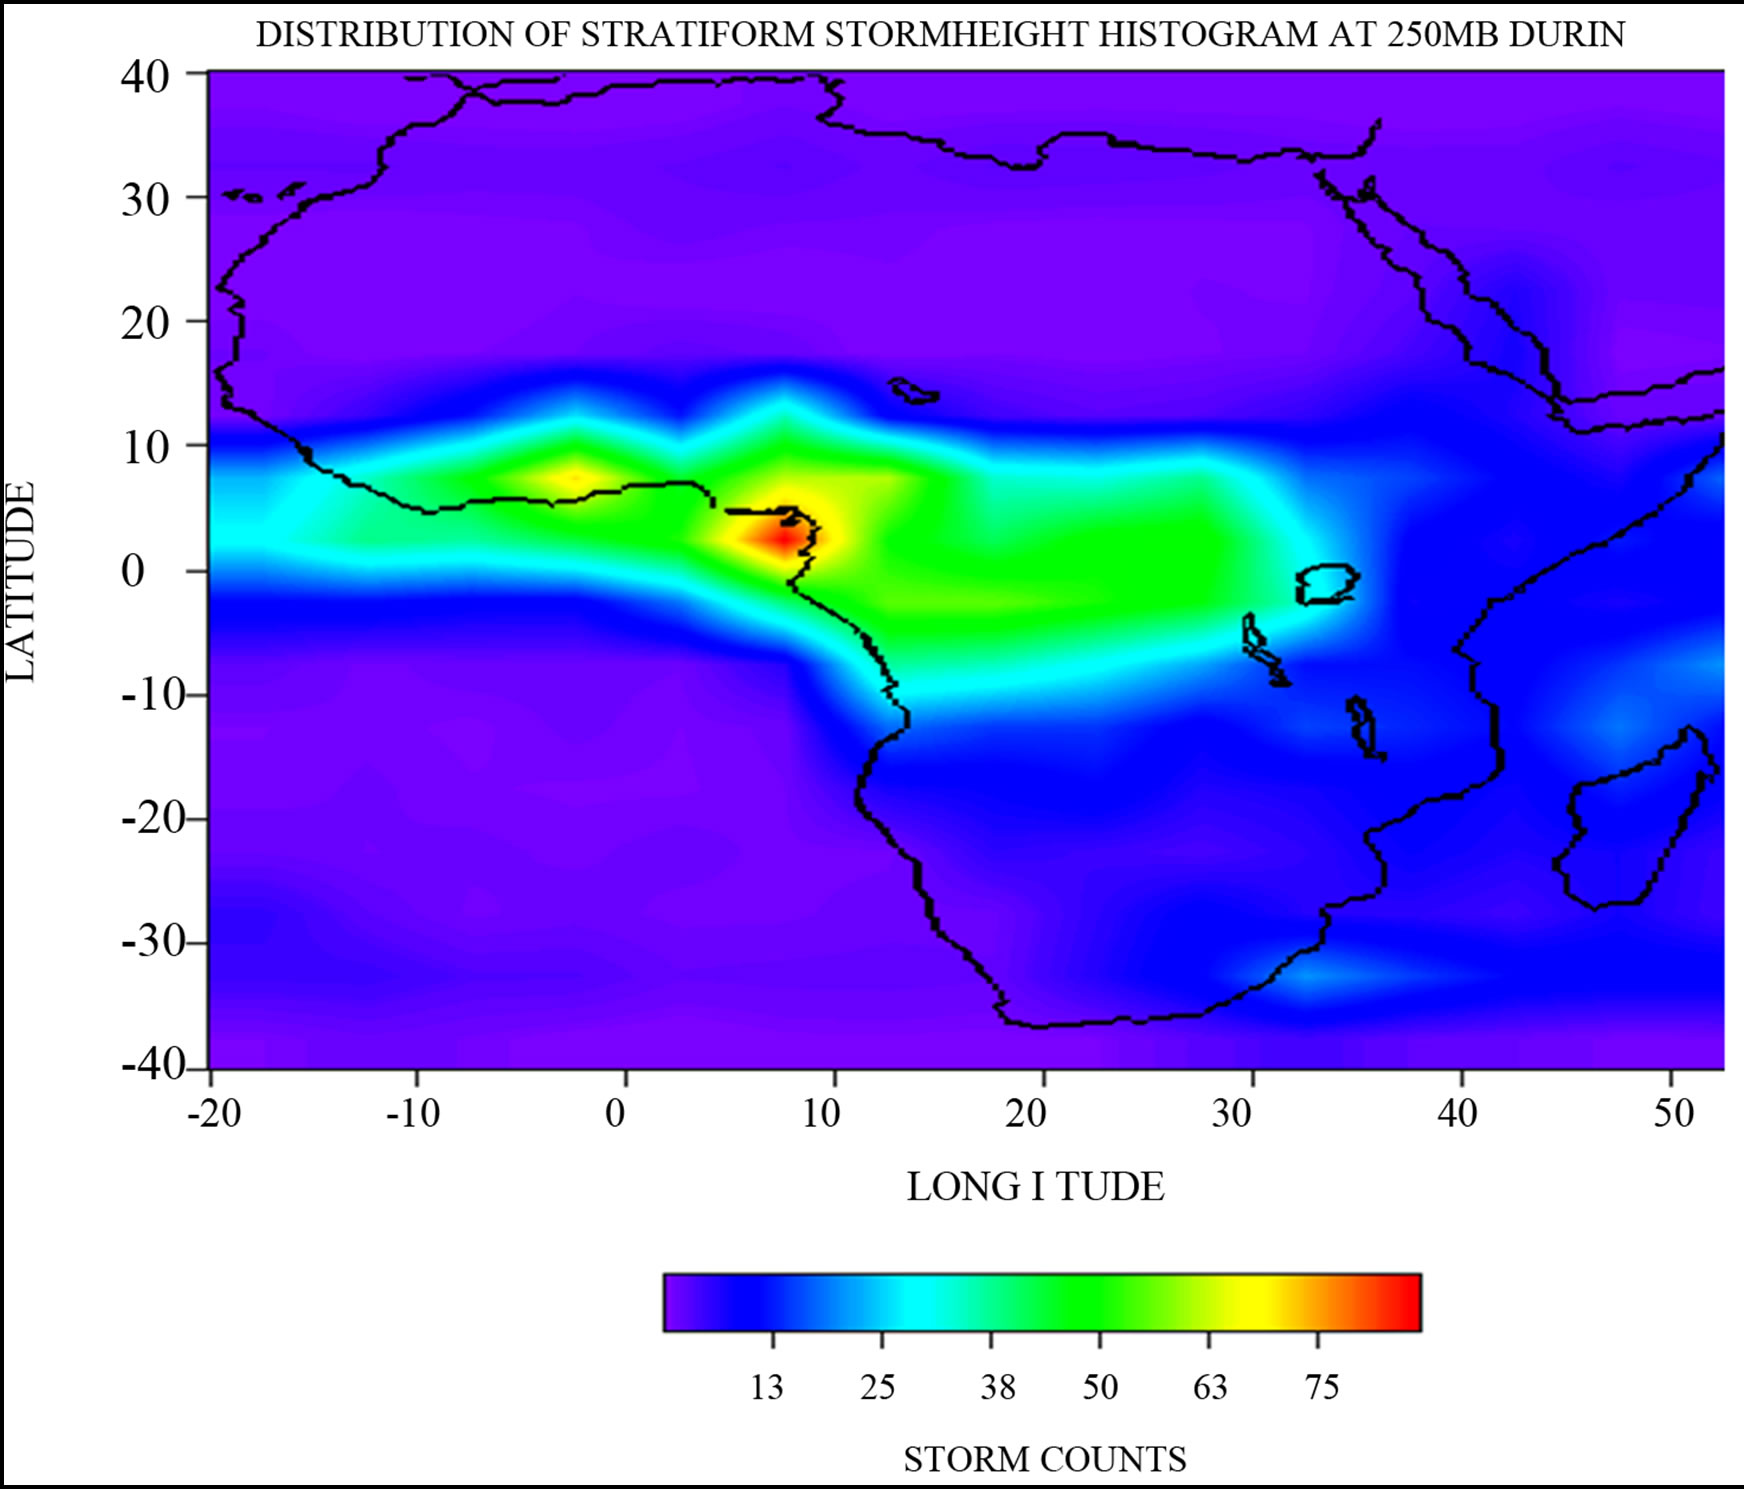 (b)
(b)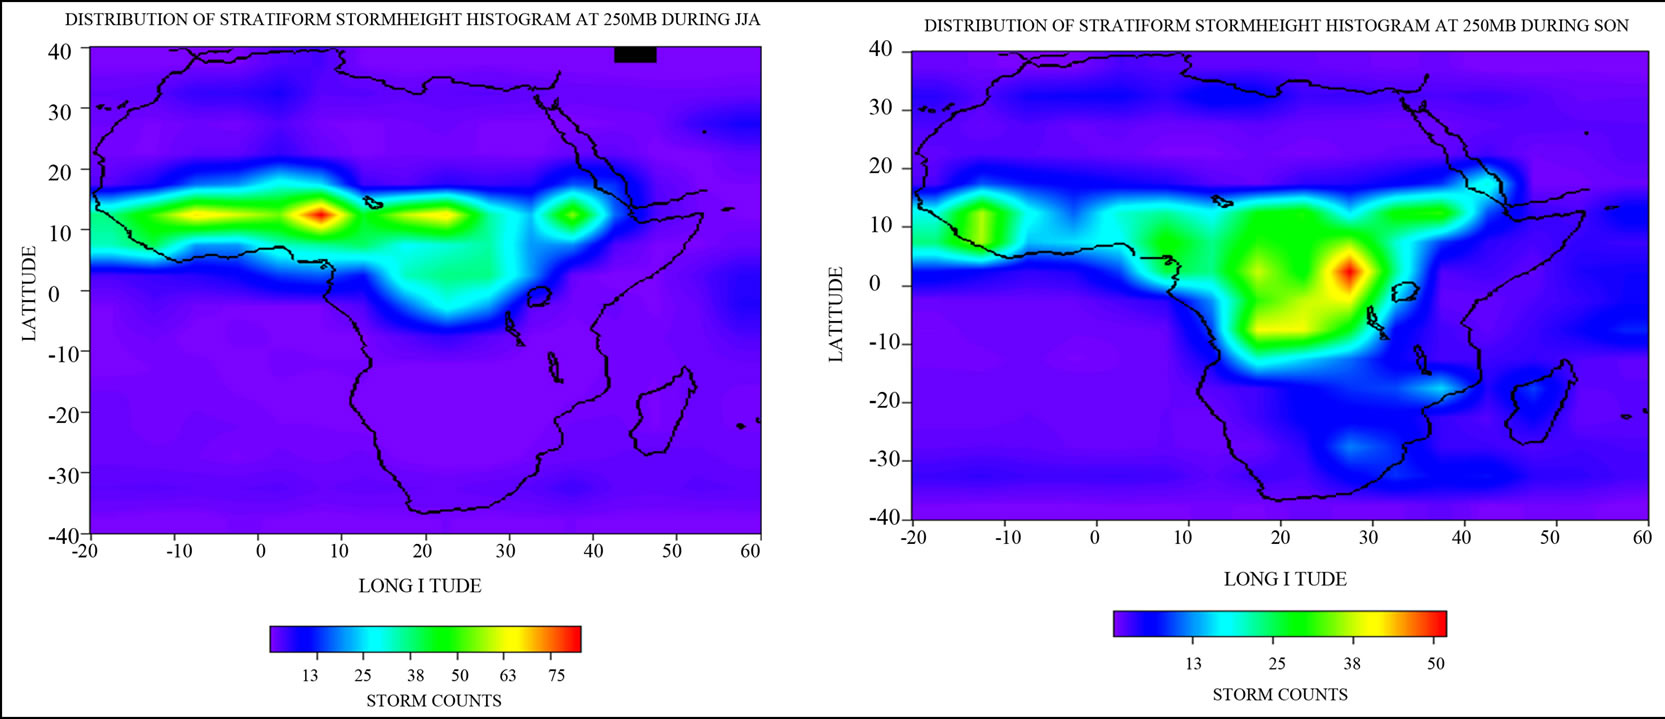 (c)
(c)
Figure 3. (a) and (b) Stratiform storm height histograms at 250 mb (11 km) during: (a) DJF, (b) MAM; (c) and (d) Stratiform storm height histograms at 250 mb (11 km) during: (c) JJA, and (d) SON.
still there but the Atlantic storm counts are decreasing already in the period.
At 250 mb, during DJF, the stratiform core is located in the Congo region while the convective core is located down South in the Kalahari region in South Africa. These two storms core are visualized when all types of storms are considered in Figures 7(a). But the region where stratiform core is located covered more land areas than when only the stratiform storm is considered, thus the presence of other storms is visualized at the location. In Figure 7(b) (MAM), the storms location had already moved to West Africa having two cores, one (the larger) extending from the coast into the savanna North through Nigeria/Cameroon and the other around Togo/Ghana. As expected in Figure 7(c) (JJA), the storm spreads from West Africa through central to the horn of Africa with four cores in the same latitude spreads across the three regions. In Figure 7(d) (SON), the storms have started migrating to the south with only one core in central Africa.
Just as for stratiform and convective, at 700 mb, the same pattern is observed when all types are considered, in Figures 8, with cores located close to the Mediterranean in Figure 8(a) (DJF), extending from the Atlantic through Lesotho (in South Africa) to the Indian Ocean in Figure 8(b) (MAM), and having a horizontal extension from the Atlantic through the Lesotho to the Indian Ocean in Figure 8(c) (JJA), and a similar pattern as well in Figure 8(d) (SON) with lower storm counts in the Indian ocean.
3.2.2. Regional Distribution of the Storm Height Histogram
Figure 9 shows the comparison of the total, convective
 (a)
(a)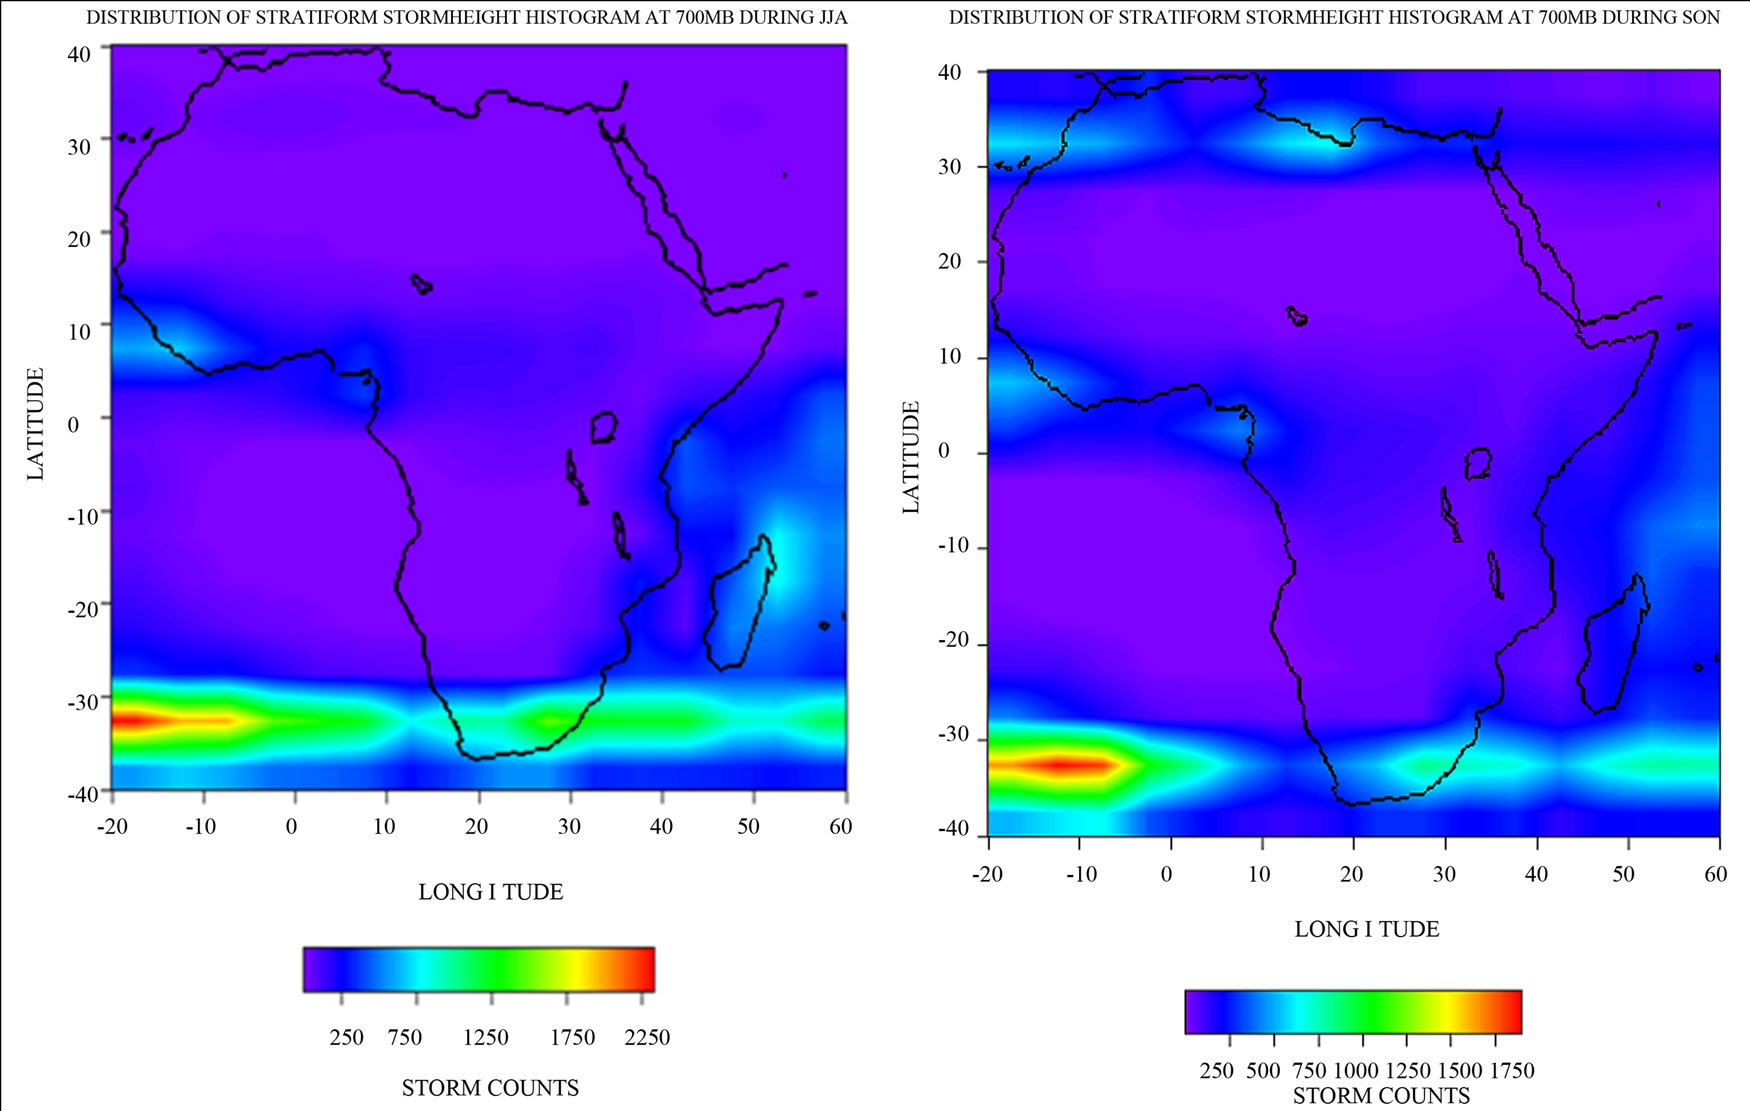 (b)
(b)
Figure 4. (a) and (b) Stratiform storm height histograms at 700 mb (3 km) during: (a) DJF; (b) MAM; (c) and (d) Stratiform storm height histograms at 700 mb (3 km) during: (c) JJA, and (d) SON.
 (a)
(a)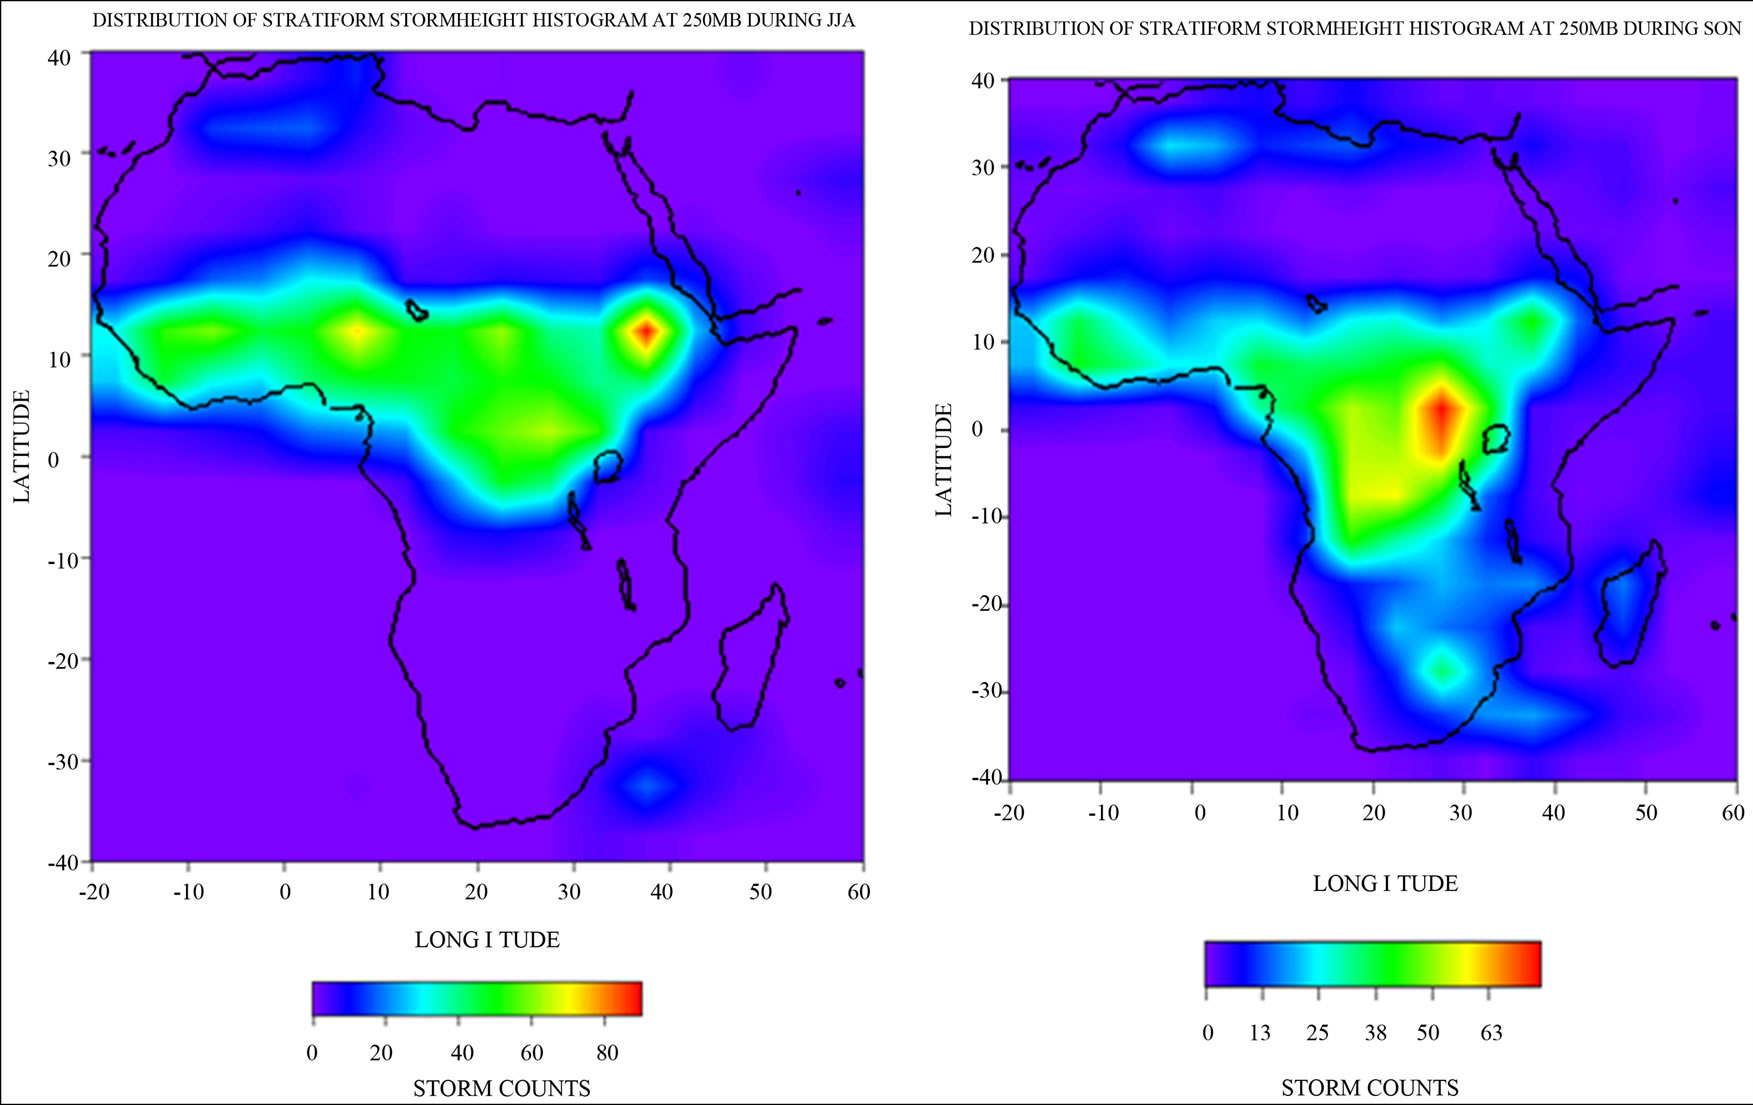 (b)
(b)
Figure 5. (a) and (b) Convective storm height histograms at 250 mb (11 km) during: (a) DJF; (b) MAM; (c) and (d) Convective storm height histograms at 250 mb (11 km) during: (c) JJA, and (d) SON.
 (a)
(a) (b)
(b)
Figure 6. (a)-(d) Convective storm height histograms at 700 mb (3 km) during: (a) DJF; (b) MAM; (c) JJA; and (d) SON.
 (a)
(a)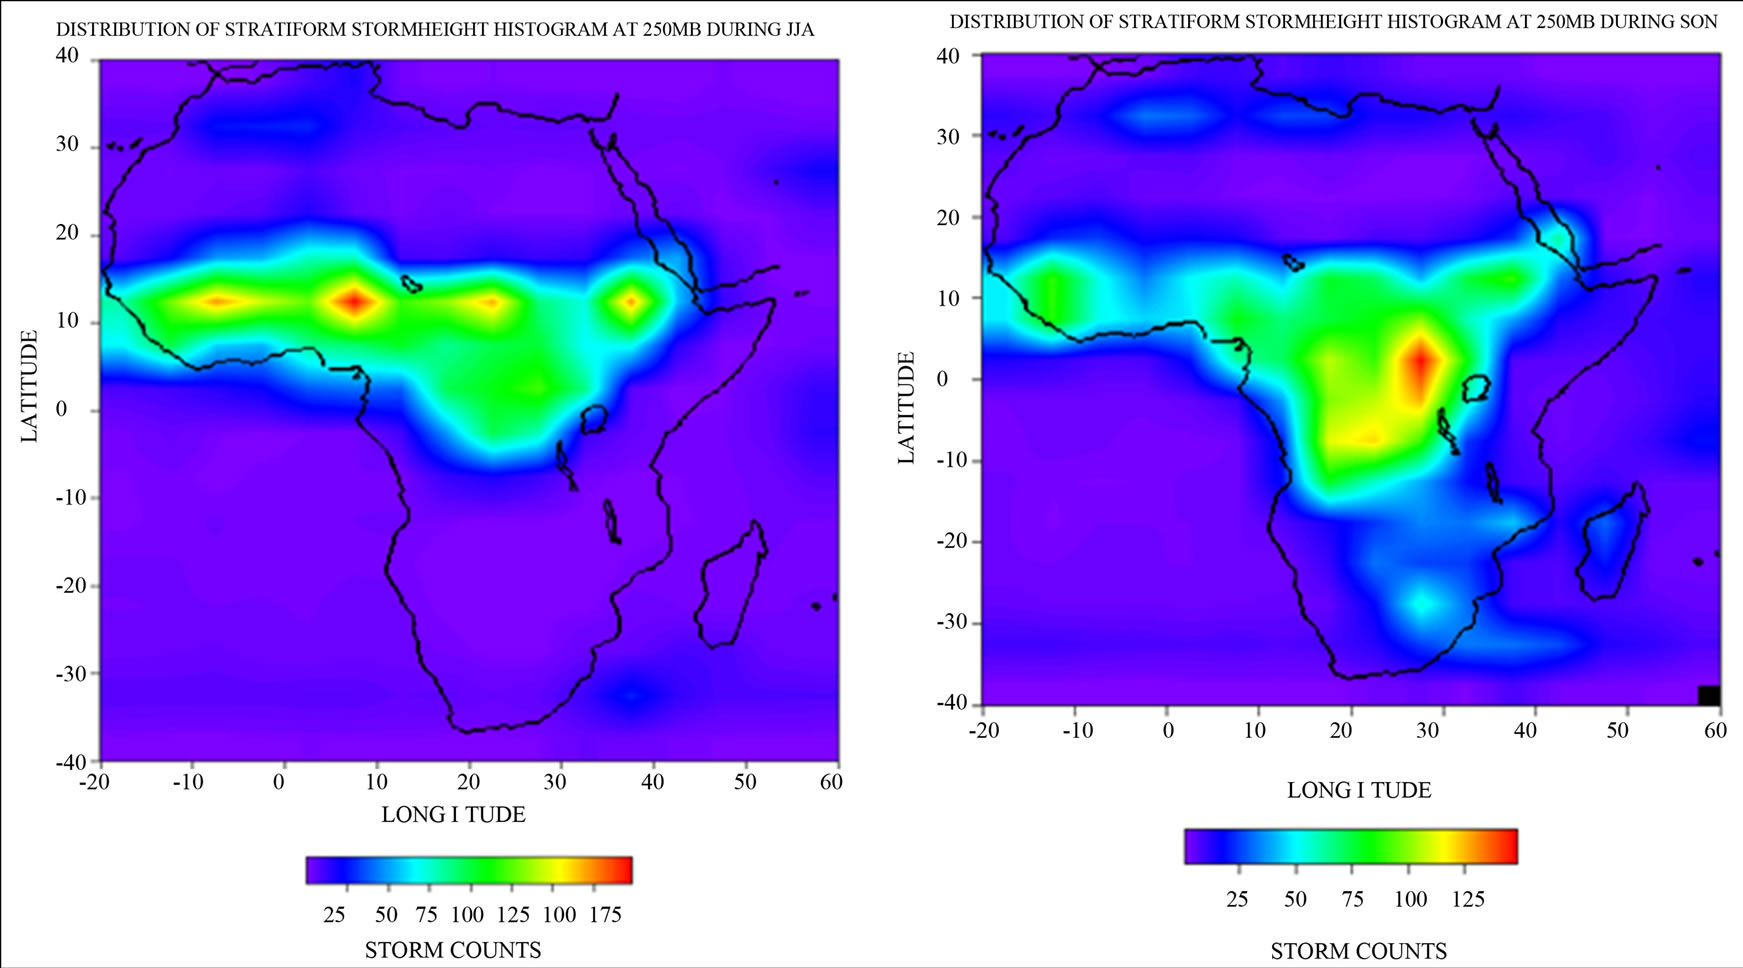 (b)
(b)
Figure 7. (a) (b) All (convective + stratiform + others) storm height histograms at 250 mb (11 km) during DJF, MAM; (c) (d) All (convective + stratiform + others) storm height histograms at 250 mb (11 km) during JJA, SON.
and stratiform storm counts over the desert region. The four seasons shows a bimodal distribution especially with the total and stratiform classification. The lower modes are consistently below 2 km while the upper modes are slightly above 4 km. The amplitude of the upper mode increases from 150 to about 400 from DJF, in Figure 9(a), to MAM, in Figure 9(b), respectively and decreases from 220 to 170 from JJA, in Figure 9(c), to SON, in Figure 9(d). Analysis of mean storm height on regional basis above reveals that, in the desert, stratiform
 (a)
(a)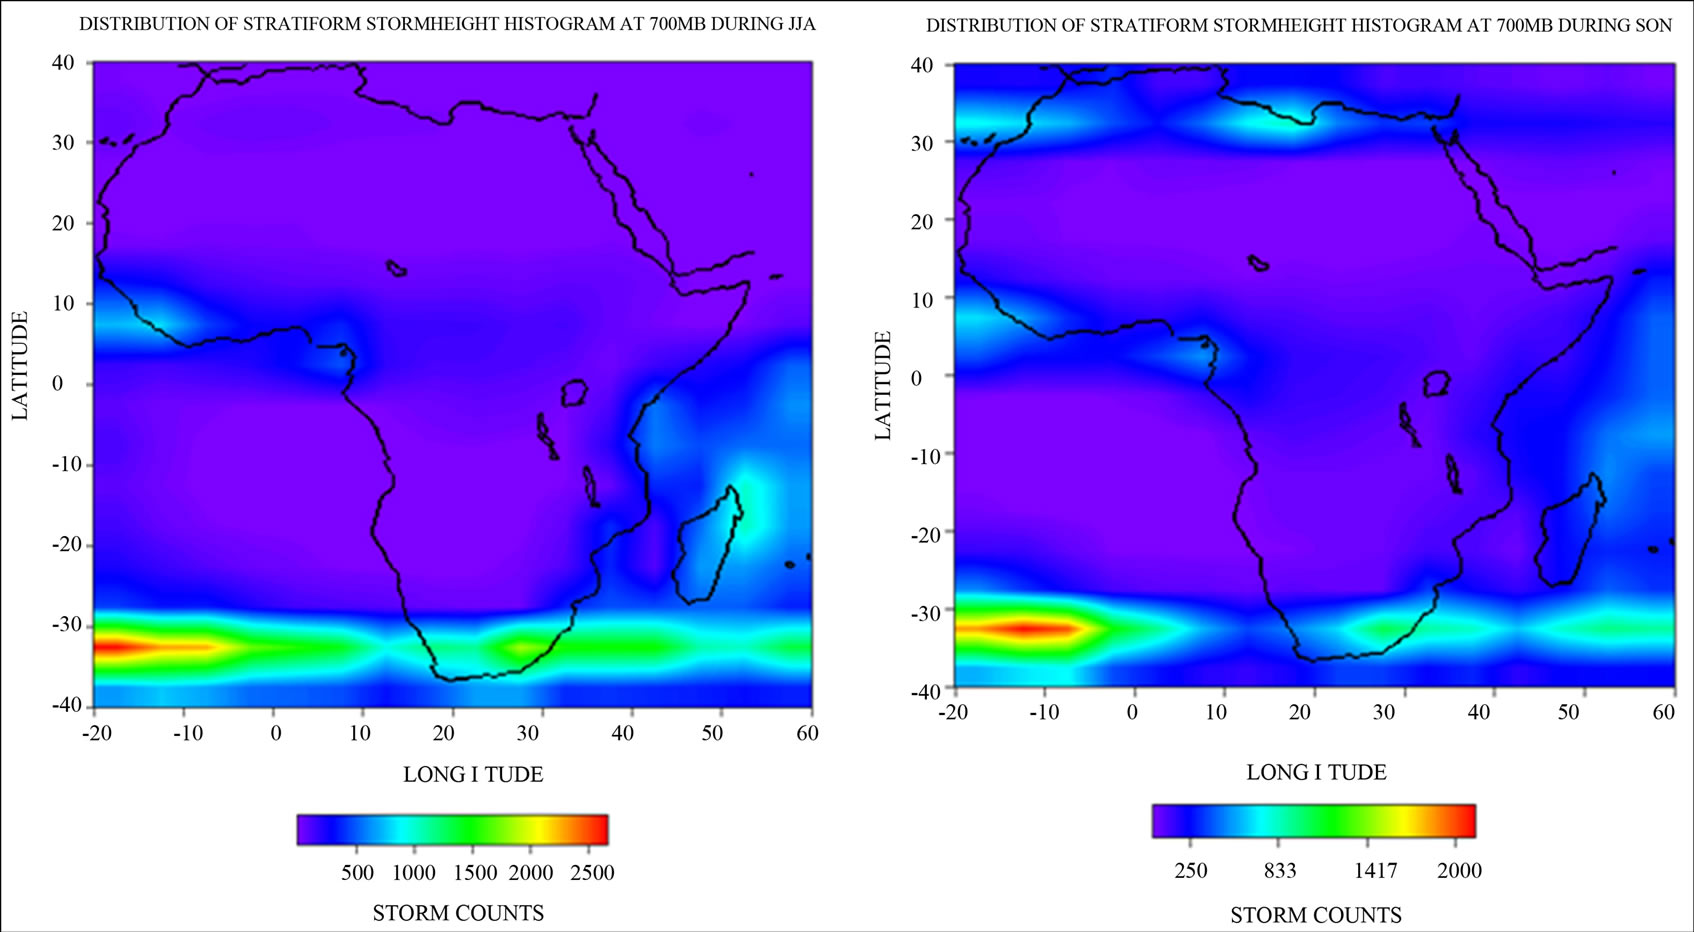 (b)
(b)
Figure 8. (a)-(d) All (convective + stratiform + others) storm height histograms at 700 mb (3 km) during DJF, MAM, JJA, SON.
storms have tops greater than that of the convective in DJF, JJA, and SON. Convective activities are virtually very low, thus, giving way for the stratiform storm counts to dominate. The amplitude of the lower mode increases initially from DJF to MAM but decreases from JJA to SON.
Figure 10 shows the Atlantic Ocean having a bi-modal distribution all through the four seasons. The lower mode, in Figure 10(a) (DJF), is slightly below 2 km with peak value at around 500 while the upper mode is near 5 km with amplitude of over 1200. In Figure 10(b) (MAM), the lower mode of the total and stratiform is
 (a)
(a) 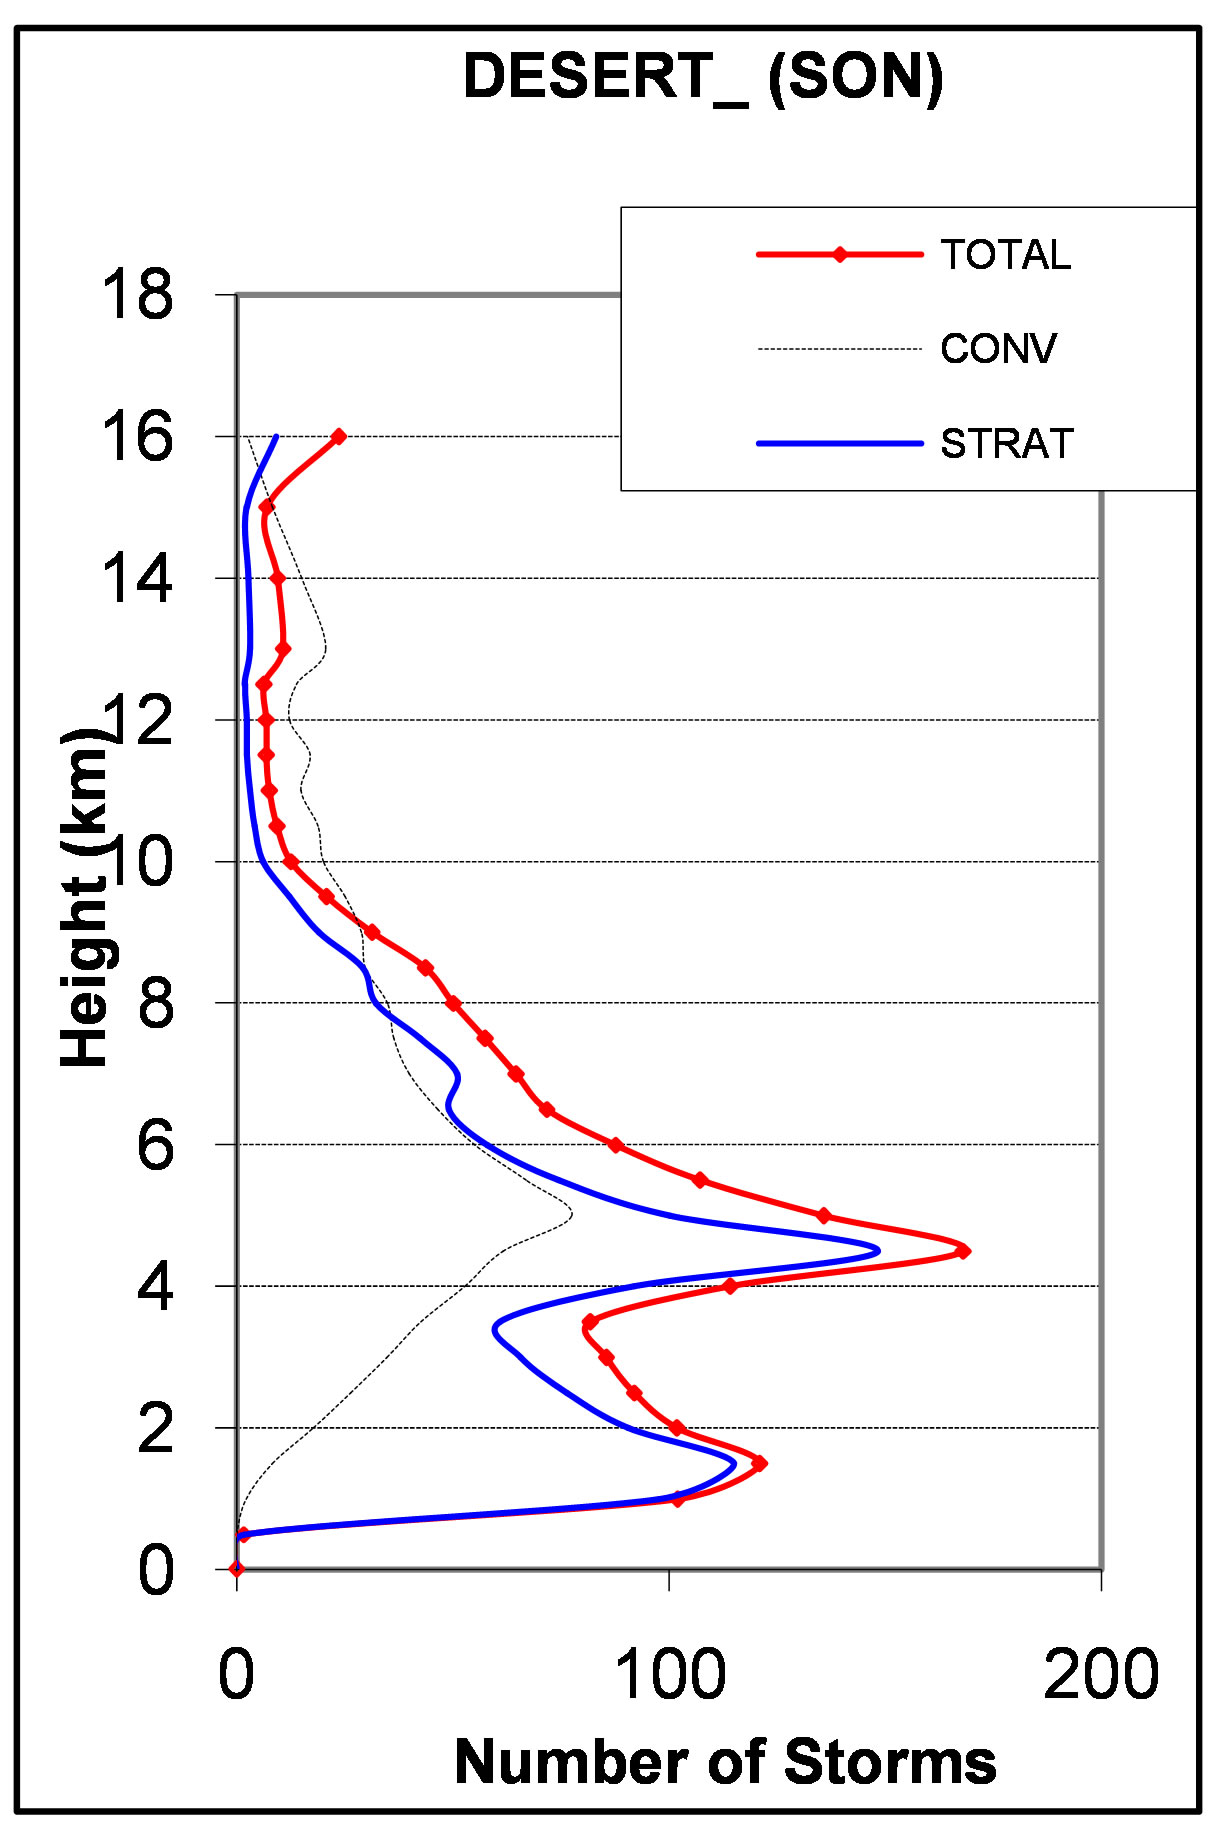 (b)
(b)  (c)
(c)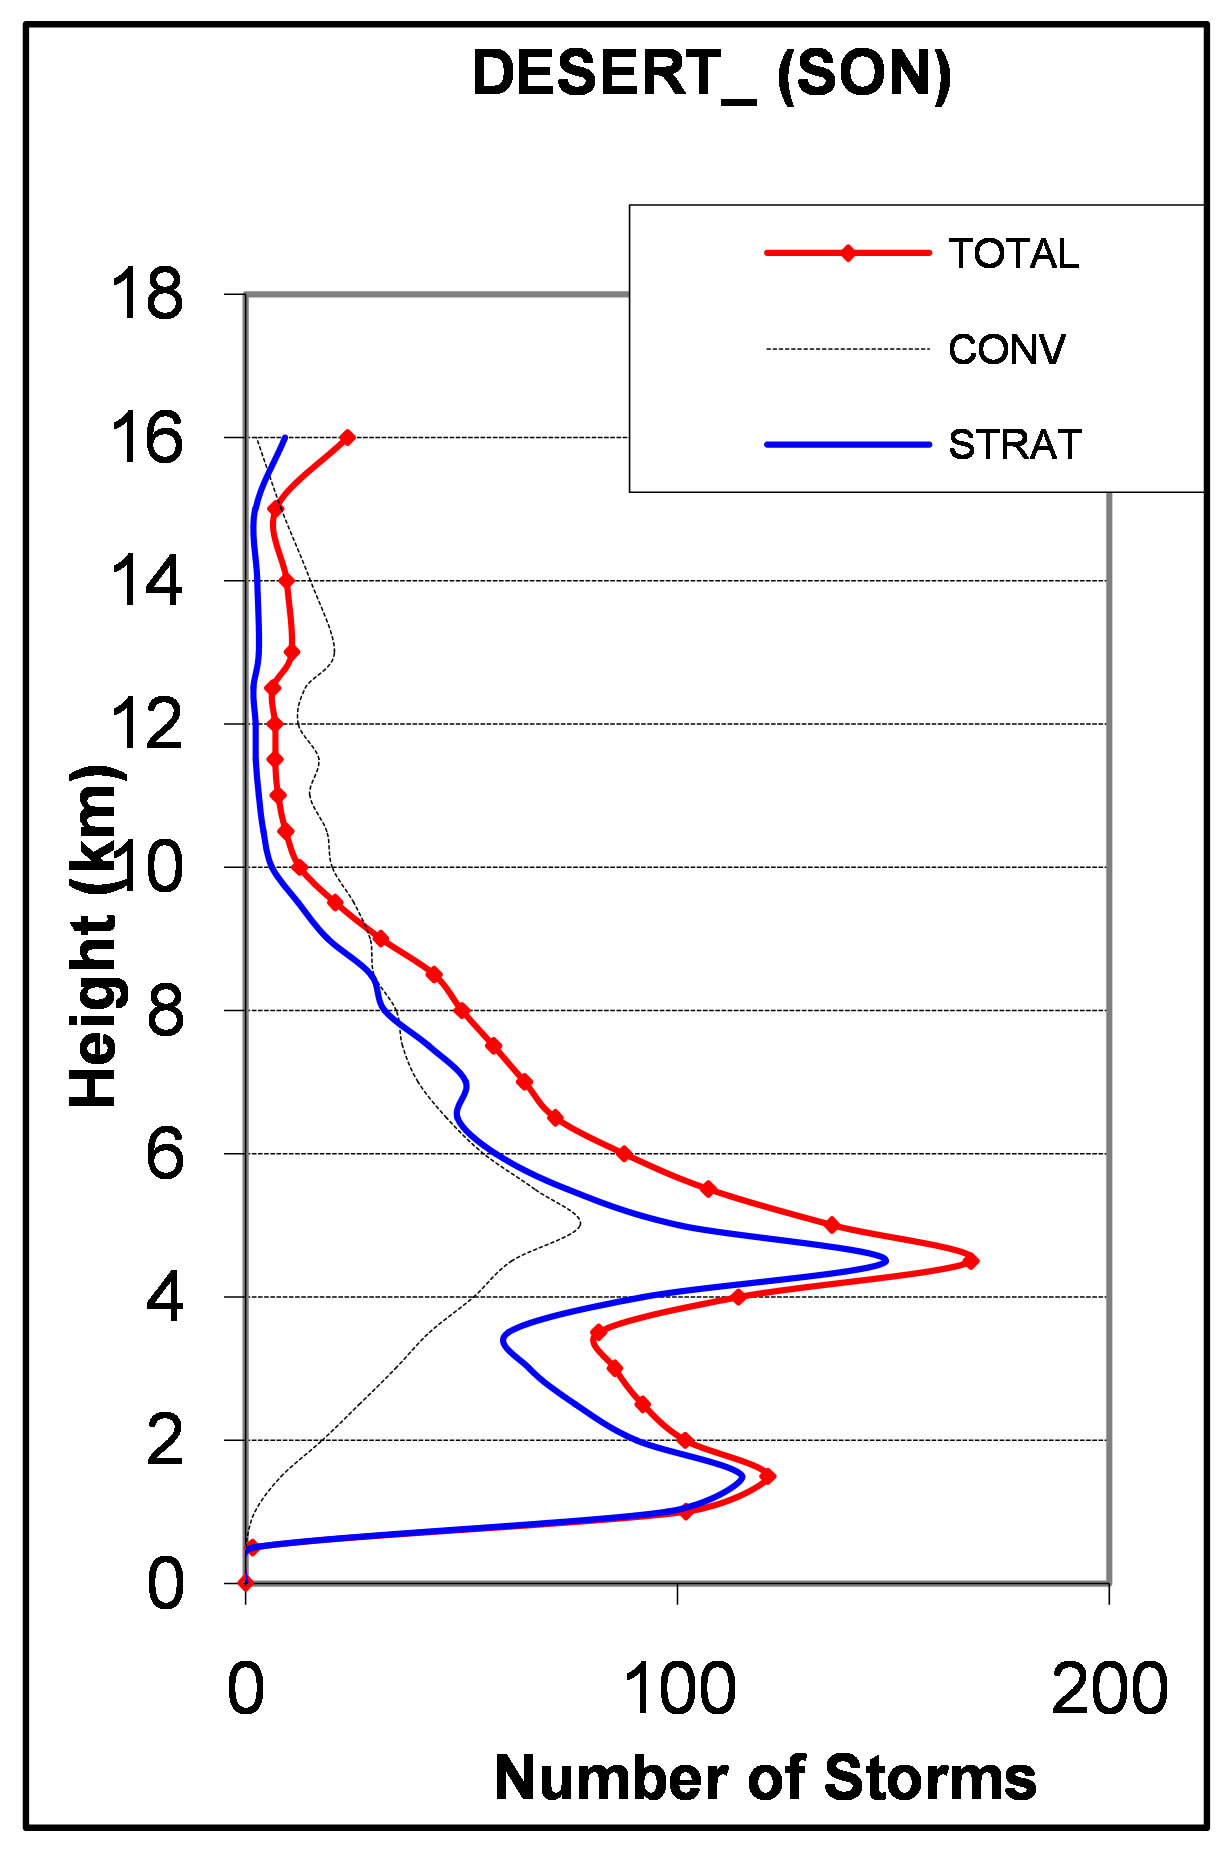 (d)
(d)
Figure 9. (a) (b) Composite storm height histograms over Desert for the domain bounded by 20˚N - 30˚N and 10˚W - 30˚E of Africa, for the seasons: (a) DJF; (b) MAM; (c) (d) Composite storm height histograms over Desert for the domain bounded by 20˚N - 30˚N and 10˚W - 30˚E of Africa, for the seasons: (c) JJA; and (d) SON.
located at 2 km with amplitude of over 600 for the total and about 600 for the stratiform storms. The upper mode is located at 4 km for the total and stratiform storms while the peaks are at 700 for the total storms and below 600 for the stratiform storms. In Figure 10(c) (JJA), a uni-modal distribution is observed at 2 km with amplitude of over 500 with the total greater than stratiform storms. The SON season is bi-modal where the lower mode, located at 2 km, has a peak value of about 400 while the upper mode, located at 4 km, has a peak value over 500.
4. Conclusions
Mean height of stratiform storm tops ranges from 2.5 km to 5 km over the South Atlantic Ocean and 6 km to 7 km over the African continent, while the convective storm tops are as high as 8.5 km over the land, they have the lowest mode in the ocean. Relationship between stratiform and convective storms also reveals that while the stratiform storms are dominant in the North, in a particular season, the convective storms are dominant in the South. The latent heat or energy released during the forma-
 (a)
(a)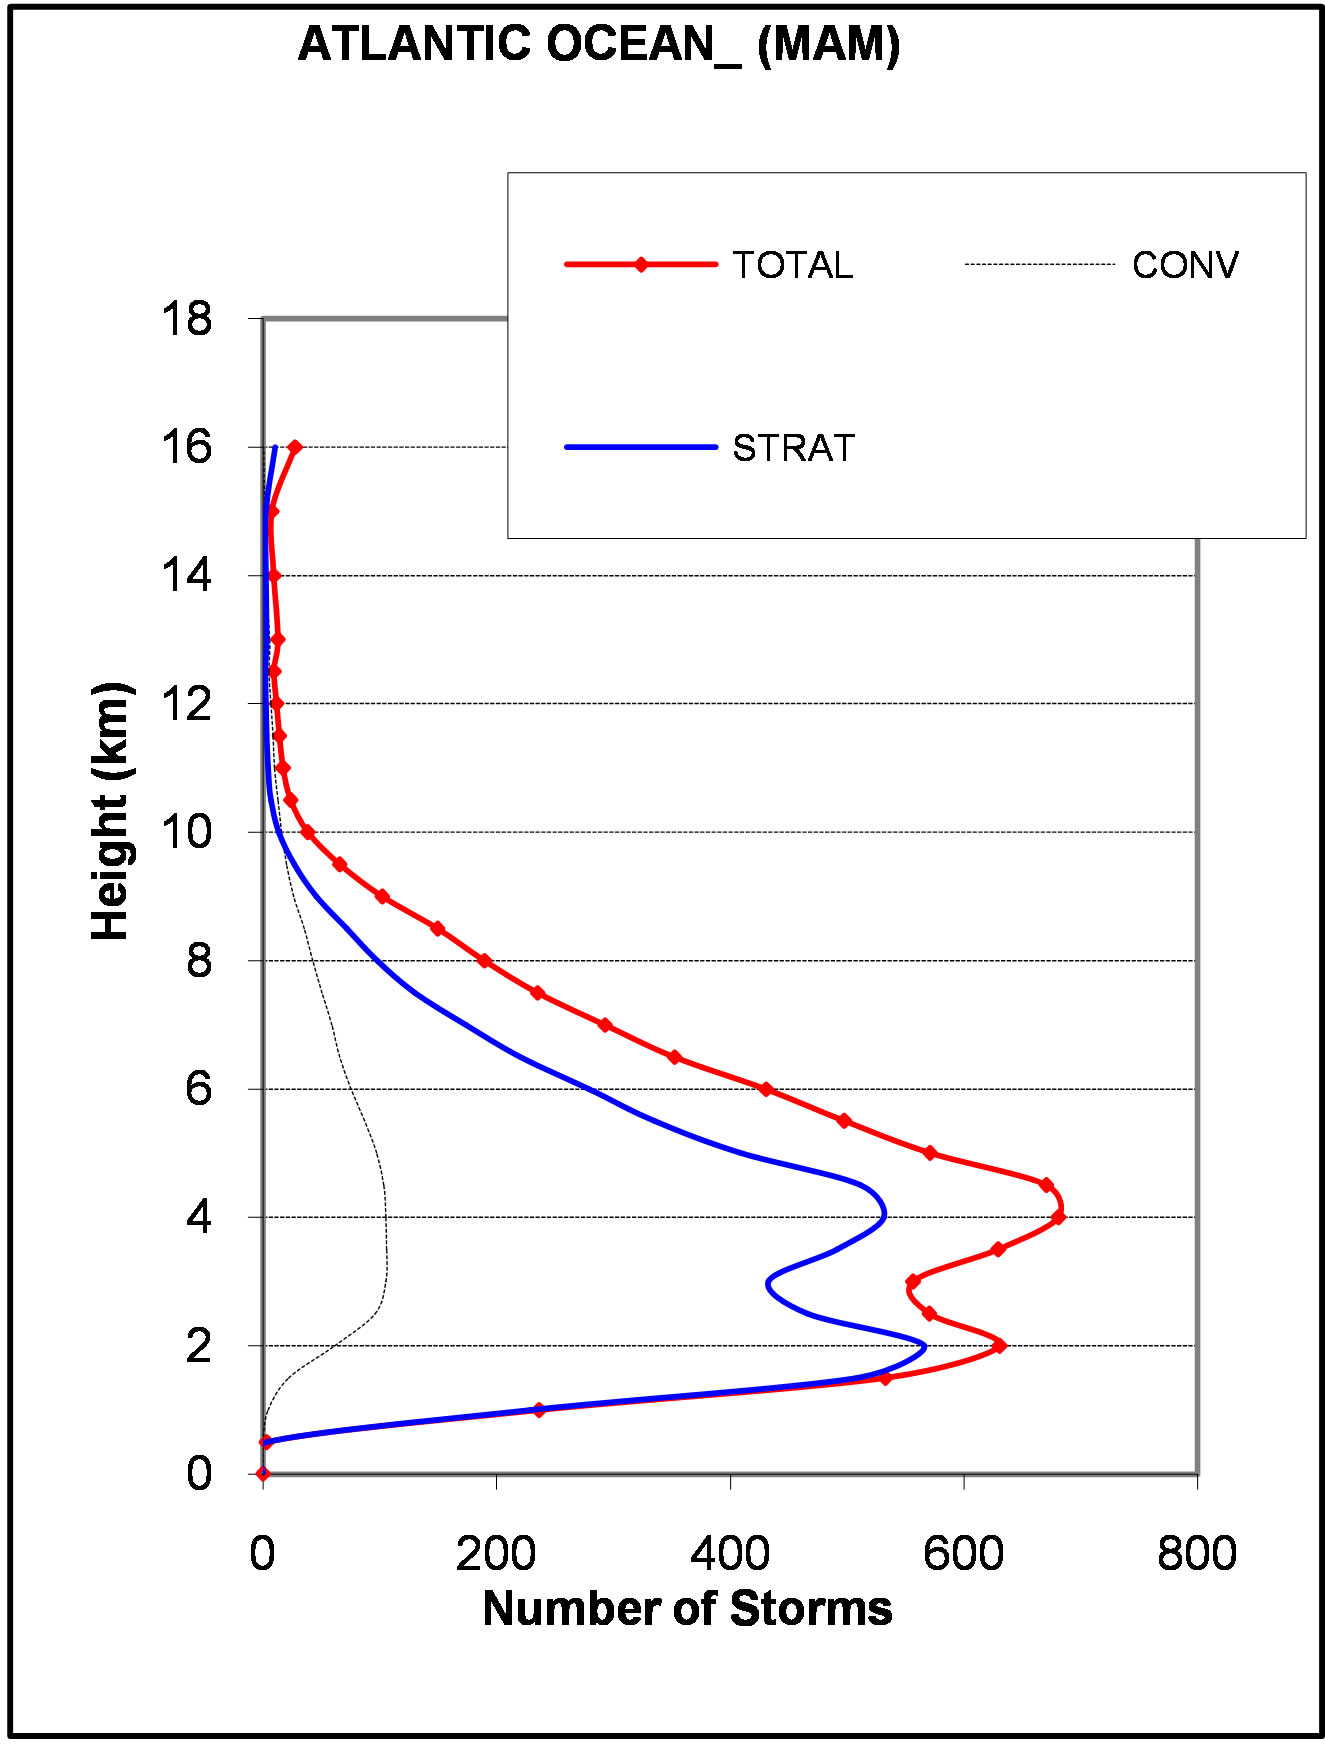 (b)
(b) (c)
(c)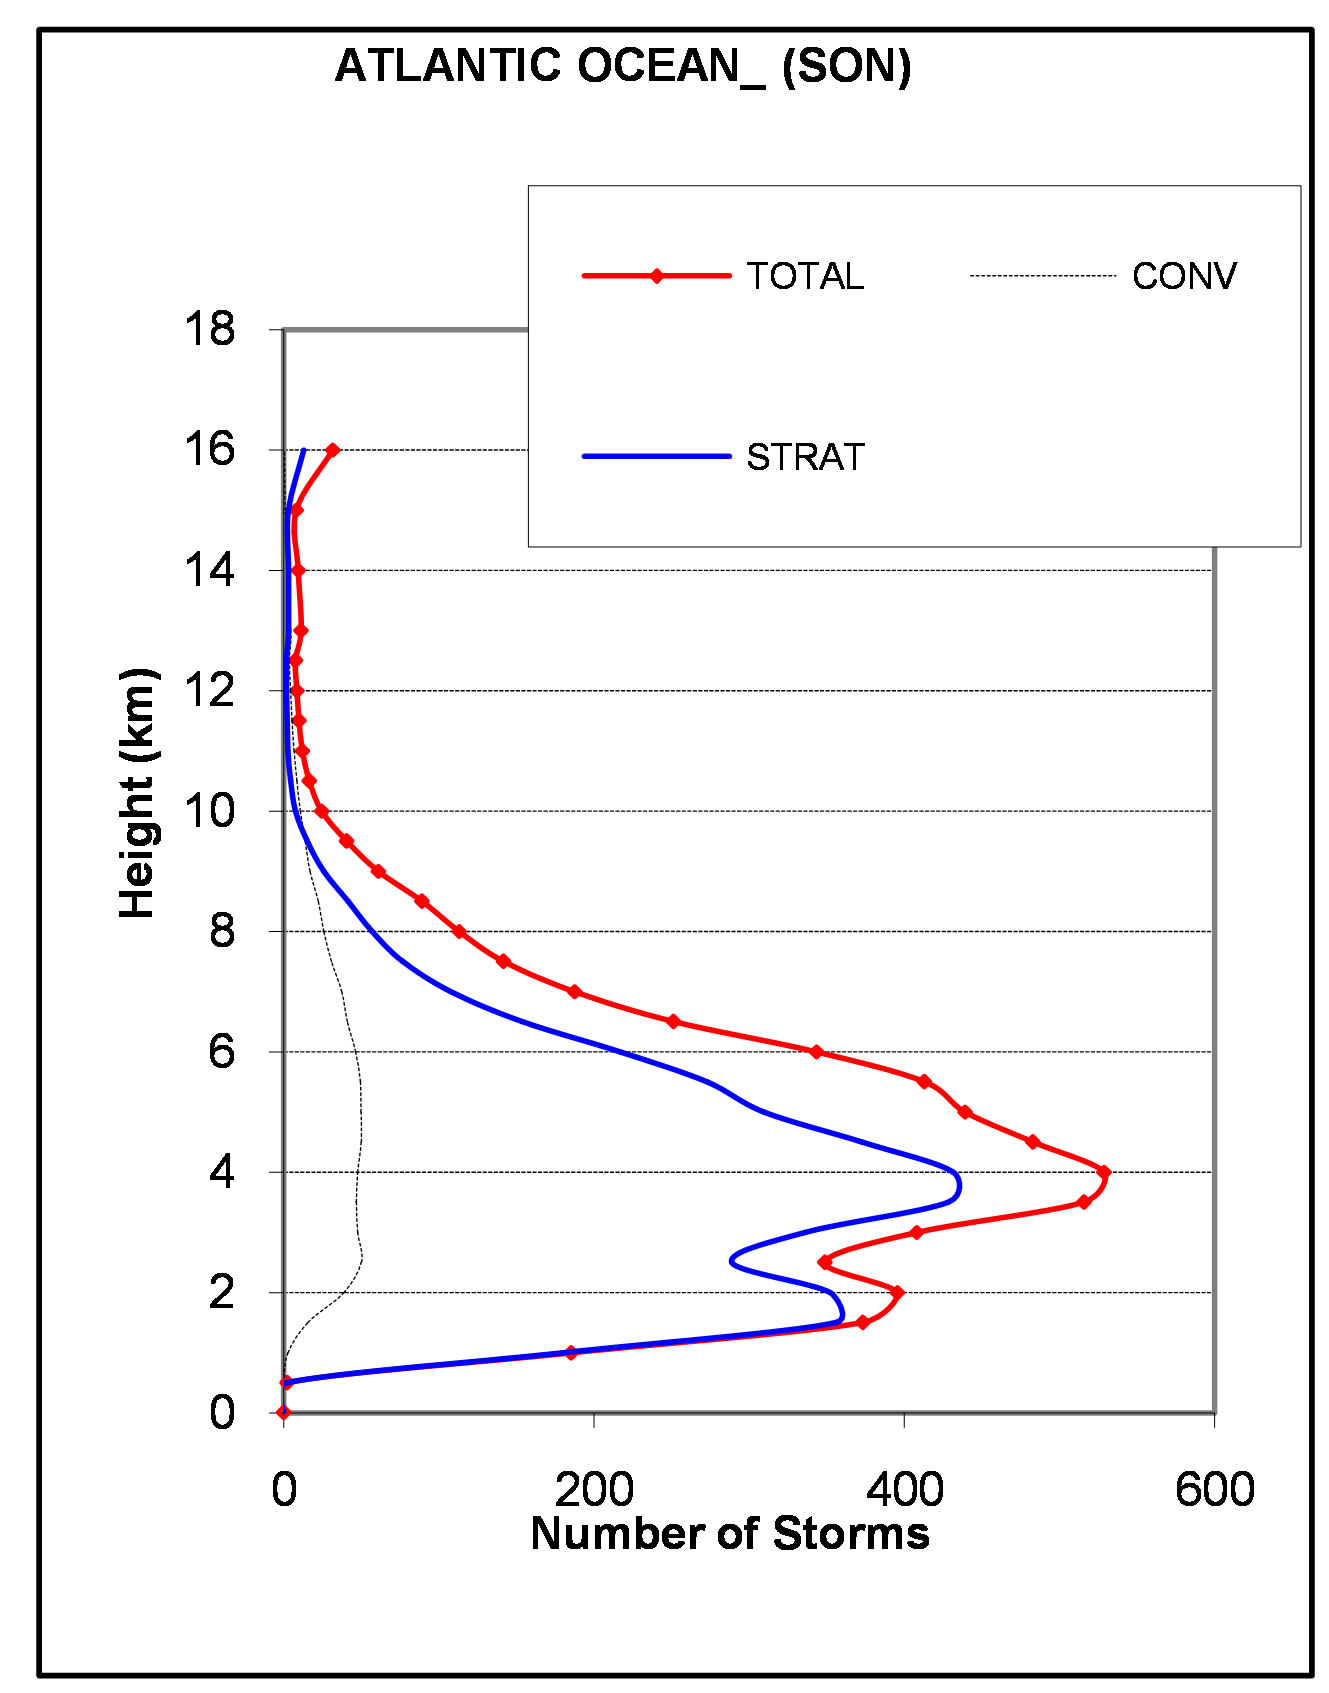 (d)
(d)
Figure 10. (a) (b) Composite storm height histograms over Atlantic Ocean for the domain bounded by 0˚S - 5˚S and 10˚W - 15˚E of Africa, for the seasons: (a) DJF; (b) MAM; Figures 10(a) and (b). Composite storm height histograms over Atlantic Ocean for the domain bounded by 0˚S - 5˚S and 10˚W - 15˚E of Africa, for the seasons: (a) DJF; (b) MAM.
tion of these storms, moves in a similar pattern as the energy in the Carnot cycle. Other types, other than the stratiform and convective storms, dominate the land in some seasons and the ocean in other seasons. In a regional perspective, the unconditioned storms have high mean storm heights over the stratiform and convective storms in all seasons as we move down south from the Northern region of the continent, but the convective storms are dominating in some cases.
The observation with the storm height histograms is that at 250 mb there are high storm counts over the land but at 700 mb the storm cores (high storm counts) are over the Ocean. On regional basis, the histograms show peak values around 5 km, which is the average height of the 0˚C isotherm in the tropics. Also histograms were observed to vary with height, having a bi-modal distribution in the desert, semi-desert and brush grass savanna (north), unimodal distribution in the deciduous forest (north), tropical rainforest, deciduous forest (south), and brush grass savanna (south), again the bi-modal distribution is observed deeply in the south in temperate grassland, steppe (east), and the Atlantic Ocean. The amplitudes of these modes, indicating the number of storms, increase from DJF to MAM but decrease from JJA to SON. The values of these amplitudes are small in the south especially in the cases of unimodal histograms.
REFERENCES
- S. Lang, W. K. Tao, J. Simpson and B. Ferrier, “Modeling of Convective-Stratiform Precipitation Processes: Sensitivity to Partitioning Methods,” Journal of Applied Meteorology, Vol. 42, No. 4, 2003, pp. 505-527. http://dx.doi.org/10.1175/1520-0450(2003)042<0505:MOCSPP>2.0.CO;2
- M. Steiner and R. A. Houze Jr., “Sensitivity of the Estimated Monthly Convective Rain Fraction to the Choice of Z-R Relation,” Journal of Applied Meteorology, Vol. 36, No. 5, 1997, pp. 452-462. http://dx.doi.org/10.1175/1520-0450(1997)036<0452:SOTEMC>2.0.CO;2
- T. Dejene, “The Regional and Diurnal Variability of the Vertical Structure of Precipitation Systems in Africa, Based on TRMM Precipitation Radar Data,” 2003.
- R. A. Houze Jr., “Cloud Clusters and Large-Scale Vertical Motions in the Tropics,” Journal of the Meteorological Society of Japan, Vol. 60, No. 1, 1982, pp. 396-410.
- R. A. Houze Jr., “Observed Structure of Mesoscale Convective Systems and Implications for Large-Scale Heating. Quart,” Quarterly Journal of the Royal Meteorological Society, Vol. 15, No. 487, 1989, pp. 425-461. http://dx.doi.org/10.1002/qj.49711548702
- B. E. Mapes and R. A. Houze Jr., “Cloud Clusters and Superclusters over the Oceanic Warm Pool,” Monthly Weather Review, Vol. 121, No. 5, 1993, pp. 1398-1415. http://dx.doi.org/10.1175/1520-0493(1993)121<1398:CCASOT>2.0.CO;2
- B. E. Mapes and R. A. Houze Jr., “Diabatic Divergence Profiles in Western Pacific Mesoscale Convective Systems,” Journal of the Atmospheric Sciences, Vol. 52, No. 10, 1995, pp. 1807-1828. http://dx.doi.org/10.1175/1520-0469(1995)052<1807:DDPIWP>2.0.CO;2
- D. L. Hartmann, H. H. Hendon and R. A. Houze Jr., “Some Implications of the Mesoscale Circulations in Tropical Cloud Clusters for Large-Scale Dynamics and Climate,” Journal of the Atmospheric Sciences, Vol. 41, No. 1, 1984, pp. 113-121. http://dx.doi.org/10.1175/1520-0469(1984)041<0113:SIOTMC>2.0.CO;2
- R. A. Houze Jr., “Stratiform Precipitation in Regions of Convection: A Meteorological Paradox?” Bulletin of the American Meteorological Society, Vol. 78, No. 10, 1997, pp. 2179-2196. http://dx.doi.org/10.1175/1520-0477(1997)078<2179:SPIROC>2.0.CO;2
- D. A. Short and K. Nakamura, “TRMM Radar Observations of Shallow Precipitation over the Tropical Oceans,” Journal of Climatee, Vol. 13, No. 23, 2000, pp. 4107- 4124. http://dx.doi.org/10.1175/1520-0442(2000)013<4107:TROOSP>2.0.CO;2
- R. A. Houze, “Cloud Physics,” Academic Press, California, 1993, 573 p.
- G. J. Huffman and Co-Authors, “The Global Precipitation Climatology Project (GPCP) Combined Precipitation Dataset,” Bulletin of the American Meteorological Society, Vol. 78, No. 1, 1997, pp. 5-20. http://dx.doi.org/10.1175/1520-0477(1997)078<0005:TGPCPG>2.0.CO;2
- C. Kummerow and L. Giglio, “A Passive Microwave Technique for Estimating Rainfall and Vertical Structure Information from Space. Part 1: Algorithm Description,” Journal of Applied Meteorology, Vol. 33, No. 1, 1994, pp. 3-18. http://dx.doi.org/10.1175/1520-0450(1994)033<0003:APMTFE>2.0.CO;2
- F. Ferreira, P. Amayenc, S. Oury and J. Testud, Study and “Tests of Improved Rain Estimates from the TRMM Precipitation Radar,” Journal of Applied Meteorology, Vol. 40, No. 11, 2001, pp. 1878-1899. http://dx.doi.org/10.1175/1520-0450(2001)040<1878:SATOIR>2.0.CO;2
- C. Kummerow and Co-Authors, “The Status of the Tropical Rainfall Measuring Mission (TRMM) after Two Years in Orbit,” Journal of Applied Meteorology, Vol. 39, No. 12, 2000, pp. 1965-1982. http://dx.doi.org/10.1175/1520-0450(2001)040<1965:TSOTTR>2.0.CO;2
- E. J. Zipser and K. R. Lutz, “The Vertical Profile of Radar Reflectivity of Convective Cells: A Strong Indicator of Storm Intensity and Lightning Probability?” Monthly Weather Review, Vol. 122, No. 8, 1994, pp. 1751-1759. http://dx.doi.org/10.1175/1520-0493(1994)122<1751:TVPORR>2.0.CO;2
- R. J. Donaldson, “Radar Reflectivity Profiles in Thunderstorms,” Journal of Meteorology, Vol. 18, No. 3, 1961, pp. 292-305. http://dx.doi.org/10.1175/1520-0469(1961)018<0292:RRPIT>2.0.CO;2
- Z. D. Adeyewa and K. Nakamura, “Validation of TRMM Radar Rainfall Data over Major Climatic Regions in Africa,” Journal of Applied Meteorology, Vol. 42, No. 2, 2003, pp. 331-347. http://dx.doi.org/10.1175/1520-0450(2003)042<0331:VOTRRD>2.0.CO;2
- Z. D. Adeyewa and K. Nakamura, “Preliminary Study of Rainfall and Storm Structure over Africa with TRMM Precipitation Radar Data,” Meteorologische Zeitschrift, Vol. 12, No. 4, 2003, pp. 197-202. http://dx.doi.org/10.1127/0941-2948/2003/0012-0197
- C. Prabhakara, R. Iacovazzi, J. A. Weinman and G. Dalu, “A TRMM Microwave Radiometer Rain Rates Estimation Method with Convective and Stratiform Discrimination,” Journal of the Meteorological Society of Japan, Vol. 78, No. 3, 2000, pp. 241-258.
NOTES
*Corresponding author.