Atmospheric and Climate Sciences
Vol.3 No.1(2013), Article ID:27584,9 pages DOI:10.4236/acs.2013.31015
Climate Variation and Malaria Prevalence in Warri Metropolis
Department of Geography and Regional Planning, Delta State University, Abraka, Nigeria
Email: *efesunday@yahoo.com
Received August 17, 2012; revised September 19, 2012; accepted September 27, 2012
Keywords: Climate Change; Malaria; Epidemiology; Prevalence; Warri Metropolis
ABSTRACT
This study examined the relationship between climate and prevalence of malaria in Warri metropolis. To achieve this, the study generated data from archival material from the meteorological agency and hospitals. Climate data of temperature, rainfall and humidity were collected from the Nigeria Meteorological agency, Warri and malaria in-patient and out-patient records from the two (2) central hospitals and one (1) renowned hospital each from the three (3) local Government Areas for a period of twenty (20) years (1990-2009). The data were analyzed using the Multiple Regression. From the study, the rainfall and temperature in Warri metropolis has increased over the years (1907-2009) by 122.82 mm and 1.3˚C. Thus, if this warming continues there will be a risk of between 1.4˚C and an urban warming of 4.18˚C, indicating climate change. There is a significant relationship between malaria and climate parameters (rainfall, temperature and humidity) which were evident at F value of 4.429 which is greater than the critical table value of 4.35, which implied that the model is significant and thus, malaria prevalence in Warri metropolis is significantly dependent on rainfall, relative humidity and temperature. It is anticipated that an increase in temperature and relative humidity resulted to a corresponding increase in the number of malaria cases, it is therefore recommended that any policy aimed at reducing the prevalence of malaria in Warri and environs must necessarily be imbued with programmes that have objectives of mosquitoes reduction through the improvement of our environment which includes the climate.
1. Introduction
Global climate change remains one of the biggest environmental threats in the new millennium and its impacts on human health remain an important focus. Climate variations are thought to have a direct impact on the epidemiology of many vector borne diseases [1]. Malaria is a major public health burden in the tropics, with the potential to significantly increase in response to climate change [2]. Over the past century the world has warmed by 0.6˚C, with a range of ecological consequences [3].
According to the [4], malaria kills over one million people each year, while 300 to 500 million people are suffering from chronic malaria around the world. This is one of the most common and serious diseases of our time. The death toll is predicted to double in the next 20 years if no new control measures are developed [5]. Adding to the scenario are the anthropogenic changes in our environment. Global change inflicted by man in ways of increased emissions of greenhouse gases or disrupted nutrient cycles has been known to cause great ecological responses [6].
The worries have tremendously increased in recent years, partly because of extreme events resulting from climate variation [7]. Incidence of malaria varies with weather, which affects the ability of the main carrier of malaria parasites, anopheline mosquitoes, to survive or otherwise. Tropical areas including Nigeria have the best combination of adequate rainfall, temperature and humidity allowing for breeding and survival of anopheline mosquitoes. The burden of malaria varies across different regions of the world and even within a country [8].
Succinctly, the problems of climatic variation which include flooding, storms, etc., have a marked effect on the prevalence of mosquitoes which cause malaria. The disease, malaria, is a major health problem in Nigeria, with stable transmission throughout the country. It accounts for about 50% of out-patient consultation, 15% of hospital admission, and also prime among the top three causes of death in the country National Malaria Control Plan of Action 1996 to 2001 [9]. The trend is rapidly increasing due to the current malaria resistance to first line antimalarial drugs [4].
Indirectly, malaria impairs the ability of people to work hard by losing productive time during care-giving activities, while adults with malaria severely compromise household/family resources, as their capacity to work, earn income and save for their families is reduced. Added to this, the illness generates new financial demands to cover medical treatment and threatening food supply. Furthermore, it affects child’s development and compromise future productive capacity due to absenteeism from school associated with malaria attack. Also, malaria is known to be a main cause of anaemia, epileptic convulsions, growth faltering, and neurological squeal [8].
In Warri and environs, weather and climate tends to affect the spread of malaria. However, there are no demarcated seasons in Warri because rain tends to fall virtually throughout the year and it has given rise to annual increased precipitation and high temperature (see [10,11]. This rate of increased precipitation stimulates breeding sites of mosquito which results to an increased mosquito bite. Due to urbanization process going on in Warri most of the natural drains has been closed and the constructed drains are blocked with litters of garbage, hence making areas like Okumagba Avenue, Airport road, Makiava areas etc. to experience flood; which in turn results to breeding grounds for mosquitoes. Thus, in the wet seasons, mosquito’s larvae development is at maxima because of the increase in precipitation and poor environment management [12].
In Warri, the people are vulnerable to mosquito bite resulting in malaria because most of the houses are within the fringes of water bodies, farm gardens and tall grasses as well as within flight distance from it respective breeding habitats. Mosquitoes also breed on the edges of ponds and streams, open septic tanks, open cesspools, in salt marshes, overflowing sewages, holes in stumps or trees, water barrels, clogged troughs, street catch basins, empty tin cans and jars. The people tends to suffer from the impact of mosquitoes as a result of its biting and pierce leading to swollen body parts when they are in their houses or comes out at night to receive cool air from their surroundings. It is on this basis that the following questions come to mind as: has there been climate change in Warri metropolis? Does climate influence the prevalence of Malaria? At what time/period of the year is the effect of weather on malaria disease at its peak? This study is therefore set to examine climate variation and malaria prevalence in the Warri metropolis, so as to provide necessary answers to the questions raised.
2. Study Area
Warri metropolis is located between latitude 5˚30'N and 5˚35'N and Longitude 5˚29'E and 5˚48'E. Warri Metropolis is made up of Warri South, Udu and Uvwie Local Government areas. The area is also characteristics by hydromorphic soils, which is a mixture of course alluvial and colluvial deposits. The rocks are of sedimentary rock type having silt, clay and sand to top layer (4 - 6 m) and followed by coarse and pebbly (up to 17 m) thick layer. The terrain is flat having an elevation of 6.1 m above sea level [13]. The area is characterised by tropical equatorial climate with mean annual temperature of 27.44˚C and rainfall amount of 3302.52 mm. Rainfall period ranges from January-December, with the minimum value of 20.4 mm in January and over 499.1 mm in September. The temperature of 27.44˚C has enhanced the transmission of malaria which is caused plasmodium falciparum which requires a minimum temperature of 19˚C [14]. The predominant wind system in Warri metropolis is the tropical Maritime Air Mass (mT). This air mass is humid and moist, and brings rainfall into this environment. The influence of the Tropical Continent (cT) air mass is minimal; it brings in slight harmattan in the area between December and February [10]. The natural vegetation are of rainforest and riparian plant covers. These forests are rich in wood and non-wood resources. Unfortunately, much of the rain forests have been destroyed as a result of centuries of human activities and interference resulting to grass land. Thus mosquitoes tend to breed very well in such grassland and marshy areas.
Warri metropolis is one of the rapidly growing cities in Nigeria, with a population rising rapidly from 19,526 in 1933, 55,256 in 1963, 280,000 in 1980, 500,000 in 1991 to 536,023 in 2006 [15]. Thus, as population increases there is an increase in anthropogenic activities which in turn leads to global temperature rise and global warming, there by contributing to variation in rainfall and temperature patterns in Warri. There have been a growth of health centres in Warri and environs from fifty (50) private hospitals and one (1) general hospital in 1992 to one hundred and sixty three (163) private hospital and two (2) central Hospitals in 2007 [15] as shown in Figure 1. The central hospitals act as collating centers of epidemiological records before sending it to the state ministry of health. Nevertheless, there is still an outrageous growth of the spread of disease.
3. Conceptual Issues and Methods of Data Collection
Vectorial response to climate is largely a matter of development and transmission with the exception of the biological explanations. There is also good epidemiological evidence of disease risk in humans linked to climate variability. Most of this evidence comes from studies of malaria. Epidemiology concept is concerned with the study of the occurrence, distribution, determinants of diseases and injuries in human populations. Thus, it concerns with the types and frequencies of illnesses, injuries, and other health-related conditions or problems in groups
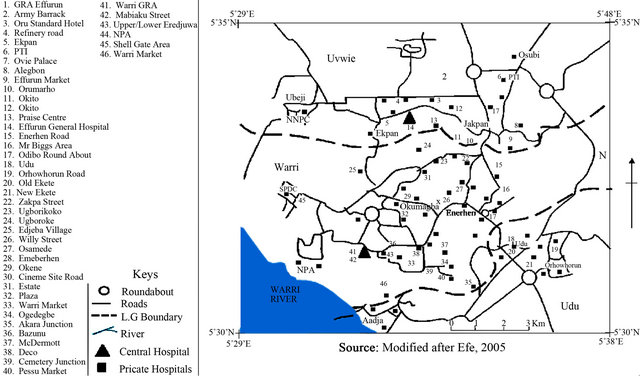
Figure 1. Hospital distribution in Warri and environs.
of people and with the factors that influence their distribution and to discover the factors essential for diseases to occur within groups. Furthermore, finding the best methods to reduce or prevent those factors and other conditions detrimental to the health of communities [4].
The utility of these frameworks is thus not necessarily in isolating the attributing burden of disease due to climate change, but rather in explicitly characterizing the cumulative or integrative impact of climate change within the context of changes in other disease determinants. Such frameworks are particularly useful for preliminary characterization and identification of key processes, interactions, scales, and feedbacks an exercise which can inform and guide integrative attribution modeling [16, 17].
According to [18] the epidemiological approach to disease control, e.g. malaria control is based on the three main functions which epidemiologists perform, more or less successfully, namely, in order of increasing difficulty and uncertainty:
1) To describe and measure the distribution of disease, e.g. who gets malaria, how much of it, when and where?
2) To explain that distribution by its determinant factors: biological, environmental, social, behavioural and economic.
3) To predict the changes expected in that distribution from human interventions, in particular from control measures.
These three epidemiological functions should constitute important inputs into the planning of malaria control, with the aim of adopting the control strategy to the epidemiological situation. Within an epidemiology approach, the diverse set of factors associated with malaria is considered in the context of Epidemiology Triangle, linking the environment with disease transmission and health. The epidemiologic triangle consists of three components, with the Agent at the top point and the Host and the Environment at the other two points of the triangle (see Figure 2).
Changes in any component will alter the existing equilibrium to increase or decrease the frequency of a disease. In a steady state of the triangle, each leg of the component is affecting and being affected by the other components. Any influence among the triangle relationship will impact the epidemics of vector-borne infectious disease. For example, the increase density of vectors can enhance the opportunity of biting rate, leading to greater incidence of infection. Most importantly, almost all organisms, including vectors, pathogens and hosts survive and reproduce under a specific range of environmental conditions. These new cases of disease occurs either through onset of disease current members of the population or by immigration into the population of persons already ill.
The formula for detecting incidence rate is (see Formula (1)).
While the prevalence rate is the number of persons in a population who have a given disease at a given period of time; the formula for determining prevalence rate is (see Formula (2)).
 (1)
(1)
 (2)
(2)
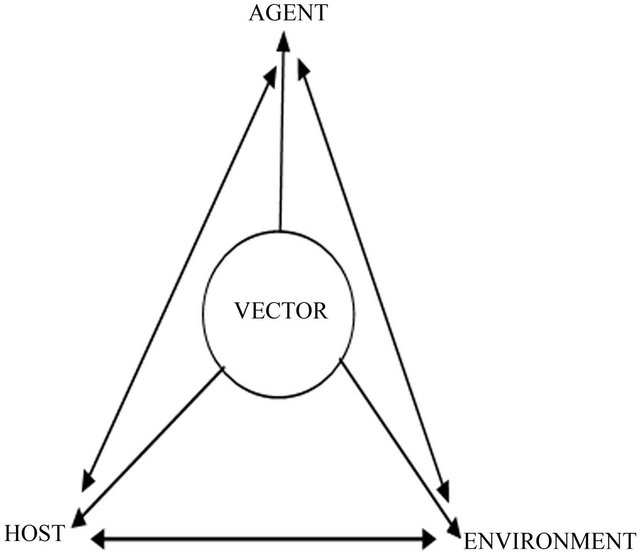
Figure 2. Agent-Host-Environment interaction by Sutherst, 2004.
The study adopted the retrospective survey designs which involved the use of historical/archival data of climate parameters and medical case reports from Warri and environs. The data includes archival weather data on temperature and rainfall from the Nigeria Meteorological Agency for a period of one hundred and two (102) years and medical records of Malaria cases from the Central Hospitals and some renowned private hospitals in Warri and environs for a period of twenty (20) years. Data on malaria cases reported by place of diagnoses were obtained from the two (2) central hospitals (Central Hospital, Warri and central Hospital, Ekpan) and one (1) renowned hospital each from the three (3) local Government Areas; (Numa Clinic, Odion Rd.) Warri, (Twins Clinic, Udu Rd.) Udu and (NNPC Clinic, Ekpan) Uvwie respectively. The choice of these hospitals is based on the fact that data of epidemiological cases are forwarded from the smaller hospitals to the two central hospitals for onward transmission to the state ministry of health, and secondly most of the hospitals/clinics hardly keep records cases treated. As such there are dearth of data from such hospitals and clinics. The medical record contains the number of patients treated for malaria for the period of 1990-2009. The malaria data were extracted from medical records and contained the malaria in-patient and out-patient cases on yearly basis for 1990-2009 and the monthly record for year 2009.
Climate data within Warri and environs were characterized by historical records from ground recording synoptic weather station for a period of 1907-2009. The data were retrieved from climatic archival records and rainfall and temperatures values were extracted. The climate data contains the mean annual temperatures and annual rainfall amount. Multiple Regression analysis was used to ascertain the relative effect of rainfall and temperature, and humidity on the prevalence of malaria. Two years moving averages and linear trend analysis was used to perform the trend pattern for rainfall and temperature respectively.
4. Results and Discussion
Rainfall trend in Warri between 1907 and 2009 shows a fluctuating trend (see Figure 3). This trend pattern was performed using two years moving averages. The result shows that there was a gradual increase between 1907 and 1917 and a slight drop in rainfall was experienced between late 1940 and 1979, however there was a sharp rise again which was evident from 1989 to 2006. In the 1907-1935 climatic periods, the mean rainfall was 2724 mm. By 1936-1970, the rainfall slightly increased to 2876.46 mm, while it rose to 2999.28 mm in 1971-2009. This implies that rainfall increase between 1907-1935 and 1936-1970 was only 151.68 mm, while it was 122.82 mm between 1936-1970 and 1971-2009. Within the study period 1907-2009 (102 years), rainfall increase in Warri and environs was 122.82. This is a clear evidence of climate change because a notable impact of climate change is, increasing rainfall in most coastal areas and decreasing rains in the continental interiors [19-21] observed that the number of rain days dropped by 53% in the north-eastern Nigeria and 14% in the Niger-Delta Coastal areas. This is a pointer that Warri is going to be hardly hit by global warming in the nearest future while the declining and shifts in rainfall pattern are becoming a worrisome development.
Both temporal variations were observed in the air temperature distribution. The temporal air temperature trend has remained generally on the increase since 1907. The mean temperature in Warri metropolis between 1907 and 2009 was 26.68˚C. The increase was gradual between 1907 and the mid-1940s. A slight drop in temperature was experienced between the late 1951 and 1953. Thereafter, the gradual increase continued until the late 1957. A sharp rise in air temperature became evident as from the early 2000, which continued till 2009. The sharp rise in temperature observed in Nigeria since the early 1970s is in agreement with the global trend [22]. In the 1907- 1935 climatic periods, the mean air temperature was 26.14˚C. By 1936-1970, the air temperature slightly increased to 26.7˚C, while it rose to 27.1˚C in 1971-2009.

Figure 3. Rainfall variation in Warri from 1907-2009.
This implies that temperature increase between 1907- 1935 and 1936-1970 was only 0.56˚C, while it was 1.3˚C between 1935-1970 and 1971-2009. Within the study period 1907-2009 (102 years), temperature increase in Warri and environs was 1.3˚C. Global temperatures on the earth’s surface have increased by 0.4˚C - 0.8˚C with a mean of 0.74˚C since recorded since 1860 when actual scientific temperature measurement started [22,23]. With an increase of 1.3˚C implies there have been climate change in Warri metropolis and should this trend continue unabated, Warri metropolis may experience between 1.4˚C to 2.58˚C risk temperature increase by 2015.
Table 1 revealed that ambient temperature of 33.6˚C is the highest in Warri metropolis and observed in the high density areas (Jakpa road, Okumagba layout, Airport Road, Upper/Lower Erejuwa, Enerhen Udu Road) while in the fringe areas (Osubi, Ubeji, Aladja, Orhowhorun and Ugbomro) has a temperature of 31.3˚C. With this observation, it can be stated that Warri the core areas have higher temperatures more than the exterior areas because of it socio-economic activities.
Table 2 shows the urban heat island characteristics in Warri and environs. The study revealed that the Urban heat island has an increasing trend over the years with an increase rate of population. The increase in urban heat Island result in an increase in urban warming alongside with the rate of greenhouse gases (GHG) emitted. From the UHI trend, there has been an increase of 1.05˚C between 1933 and 2006 and it was observed that Warri have a warm bias of 4.18˚C.
Table 1. Mean ambient temperatures in the various areas in Warri and environs (1907-2009).
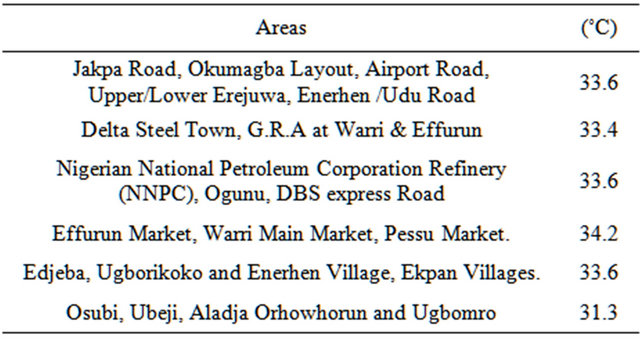
Table 2. Urban heat island trend.
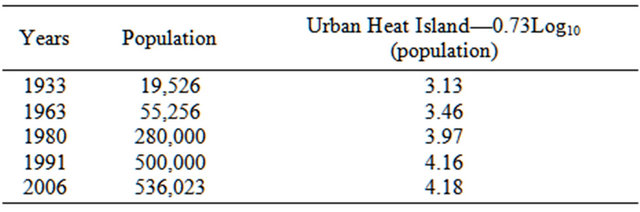
Table 3 shows that the highest rainfall amount occurs in the May with a rainfall amount of 665.2 mm and a minimal amount of 30.8 m in January. There is an increase in amount of rainfall from April-June with the peak at May (see Figure 4). The mean rainfall within this period was 330.25 mm and the total amount of rainfall was 3963 mm. The highest mean temperature amount occurs in March with a temperature amount of 35˚C and a minimal amount of 28.7˚C in August. There is an in-
Table 3. Seasonal variation of weather.

Source: Nigeria Meteorological Station (NIMET) Warri, 2009 crease in amount of temperature from October to March with the peak at March.
Table 3 shows that the highest mean temperature amount occurs in March with a temperature amount of 35˚C and a minimal amount of 28.7˚C in August. There is an increase in amount of temperature from October to March with the peak at March (see Figure 5). The mean temperature within this period was 32.63˚C.
Table 3 shows that the highest relative humidity amount occurs in August with an amount of 88.2% and a minimal amount of 81.1% in March. There was an increase in amount of relative humidity from April to August with the peak at August. The average relative humidity within this period was 83.9%.
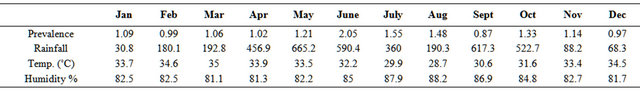
From Table 4 and Figure 6, there is a seasonal trend in the prevalence of malaria from January to December. Malaria tends to be at its peak in the month of June and lowest in the month of September (see Figure 6). The seasonal pattern indicates the gradual rise in the prevalence rate from the month of April to June and declines rapidly to a rate as low as 0.97 from October to December. This variation of malaria prevalence rate is as result of changes in the climate pattern. This result corroborates with the works of [24,25].
From Table 5, the prevalence rate show a rising, albeit fluctuating trend with reported cases remaining relatively high and varies throughout the year; with rainfall levels varying significantly with the incidence of malaria and the trend is seasonal. During the rainy seasons (MayOctober), malaria is at its peak in the month of June and minimal in September. It is worth noting that the mosquito breeds well in flooded environment. During the dry season (November-March), there is a high temperature in March and an increased prevalence of malaria in June. Moreso, the trend of malaria prevalence and temperature reveals it is seasonal. The prevalence of malaria tends to be on an increase during the wet season and this is evident in 64.4% of reported cases. However, this study is in line with study carried out in Kenya which opined that the rainy season presents favourable environmental conditions that enhance mosquito breeding and survival [26]. Thus, the result also confirms that malaria transmission in the Warri and environs is characterized by substantial inter-monthly variation. The prevalence of malaria tends to be on an increase as relative humidity increases. However, this study is in line with study carried out in SubSaharan Africa which opined that high relative humidity lengthens the life of the mosquito and helps the parasite to complete the necessary life cycle [27].
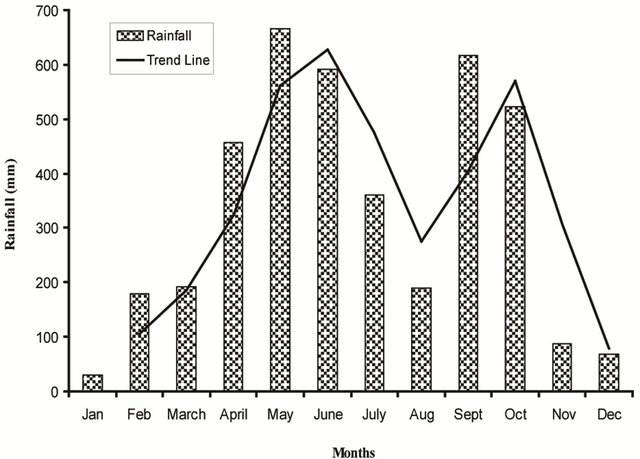
Figure 4. Seasonal distribution of rainfall in Warri and environs.
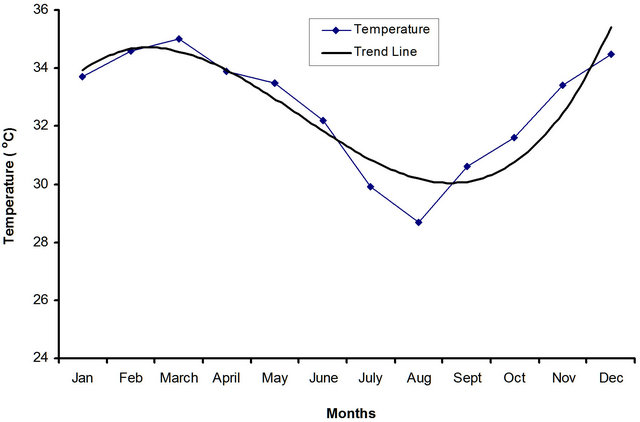
Figure 5. Seasonal distribution of temperature in Warri and environs.
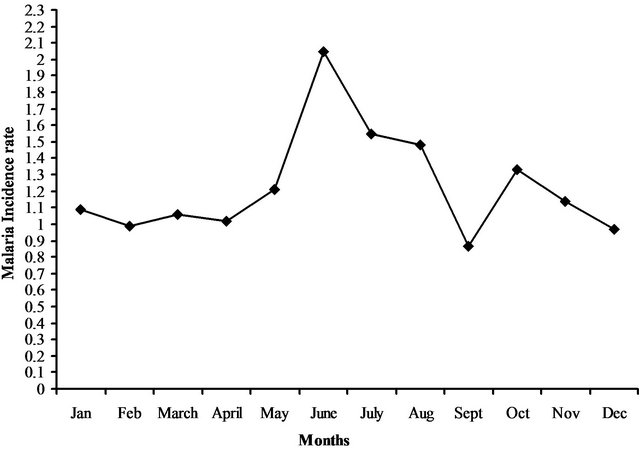
Figure 6. Monthly malaria prevalence rate in Warri and environs.
Table 4. Seasonal trend of malaria.

Source: Hospital records, Warri.
Table 5. Seasonal variation of weather and malaria prevalence.
Source: NIMET and Hospital records, Warri 2009.
From Table 6 and Figure 7 the malaria cases vary throughout the years; with an increasing trend. There is a sharp rise in cases of malaria from year 2004 to the predicted year 2015 which to an increase in temperature. More so, there is little or no variation in the amount of rainfall from 2000 to 2008 (see Figure 7). It is worth noting that malaria increase in year 1999 is solely associated to temperature (see Figure 7).
From Table 7, there is a strong correlation at R = 0.809 between malaria prevalence and climate parameters. However, the r2 value is indicates 0.655 which implies that 66% of the occurrence of malaria is attributed to rainfall, humidity and temperature in Warri and environs. At 0.05 significance level, the calculated F value is 4.429 while the critical table value is 4.35. Thus, the prevalence of malaria in Warri is a significant dependent on climate parameters (rainfall, temperature and humidity).
Furthermore, from the coefficient Table 8, the beta values value shows a positive for temperature and humidity, that is as temperature and humidity increases the prevalence of malaria increases as well. Besides climate contributed 66% to the prevalence of malaria Warri metropolis, Others factors of poor sanitary situation, inadequate drainage system, and planning problems amongst others accounted for 34% contribution to the prevalence of malaria. This corroborated the views of [8,24] respectively. Thus there is the need for the improvement in the sanitation situation, construction of drains, and urban planning and renewal visa viz incorporating the climatic conditions into consideration in Warri metropolis.
5. Conclusion
This study has revealed a change in the climate of Warri metropolis. The increase in rainfall, temperature and humidity has a corresponding increase in the prevalence of malaria. This situation will be worsened if the increase of rainfall, temperature and humidity remain unabated. Thus,

Figure 7. Malaria cases and climate parameters in Warri and environs from 1990-2015.
Table 6. Annual variations of malaria and climate paramenters.

Source: NIMET and hospital records in Warri and environs.
Table 7. Model summary.

Table 8. Standardized beta coefficient.

an increase in rainfall and temperature enhances mosquito development and improved breeding sites leading to prevalence of malaria disease in the present day, and in the near future. Although, the results of the study may appear to be too far in the future for immediate action but they are useful for consideration in the development of health policies for the next decades. It is recommended that policies aimed at reducing the prevalence of malaria in Warri metropolis must necessarily be imbued with programmes that have objectives of mosquitoes reduction through the improvement of our environment which includes the climate and improvement in the sanitation situation in Warri.
REFERENCES
- H. Tsai and T. Liu, “Effect of Global Climate Change on Disease Epidemics and Social Instability around the World,” An international Workshop on Human Security and Climate Change, Asker, Oslo, 21-23 June 2008.
- J. Sachs and P. Malaney, “The Economic and Social Burden of Malaria,” Nature, Vol. 415, No. 6872, 2002, pp. 680-685.
- G. R. Whalther, E. Post, P. Convey, A. Menzel, C.Parmesan, J. J. C. Beebee, J. M. Fromentin, O. Hoegh-Guldberg, and F. Bairlein, “Ecological Responses to Recent Climate Change,” Nature, Vol. 416, No. 6879, 2002, pp. 389-395.
- WHO, “Global Strategic Framework for Integrated Vector Management,” WHO Document, WHO, Geneva, 2004, pp. 1-12.
- C. A. Chapman, T. R. Gillespie and T. L. Goldberg, “Primates and the Ecology of Their Infectious Disease: How Will Anthropogenic Change Affect Host Parasite Interactions?” Evolutionary Anthropology, Vol. 14, No. 4, 2005, pp. 134-144. doi:10.1002/evan.20068
- V. J. Mckenzie and A. R. Townsend, “Parasitic and Infectious Disease Responses to Changing Global Nutrient Cycles,” Ecohealth, Vol. 4, No. 4, 2007, pp. 384-396. doi:10.1007/s10393-007-0131-3
- J. O. Ayoade, “Climate Change: A Synopsis of Its Nature, Causes, Effects & Management,” Vantage Publishers Ltd., Ibadan, 2004.
- A. O. Alaba, “Malaria and Rural Household Productivity in Oyo State,” Ph.D. Thesis, University of Ibadan, Ibadan, 2005.
- WHO, “Action Plan for Malaria Control (1995-2000),” Preventive Action and Intensification of the Struggle against Malaria Control, Mimeograph, WHO, 1995.
- S. I. Efe, “Urban Effects on Precipitation Amount and Rainwater Quality in Warri Metropolis,” Ph.D. Thesis, Delta State University, Abraka, 2005, pp. 86-101.
- S. I. Efe, “Climatology and Global Climate Change in S.H.O. Egboh (Ed.) Man, His Environmental and Sustainable Development,” Delta State University, Printing Press, Abraka, 2010, pp. 86-101.
- E. K. Grover-Kopec, M. B. Blumenthal, P. Ceccato, T. Dinku, J. A. Omumbo and S. J. Connor, “Web-Based Climate Information Resources for Malaria Control in Africa,” Malaria Journal, Vol. 5, No. 38, 2006.
- K. M. Barbour, J. S. Oguntoyinbo, J. O. C. Onyemelukwe, and J. C. Nwafor, “Nigeria in Maps,” Hodder and Stonghton, London, 1982.
- V. P. Sharma and R. Bos, “Determinants of Malaria in South-Asia,” In: E. Casman and H. Dowlatabadi, Eds., The Contextual Determinants of Malaria, Resources for the Future, Washington, 2003.
- “Annual Abstract of Statistics,” Nigeria Statistic Bulletin. http://www.nigerianstat.gov.ng/nbsapps/annual_report.htm. 2008.
- S. O. Vanwambeke, E. F. Lambin, M. P. Eichhorn, et al., “Impact of Land-Use Change on Dengue and Malaria in Northern Thailand,” EcoHealth, Vol. 4, No. 1, 2007, pp. 37-51.
- J. N. Eisenberg, M. A. Desai, K. Levy, et al., “Environmental Determinants of Infectious Disease: A Framework for Tracking Causal Links and Guiding Public Health Research,” Environmental Health Perspectives, Vol. 115, No. 8, 2007, pp. 1216-1223. doi:10.1289/ehp.9806
- L. Molineaux, D. A. Muir, H. C. Spencer and H. C. Werndorfer, “The Epidemiology of Malaria and Its Measurement,” In: W. H. Werndsdorfer and S. Mcgregor, Eds., Malaria: Principles and Practices of Malariology, Churchill Livingstone, Philadelphia, 1988, pp. 999-1089.
- R. W. Sutherst, “Global Change and Human Vulnerability to Vector-Borne Diseases,” Clinical Microbiology Reviews, Vol. 17, No. 1, 2004, pp. 136-173. doi:10.1128/CMR.17.1.136-173.2004
- Nigerian Environmetal Study/Action Team (NEST), “Climate Change in Nigeria: A Communication Guide for Reporters and Educators,” NEST, Ibadan, 2003, pp. 5-16.
- P. A. O. Odjugo, “The Impact of Climate Change on Water Resources; Global and Regional Analysis,” The Indonesian Journal of Geography, Vol. 39. No. 1, 2007, pp. 23-41.
- IPCC, “Contribution of Working Group II to the Fourth Assessment Report of the Intergovernmental Panel on Climate Change,” In: M. L. Parry, O. F. Canziani, J. P. Palutikof, P. J. van der Linden and C. E. Hanson, Eds., Cambridge University Press, Cambridge, 2007.
- “Spore—Climate Change,” Special Issue, 2008, p. 23
- R. M. Olanrewaju, “Climate and Malaria: A Geographer’s View Point. Confluence,” Journal of Environmental Studies, Vol. 1, No. 2, 2006, pp. 90-97.
- J. G. Laah and M. Zubairu, “An Examination of the Trend and Seasonal Variation in the Incidence of Malaria in Gwagwalada, Nigeria,” In: F. E. Bisong, Ed., Geography and the Millenium Development Goals: Translating Vision into Reality in Nigeria, Index Books Publishers, Calabar, 2008, pp. 537-541.
- N. Minakaw, G. Sonye, M. Mogi, A. Githeko and G. Yan, “The Effect of Climate Factors on the Distribution and Abundance of Malaria Vectors in Kenya,” Journal of Medical Entomology, Vol. 39, No. 6, 2002, pp. 833-841.
- A. Ayanlade, N. O. Adeoye and O. Babatimehin, “Climate Change/Variability and Malaria Transmission in Sub-Saharan Africa: A Case of Nigeria,” An International Conference on the Occasion of the 250th Anniversary of the Royal Norwegian Society of Sciences and Letters, Trondheim, 21-24 June 2010.
NOTES
*Corresponding author.