International Journal of Geosciences
Vol.4 No.10(2013), Article ID:41526,9 pages DOI:10.4236/ijg.2013.410141
Oxygen Isotope Study of Silica Sinter from the Osorezan Geothermal Field, Northeast Japan
Graduate School of Life and Environmental Sciences, University of Tsukuba, Tsukuba, Japan
Email: khayashi@geol.tsukuba.ac.jp
Copyright © 2013 Ken-ichiro Hayashi. This is an open access article distributed under the Creative Commons Attribution License, which permits unrestricted use, distribution, and reproduction in any medium, provided the original work is properly cited. In accordance of the Creative Commons Attribution License all Copyrights © 2013 are reserved for SCIRP and the owner of the intellectual property Ken-ichiro Hayashi. All Copyright © 2013 are guarded by law and by SCIRP as a guardian.
Received October 4, 2013; revised November 6, 2013; accepted December 1, 2013
Keywords: Silica Sinter; Crystallinity; Oxygen Isotope; Osorezan Geothermal Field; Trace Element
ABSTRACT
Silica sinter developed on the northern shore of Lake Usoriyama in the Osorezan geothermal field was examined for the occurrence, texture, crystallinity of silica minerals, and the concentrations of trace elements and oxygen isotopes. The silica sinter consists of a thick eastern mound (layer A) and a thin western part (layer B). Most of the silica sinter is composed of alternating bands of thin layers of silica minerals with colors varying from white to yellow and reddish gray. There is a unique stromatolitic texture, an aggregate of stratified concentric layers that extends upward and is red to reddish gray in color in the middle of layer A. Silica minerals, mainly opal-A and opal-CT, dominate the mineralogical constituents of the sinter. The δ18O of the silica mineral in layer A varies between 13‰ and 26‰, while layer B has higher values, between 19‰ and 33‰. The hydrothermal fluid from which the silica sinter precipitated is dominated by meteoric water is similar to present-day hot spring water.
1. Introduction
Silica sinter, made of chemical sediments precipitated from geothermal water in terrestrial environments, records the hydrological state of a geothermal system at the time of its deposition. Many silica sinters with widely varying textural, mineralogical, chemical, and isotopic characteristics are known [1-3]. Silica sinter is commonly associated with epithermal mineralization, and some are economically important as gold ore [4,5].
In active geothermal fields, hydrological data about the present geothermal system can be obtained directly by analyzing hot spring water. The hydrological nature of the geothermal system throughout the past is recorded in silica sinter deposited there, and sequential data from the silica sinter can reveal the history of the geothermal system. In this study, we examine the texture and X-ray powder diffraction of silica minerals, the concentration of trace elements, and oxygen isotopic data from silica sinter at the Osorezan geothermal field in northeastern Japan, and discuss changes in the geothermal activity of the area.
2. The Osorezan Geothermal Field
The Osorezan geothermal field is located on the Shimokita peninsula of northeastern Japan (Figure 1). It lies in the vicinity of Mt. Osorezan, an active Quaternary volcano on the volcanic front of the northeastern Japanese arc. Mt. Osorezan occupies an area of about 17 km from east to west and 25 km from north to south. It is a composite volcano with strata-volcanoes, a caldera, and post-caldera lava domes. A geological map of the Mt. Osorezan area is shown in Figure 1. The basement of the volcano consists of Mesozoic and Tertiary formations. The Mesozoic formation, on the eastern and western coasts of the Shimokita peninsula, contains slate, chert, limestone, and granodiorite intrusive. The Mesozoic basement forms a graben structure in the middle part of the peninsula [6,7].
Erupted volcanic rocks that cover the basement are composed of basaltic andesite, andesite, and dacite, which belong to the low-alkaline thoreiite series [8]. The volcanic activity of the area can be broken into three major periods. First, at about 1Ma, was the eruption of basaltic
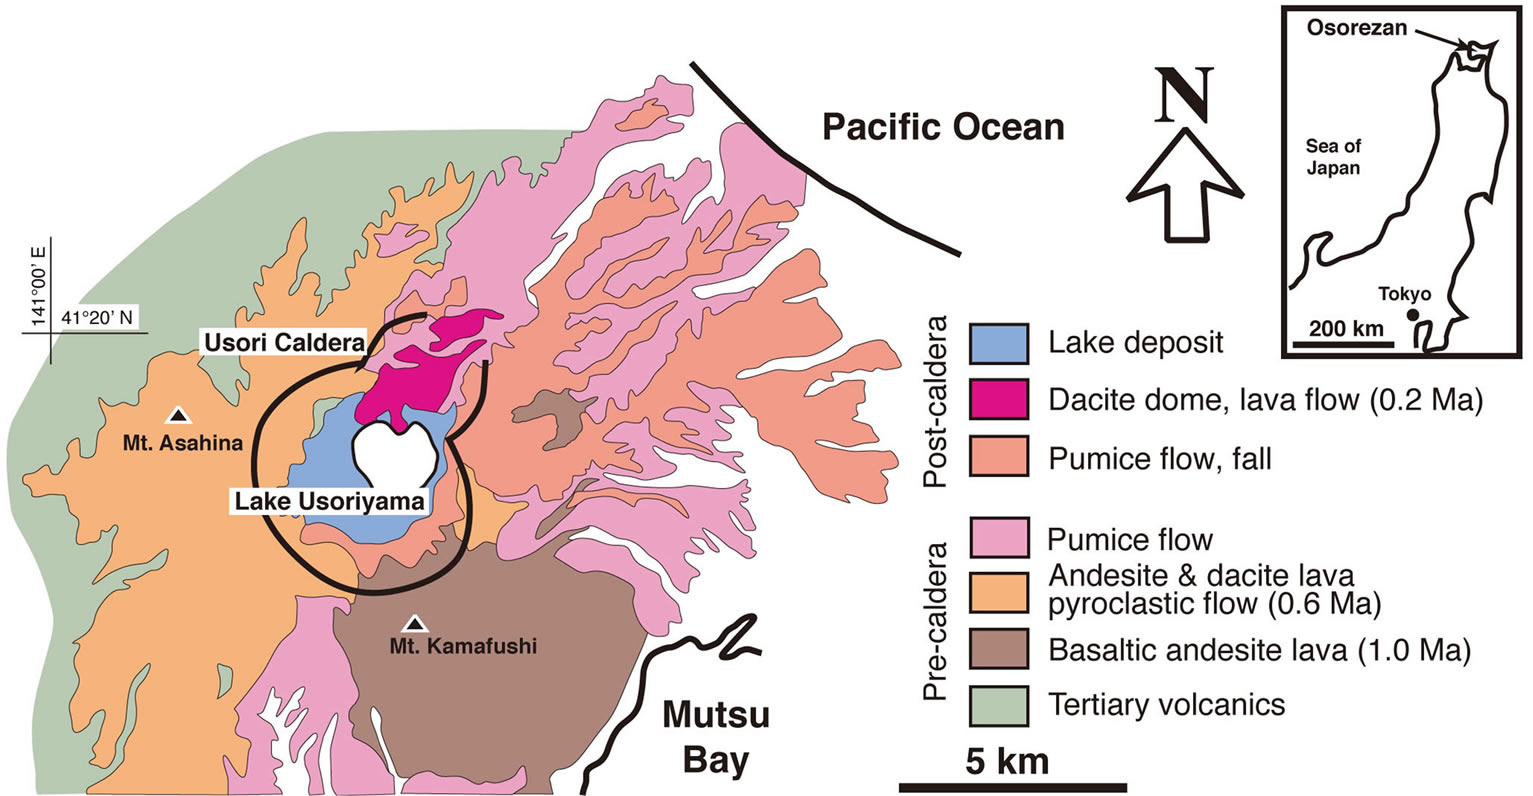
Figure 1. Geological map of the Osorezan volcano, modified from [8]. Age data from [6].
andesite that formed the stratovolcano of Mt. Kamafushi at the southeastern corner of the present caldera. The main activity, occurring about 0.6 Ma was characterized by eruptions of andesite and large-scale acidic pumice flows, accompanied by the formation of a caldera about 4 km in diameter. Lake Usoriyama, the lake in the center of the caldera, was formed during this stage. The third period is the post-caldera stage, during which dacite domes formed about 0.2 Ma in the northern part of the caldera. According to a K-Ar age determination by Aoki (1991) [9], these volcanic activities have moved from southeast to northwest in the area over a period of about 1 million years. Although the volcanic activity has weakened, fumaroles and discharges from hot springs are observed at the foot of the dacite domes in the caldera.
Remarkable fumaroles are distributed along a narrow zone running E-W between the northern shore of Lake Usoriyama and the latest hornblende dacite lava domes. The dacite lava and lake deposits have been strongly altered by the geothermal activity [10]. Alteration minerals are distributed in zones from a central strong silicification zone at the southern foot of the latest domes to a marginal montmorillonite through an intermediate kaolinite zone (Figure 2). Alunite occurs around the strong silicification zone. Opal-CT, cristobalite, and tridymite are the common silica minerals throughout the surface alteration halo. These altered rocks were covered with chemical precipitates from hot springs. Silica sinter, native sulfur, and iron sulfides are abundant in these deposits [11].
According to Aoki (1992) [6], the geothermal water is dominantly acidic sulfate-type, but neutral pH, NaCltype water is also observed. Aoki (1992) [6] suggested three endmembers as possible origins of the geothermal water. They are a neutral pH brine solution formed during fluid boiling, which allowed volatile acid components
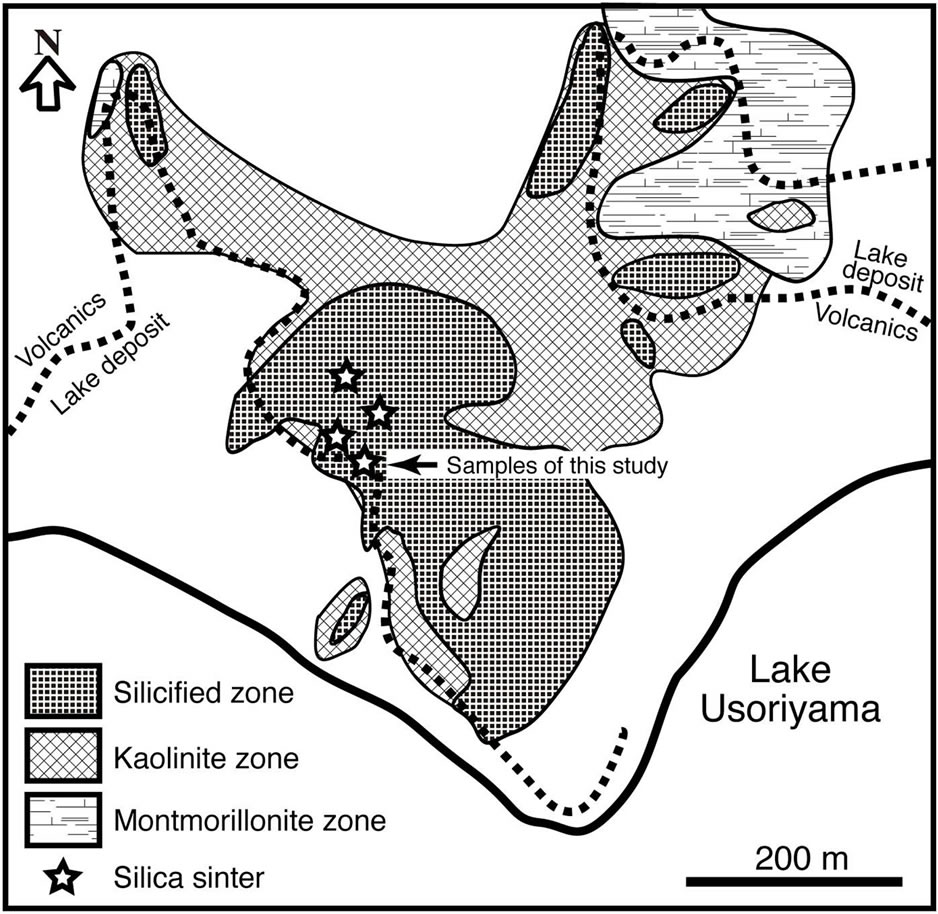
Figure 2. Distribution of hydrothermal altered zones on the north shore of Lake Usoriyama. Modified after [6].
to escape, steam-heated acid sulfate water, and groundwater that contain gaseous species such as CO2 and H2S. Because spring water pouring out at the surface is a mixture of groundwater and water from above, it can have a variety of compositions. Geothermal waters precipitating silica sinter and/or arsenic and antimony sulfides are concentrated brines, probably supplied from a geothermal reservoir. The temperature of the geothermal reservoir is estimated to be 220˚C - 240˚C from an alkalinesilica geothermometer, and it lies 300 - 400 m beneath the surface [6].
3. Sample
The silica sinter of this study was collected at the northern shore of Lake Usoriyama (Figure 2), where a terrace of silica sinter is distributed in an area about 50 × 100 m2 on the altered dacite of the lava dome (Figure 3A). There are several active vents that spout hot water that precipitates silica sinter (Figure 3B). Newly formed silica precipitates are colorless and very thin (<1 cm). Samples for this study were collected about 50 m southeast of the active vent, where silica sinter has formed a mound about 20 × 10 m2 (Figure 3C). At this location, there is no hot water spouting out of the ground and the whole body of the silica sinter is dry. The mound is 150 cm thick at its thickest, thinning toward the west to about 30 cm. The banded structure of the mound suggests discontinuous precipitation of silica between the thick eastern mound (layer A) and the thin western part (layer B) (Figure 3A). The occurrence shows that the marginal part of layer A was overlaid by layer B, and that newly formed silica sinter is precipitating on layer B around active hotspring vents.
The stratigraphic column of sinter (layers A and B) that has developed on the altered country rock is shown schematically in Figure 4A. Its series of layers can be divided into four parts according to the characteristic features of each. The layers are termed A1, A2, A3 and B, from bottom to top. The characteristics of each layer are as follows.
Bedrock: The bedrock, which hosts the series of silica sinter, is altered hornblende dacite of the lava dome. Microscopic observation reveals that broken crystals of quartz of about 1 mm in diameter are commonly included, embedded in a matrix of amorphous silica. The presence of fine aggregates of agate crystals suggests hydrothermal alteration with an acidic solution.
Layer A1: This consists of alternating white to light gray layers about 1cm thick with interspersed with yellowish and reddish layers (Figure 4D). Fragments of crystalline quartz are occasionally embedded in these layers (Figure 4G).
Layer A2: This is characterized by a unique stromatolitic texture, aggregates of stratified concentric layers that extend upward. It is red to reddish gray in color (Figure 4C). Most of this zone is dominated by amorphous silica, but crystalline silica mineral is present in the center of the concentric texture. The red layers contain hematite and/or goethite crystals about 0.5 μm in size (Figure 4F). Silica sinters with stromatolitic textures are observed in several localities, and relationships with microbial activity have been discussed [13,14].
Layer A3: This is characterized by alternating compact, hard white and reddish layers.
Layer B: This is characterized by alternating loose white colored layers about 1 mm thick (Figure 4B). The boundary between each layer is brownish, gradually fading to the next white layer (Figure 4E). This brown layer probably corresponds to materials precipitated during intervals of hydrothermal activity.
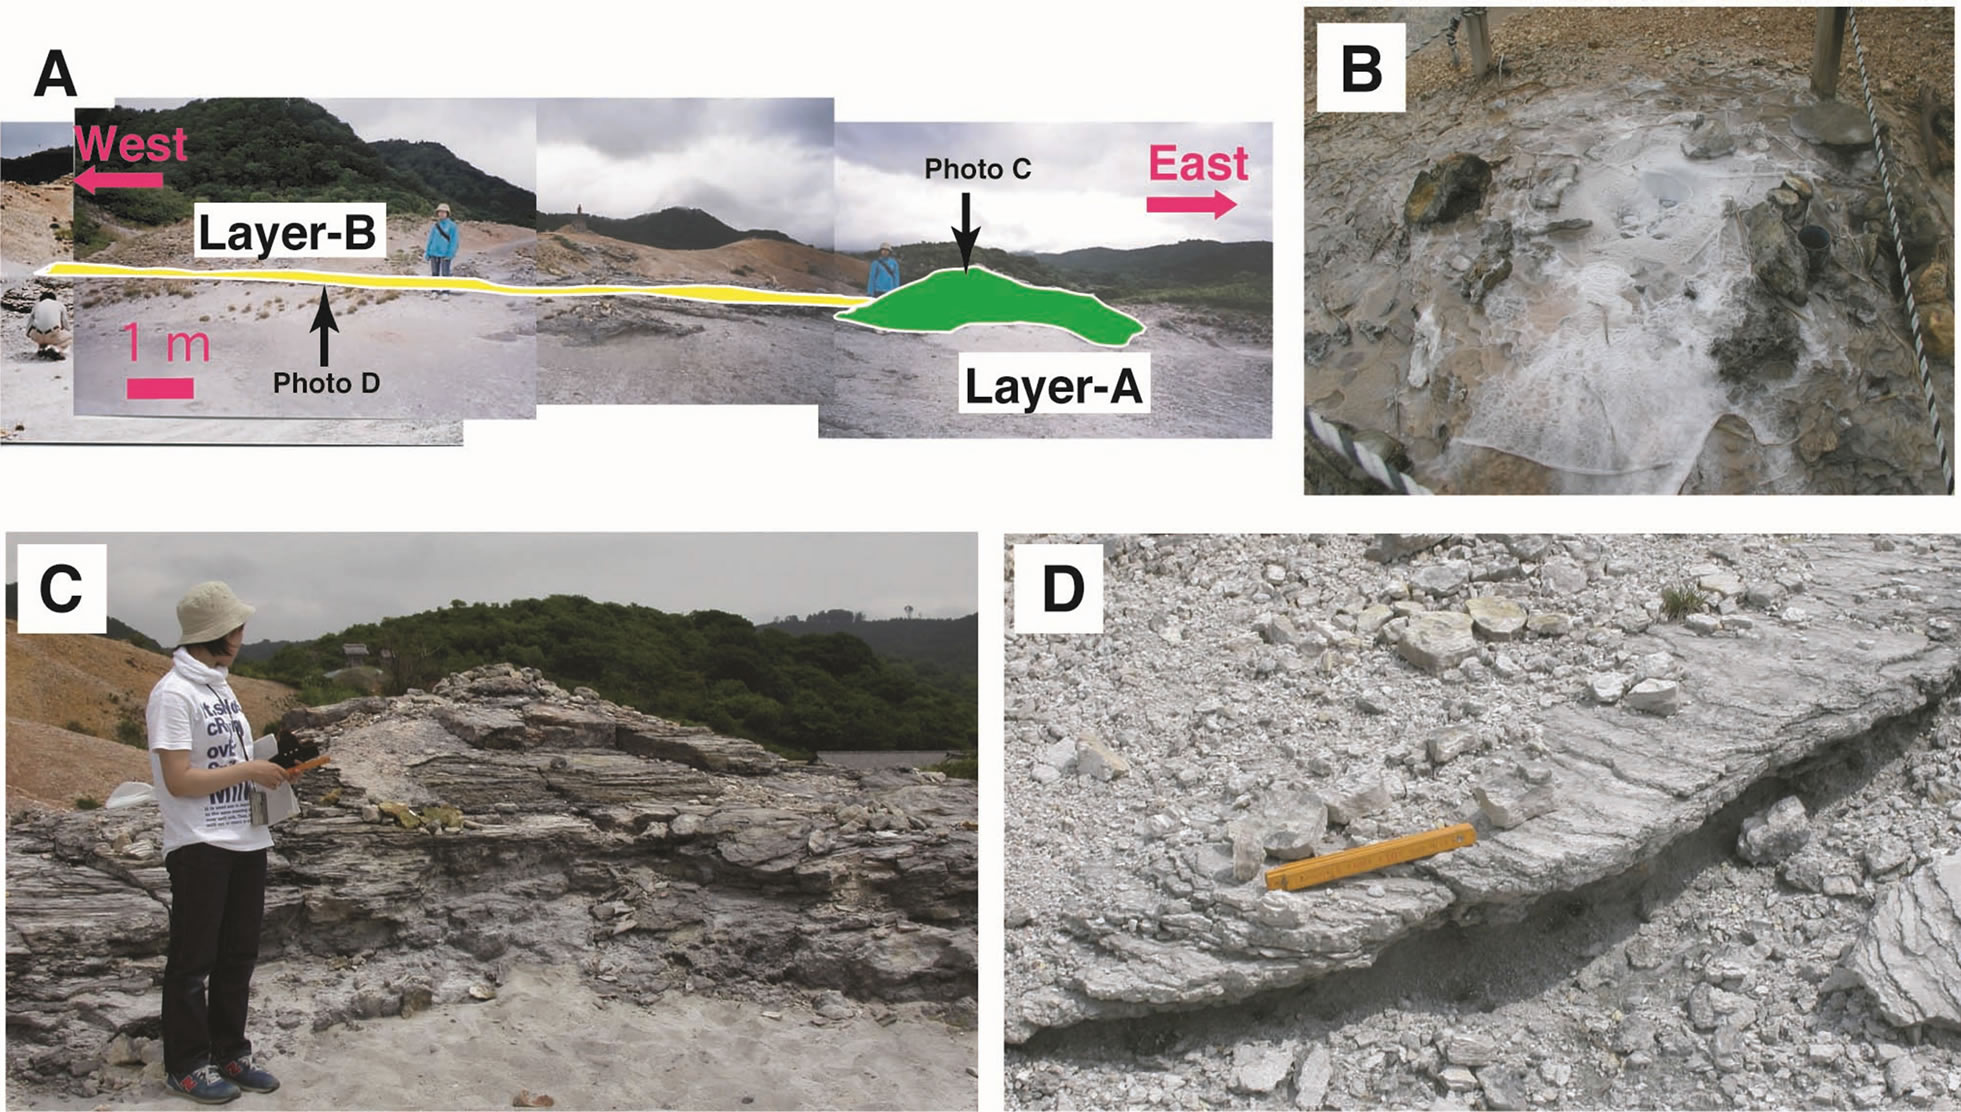
Figure 3. Occurrence of silica sinter on the northern shore of Lake Usoriyama. (A) Overall view of silica sinter, (B) Active vent precipitating silica sinter, (C) Mound silica sinter about 150 cm thick (layer A in photo A) and (D) Thin alternating layers of silica sinter (layer B in photo A).
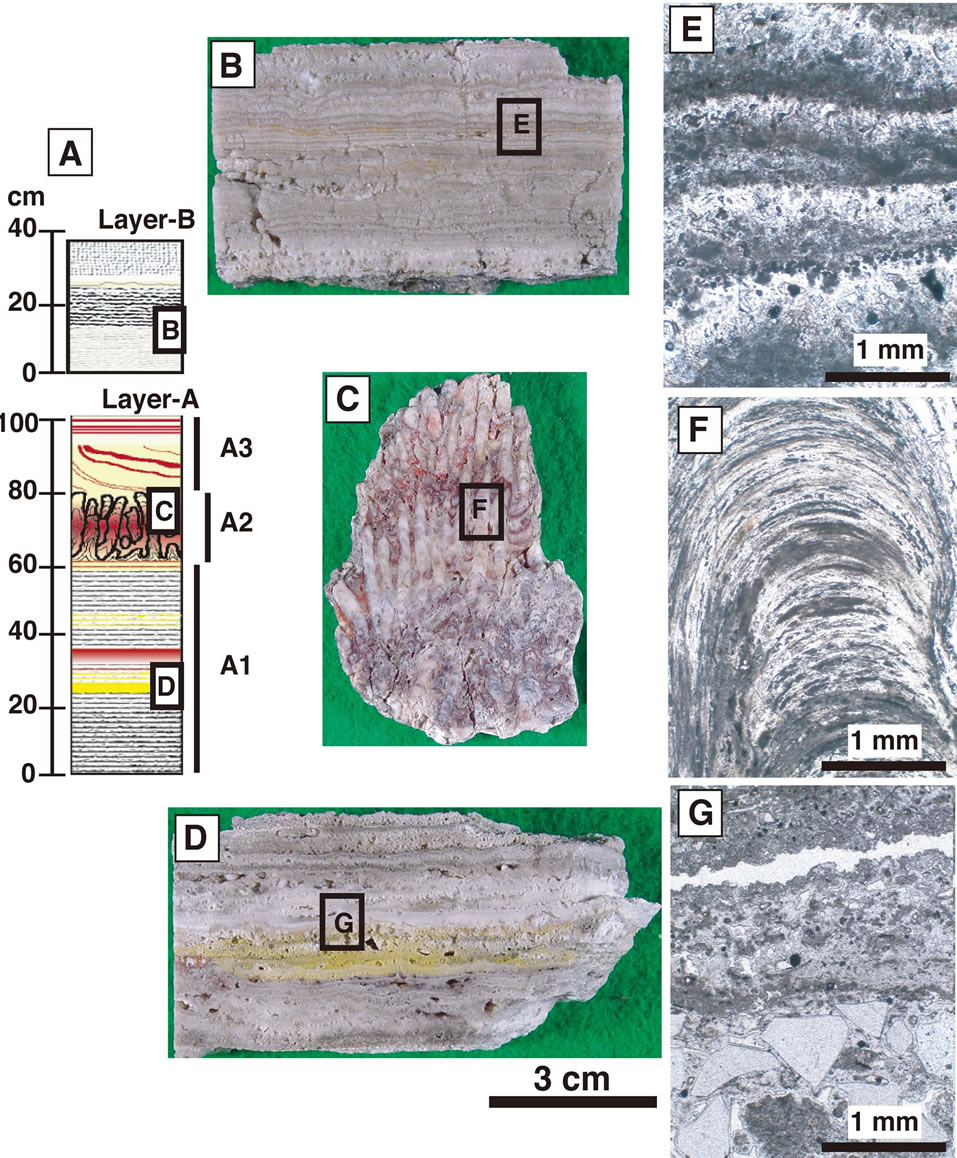
Figure 4. Occurrence of silica sinter. (A) Schematic column of silica sinter, (B and E) Hand specimen and photomicrograph of alternating white layers in layer B, (C and F) hand specimen and photomicrograph of unique stromatolitic structure in layer A2, and (D and G) hand specimen and photomicrograph of alternating white to light gray layers in layer A1.
4. Crystallinity of Silica Minerals
Microscopic observation suggests that the sinter is composed mostly of silica minerals with variable crystallinity. Silica sinter is typically composed of a silica mineral such as opal-A, opal-CT, opal-C, and quartz, or a mixture of them [3]. Initially the silica precipitates from geothermal water as an amorphous opal-A, and then changes to crystalline forms, tridymite and quartz, during diagenesis. Because the crystallinity of silica minerals usually increases after precipitation, the crystallinity of silica minerals can be used as an indicator of the diagenetic history of silica sinter after it precipitates [14,15].
The crystallinity of the silica minerals in our samples was examined by X-ray powder diffraction. Chips of silica sinter were air dried at ambient temperature and then crushed and ground into powder <160 μm in an agate mortar. X-ray diffraction was carried out using CuKα radiation at 35 kV accelerating voltage and 15 mA current. Diffraction was obtained at a 2θ range between 10˚ and 40˚. The scanning speed was 0.6˚ θ/min. Sixteen samples were examined, and typical X-ray diffract grams are shown in Figure 5. Noncrystalline opal-A, paracrystalline opal-CT, and quartz are included in the samples,as
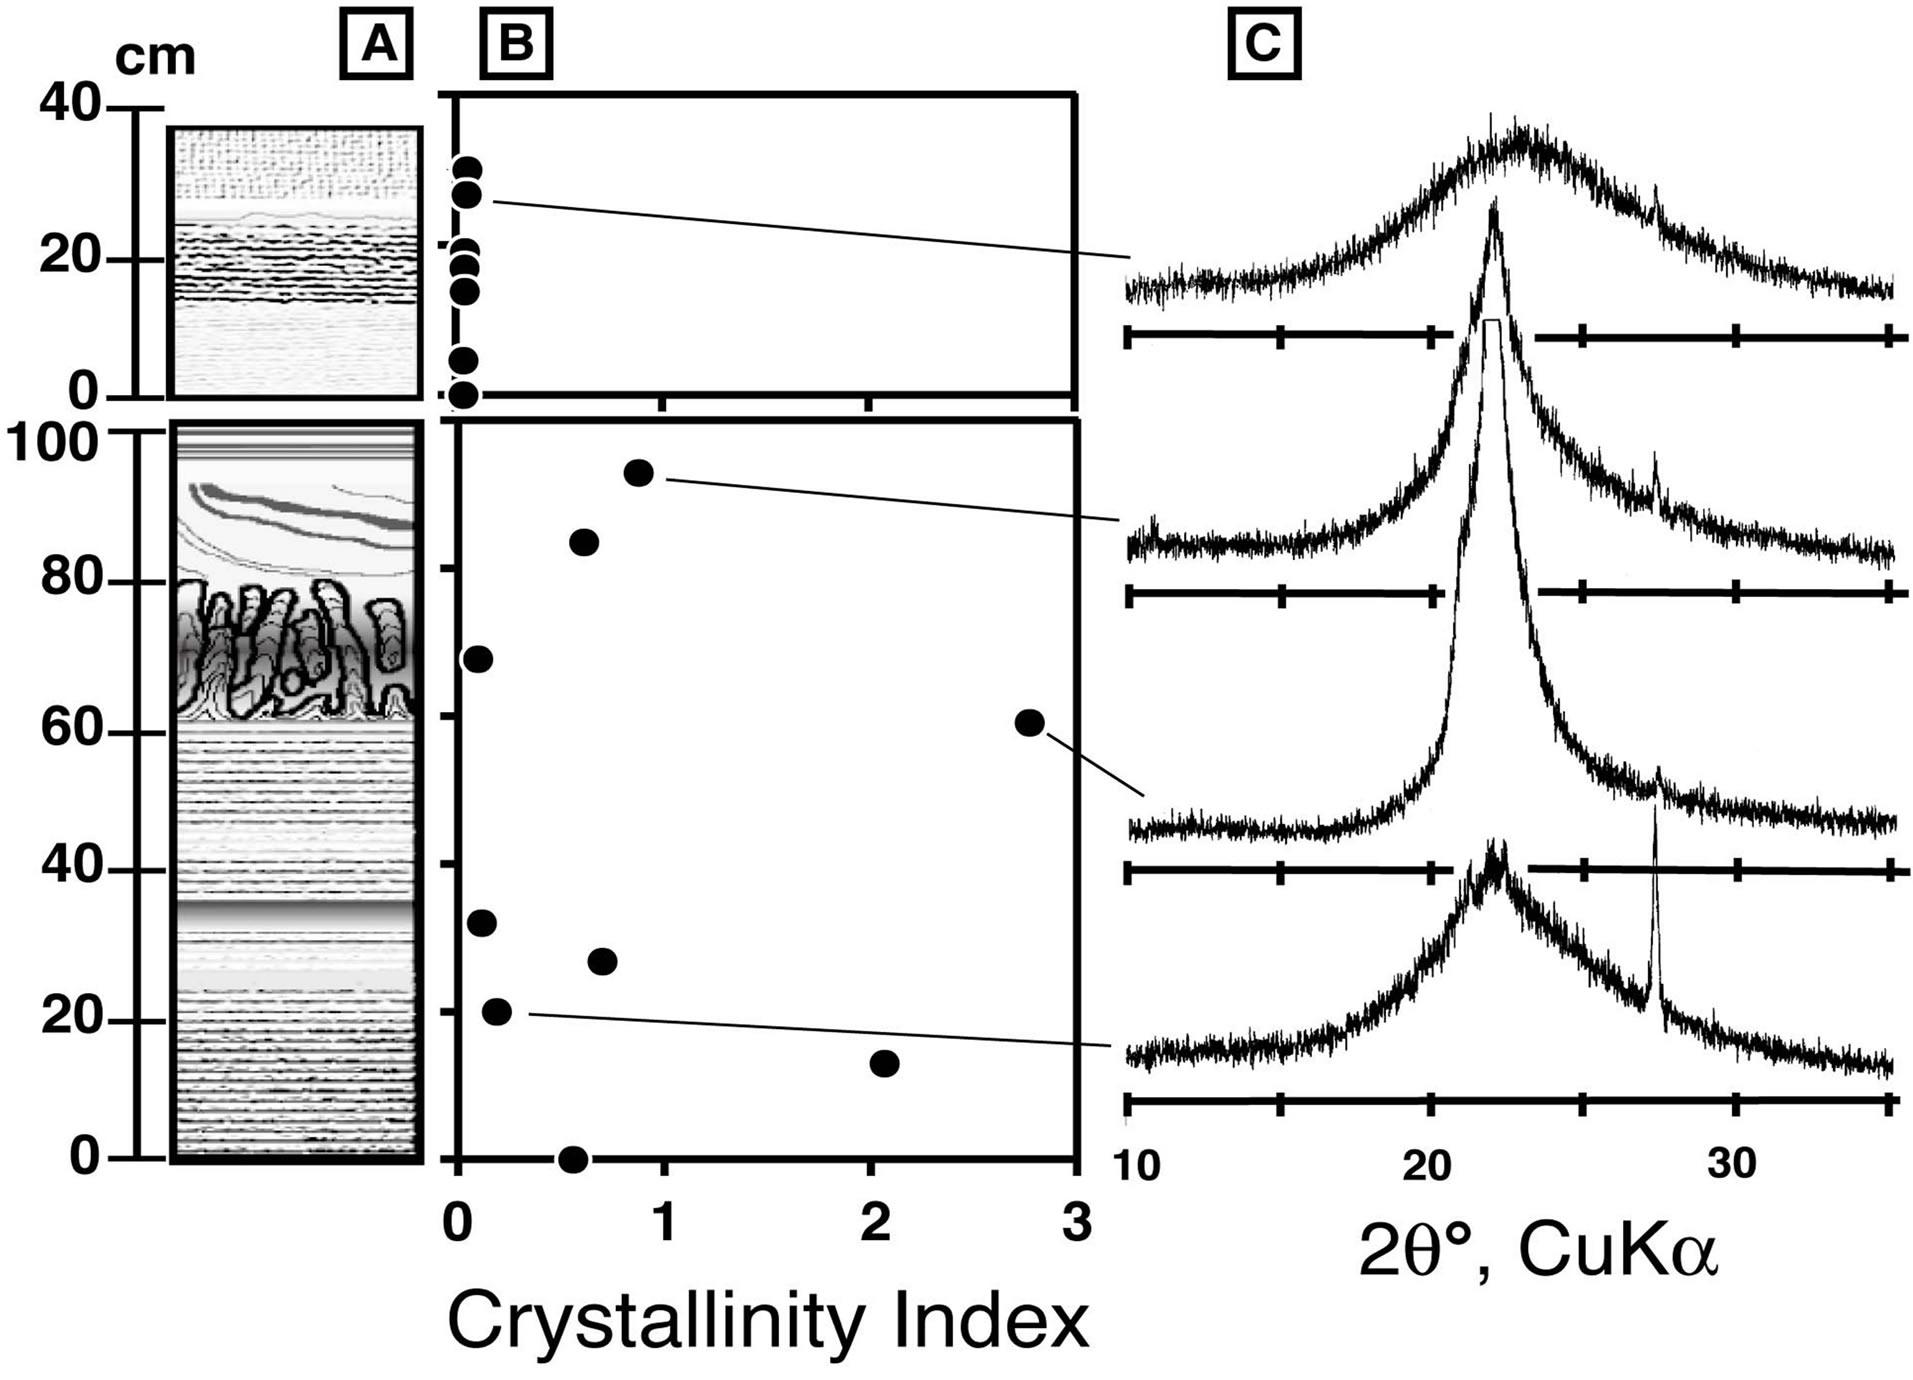
Figure 5. Crystallinity of silica minerals in silica sinter. (A) Schematic column of silica sinter, (B) stratigraphical change of crystallinity index, and (C) typical diffract grams of selected samples.
was done in the method of Lynne et al. (2007) [14]. Layers A and B are dominated by opal-CT and opal-A, respectively. Almost all the samples contained small amounts of quartz, which was probably detritus particles rather than chemical precipitates from the geothermal water. In order to compare the crystallinity of the silica minerals, we calculated their apparent crystallinity (Capp), defined asthe ratio of the height to the width of the X-ray diffraction peak at 2θ around 22˚. The raw curve was smoothed, its baseline was fitted manually, and the maximum intensity (Pheight) and half maximum intensity with its corresponding half intensity width (PHTW) were determined using a method similar to Herdianita et al. (2000) [16].

The crystallinity index, CI, was obtained by normalizing the Capp of a sample to the Capp of a standard material as follows.

The standard material used in this study is quartz in sea sand, commercially distributed by Junsei Chemical Co., Ltd.
The CI value varies between 0.04 and 2.7 (Figure 5B). All samples from layer B have CI values < 0.1, indicating very low crystallinity. Noncrystalline opal-A corresponds to samples with CI values < ~0.2, and samples with CI values ranging from 0.2 to 2.7 correspond to paracrystalline opal-CT. Newly precipitating silica at the active vent has a CI value of 0.02. Crystallinity increases downward in the mound, but the increments are not systematic.
5. Concentration of Trace Elements
We measured the concentrations of trace metals (Au, Hg, As, and Sb) commonly accompanying epithermal mineralization [17,18]. Chemical analyses were carried out at the Ohdate Analytical Technique Center. Powders of samples were dissolved in aqua regia, and the residue was filtrated. The concentrations of As and Sb were measured by inductively coupled plasma analysis (ICP). The Hg concentration was determined by atomic absorption spectroscopy (AAS). Au was extracted from sample solution using methyl isobutyl ketone (MIBK) treatment, and the Au concentration was measured using a graphite furnace AAS technique. Fifteen powder samples were analyzed. The results are summarized in Table 1 and plotted in Figure 6.
The Au content ranged from 5 to 310 ppb, with most samples having <20 ppb. Au contents are particularly high in layers A2 and A3. The Hg content ranges between 0.8 and 30.7 ppm with high concentrations observed in the colored bands of layer A1. As varies between 25 and 201 ppm, with higher concentrations observed in colored layers. An exceptionally high concentration of As, 650 ppm, was observed in newly formed white silica sinter from around the active vent. The concentration of Sb varied between 210 and 3000 ppm, with differences between zones being significant. The Sb contents in layer A1 are homogeneous at about 500 ppm, and Sb increases going vertically upward to about 2000 ppm in layer A2 and about 3000 ppm in layer A3. Conversely, the Sb content decreases upward in layer B from 3000 ppm to 1000 ppm.
The distribution of elements in the sinter was examined using an X-ray analytical microscope (Horiba, XGT2000V). A focused X-ray beam 100 μm in diameter irradiated the sample, and the intensity of secondary fluorescent X-rays was measured. We examined a sample from layer A2 that had a characteristic stromatolite structure. Newly formed As-sulfides such as orpiment and realgar are commonly observed at active vents in the area. Because the sample from layer A2 was reddish, red minerals such as realgar and/or cinnabar were thought to be present. The analytical results in Figure 7 show Si and
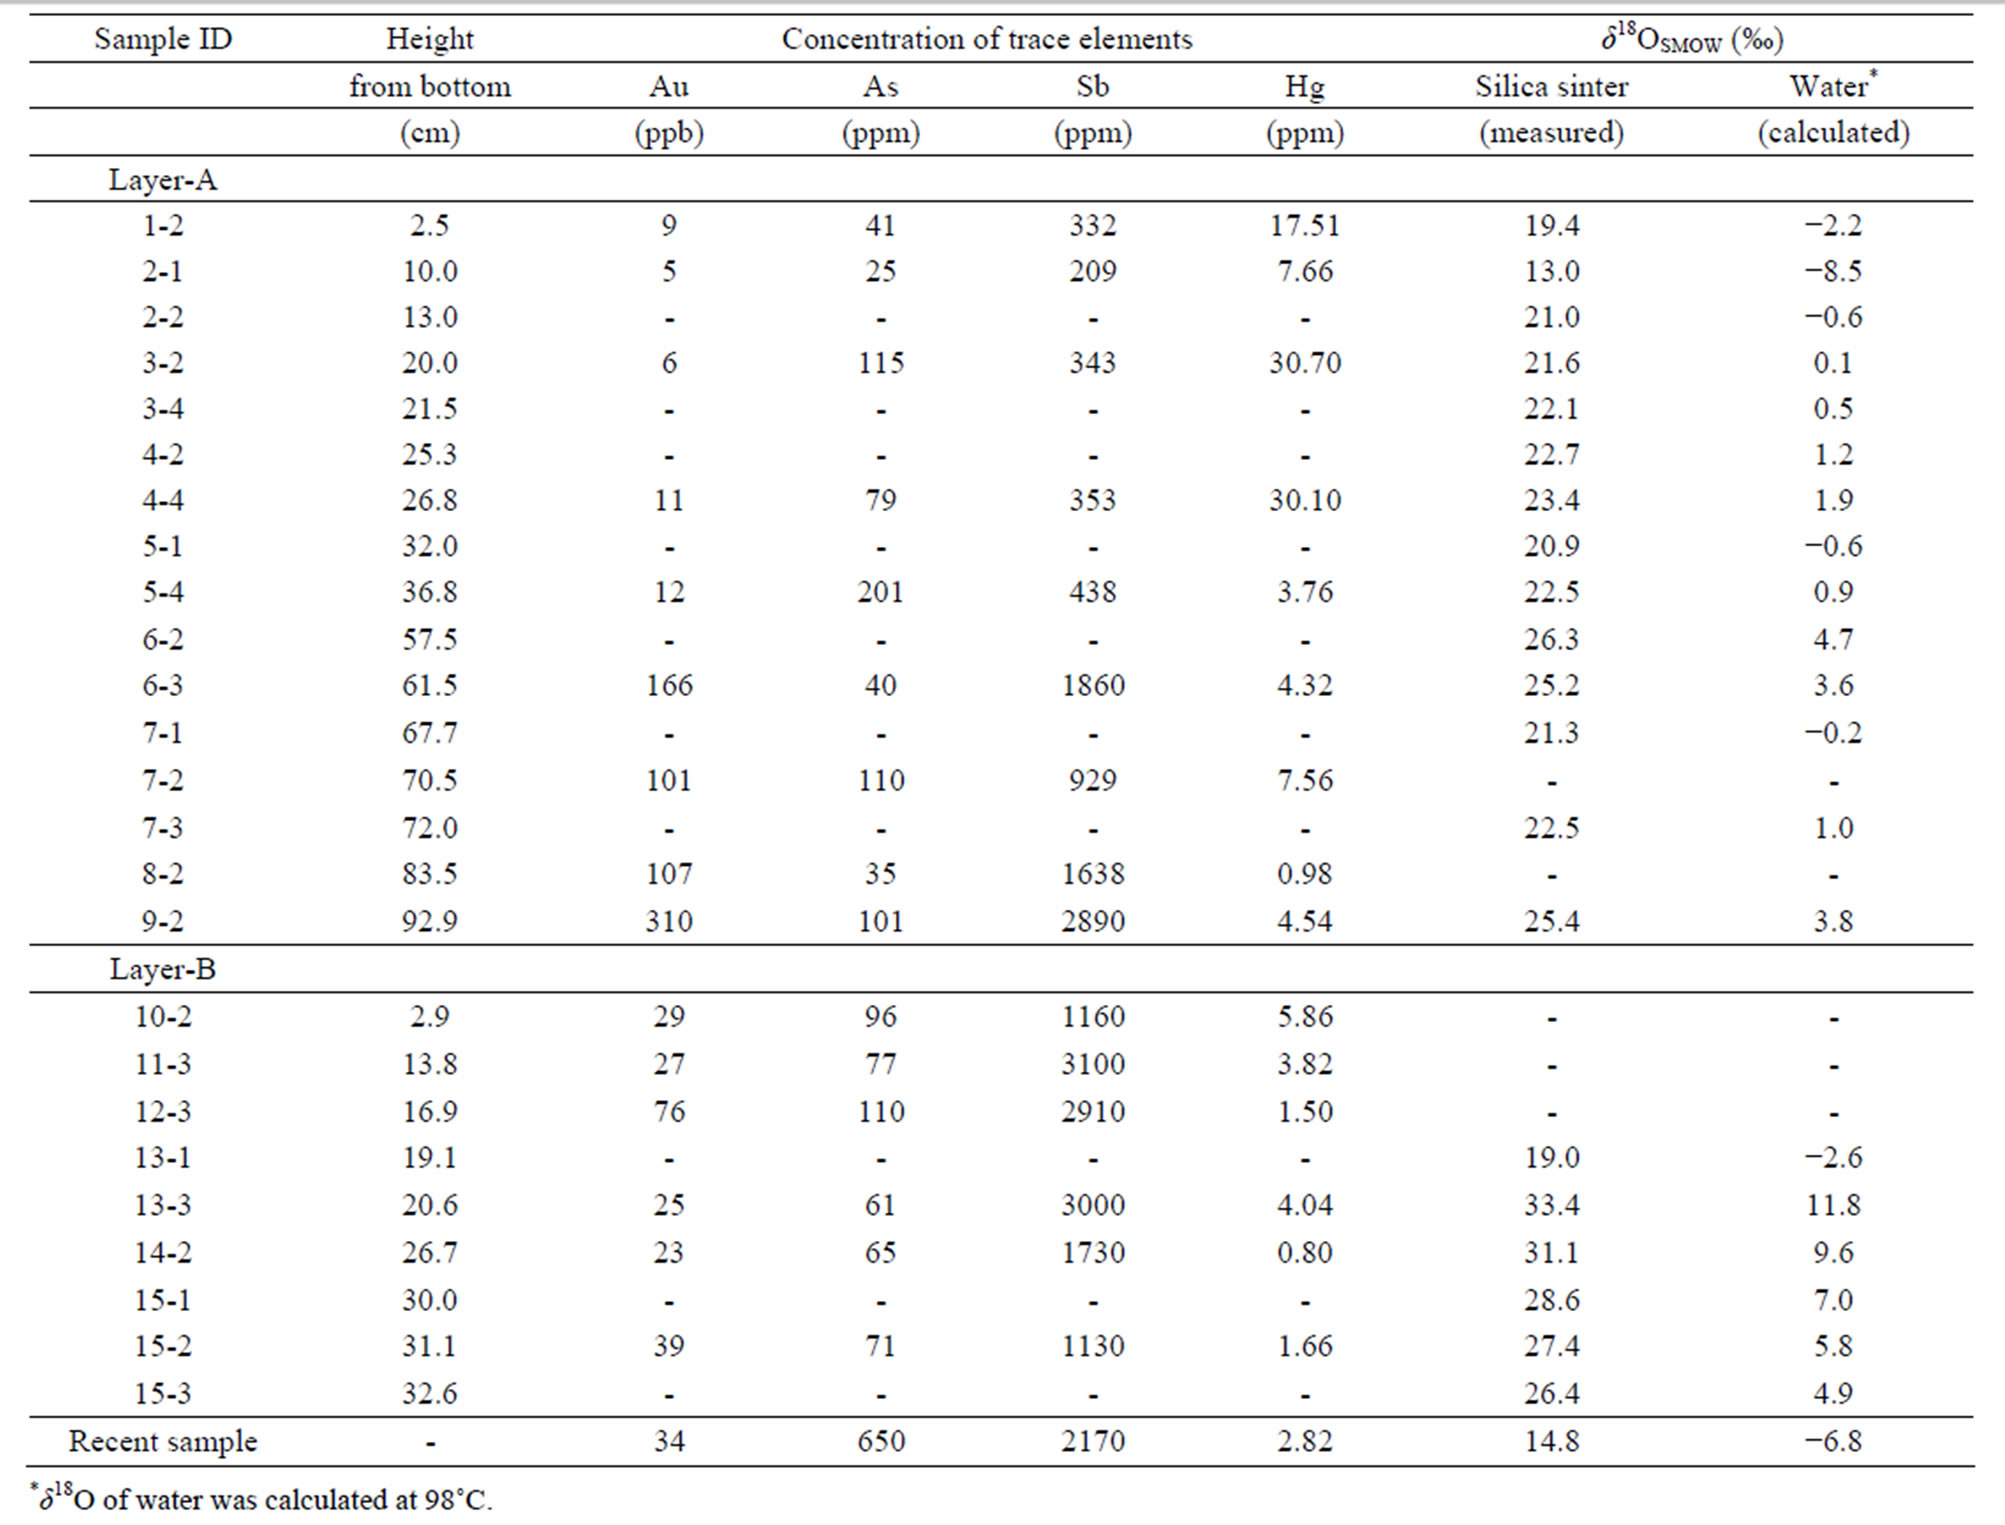
Table 1. Concentrations of trace elements and oxygen isotopic values of silica sinter and amorphous silica precipitating at an active vent.
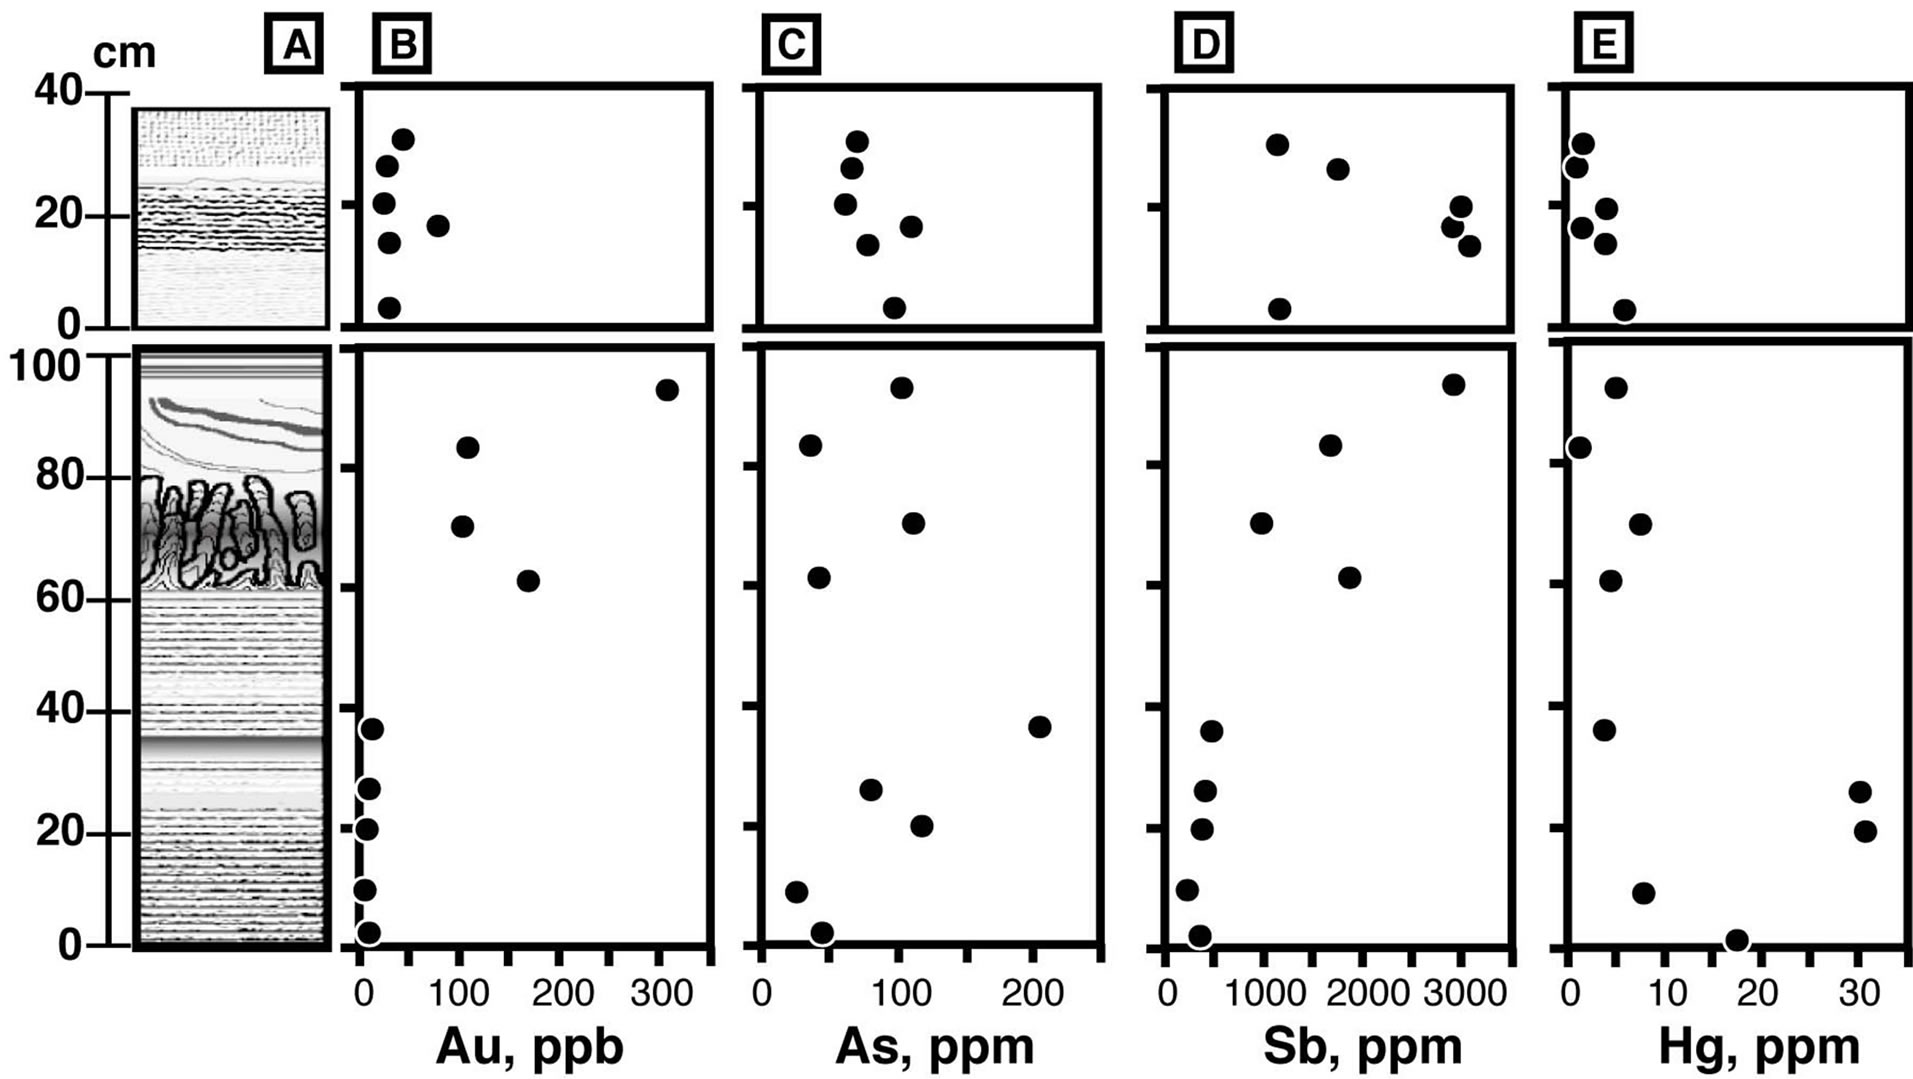
Figure 6. Trace metal concentrations in silica sinter. (A) Schematic column of silica sinter, (B, C, D, and E) concentrations of Au, As, Sb, and Hg.
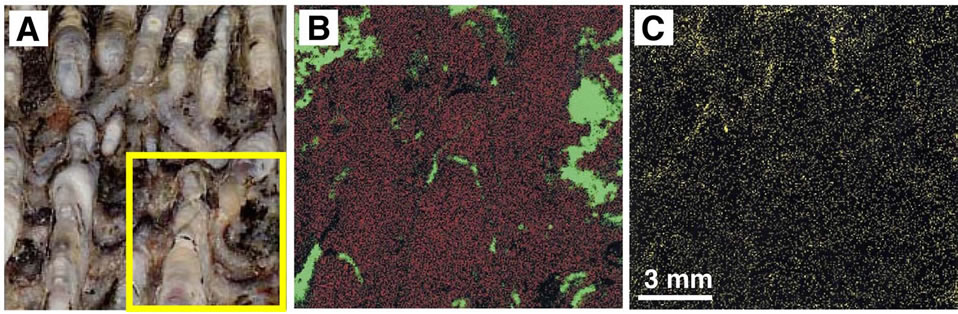
Figure 7. Photo and X-ray analytical microscope images for layer A2 with a stromatolitic texture. (A) Ordinary photo of the sample. Concentration of elements in the square area is shown in B and C. (B) X-ray analytical microscope image. Red and green colors represent Si and Fe, respectively. (C) X-ray analytical microscopic image for S.
Fe to be present, but the concentration of other elements is very low. The red mineral in the sample is mostly hematite. This result agrees with the chemical analysis shown in Table 1.
6. Oxygen Isotopes
Mineral grains were hand picked from slabs of silica sinter under a binocular microscope. Since most of the samples used in this study are monomineralic in nature, the purities of mineral separates were better than 95%. Because our samples, especially those with lower crystallinity, contain water in their crystal structure [19], oxygen can be produced both from water and SiO2 when the sample reacts with a chemical reagent. Therefore samples were left in a BrF5 atmosphere for >5 hours to extract oxygen from water molecules. After no significant oxygen release was confirmed during when the sample reacted with BrF5 at room temperature, oxygen was extracted from the silica minerals.
Oxygen was extracted from the silica minerals with a 17 Watt JLC-200 CO2-laser (l = 10.6 μm) and BrF5 using a fluorination method similar to that described by Hayashi et al. (2001) [20]. Oxygen was converted to CO2 quantitatively in a reaction with heated diamond. The completion of the reaction was checked by measuring the amount of CO2 released from the minerals. The isotopic compositions of the CO2 were measured using a Finnigan MAT 252 mass spectrometer. The 18O/16O ratios are expressed in the conventional δ18O notation relative to Vienna standard mean ocean water (VSMOW). The accuracy of CO2-laser fluorination oxygen isotope analyses was determined by repeated analyses of working standards. The δ18O value of the reference quartz (NBS 28) was measured with each sample. The reproducibility of the δ18O values was better than 0.2‰ [20,21].
A total of 17 mineral separates were analyzed. The results are shown in Figure 8. The δ18O values of the silica minerals in layer A vary between 13‰ and 26‰, while those of layer B are higher, between 19‰ and 33‰. We observed no clear correlation between δ18O and the crystallinity of the silica minerals.
7. Discussion
Because amorphous silica, the primary silica mineral that precipitates from geothermal water [22,23], changes into crystalline form during diagenesis, silica sinter of geological age consists of silica minerals such as opal-A, opal-CT, opal-C, and quartz, or mixtures of these minerals [16]. Since the phase change from amorphous silica to the crystalline releases water from the structure of the silica mineral, the δ18O of a silica mineral may change during diagenesis. A systematic relationship observed between crystallinity (Figure 5) and δ18O (Figure 8) would suggest that the δ18O of the silica mineral has changed since its precipitation. The figures show that the δ18O of
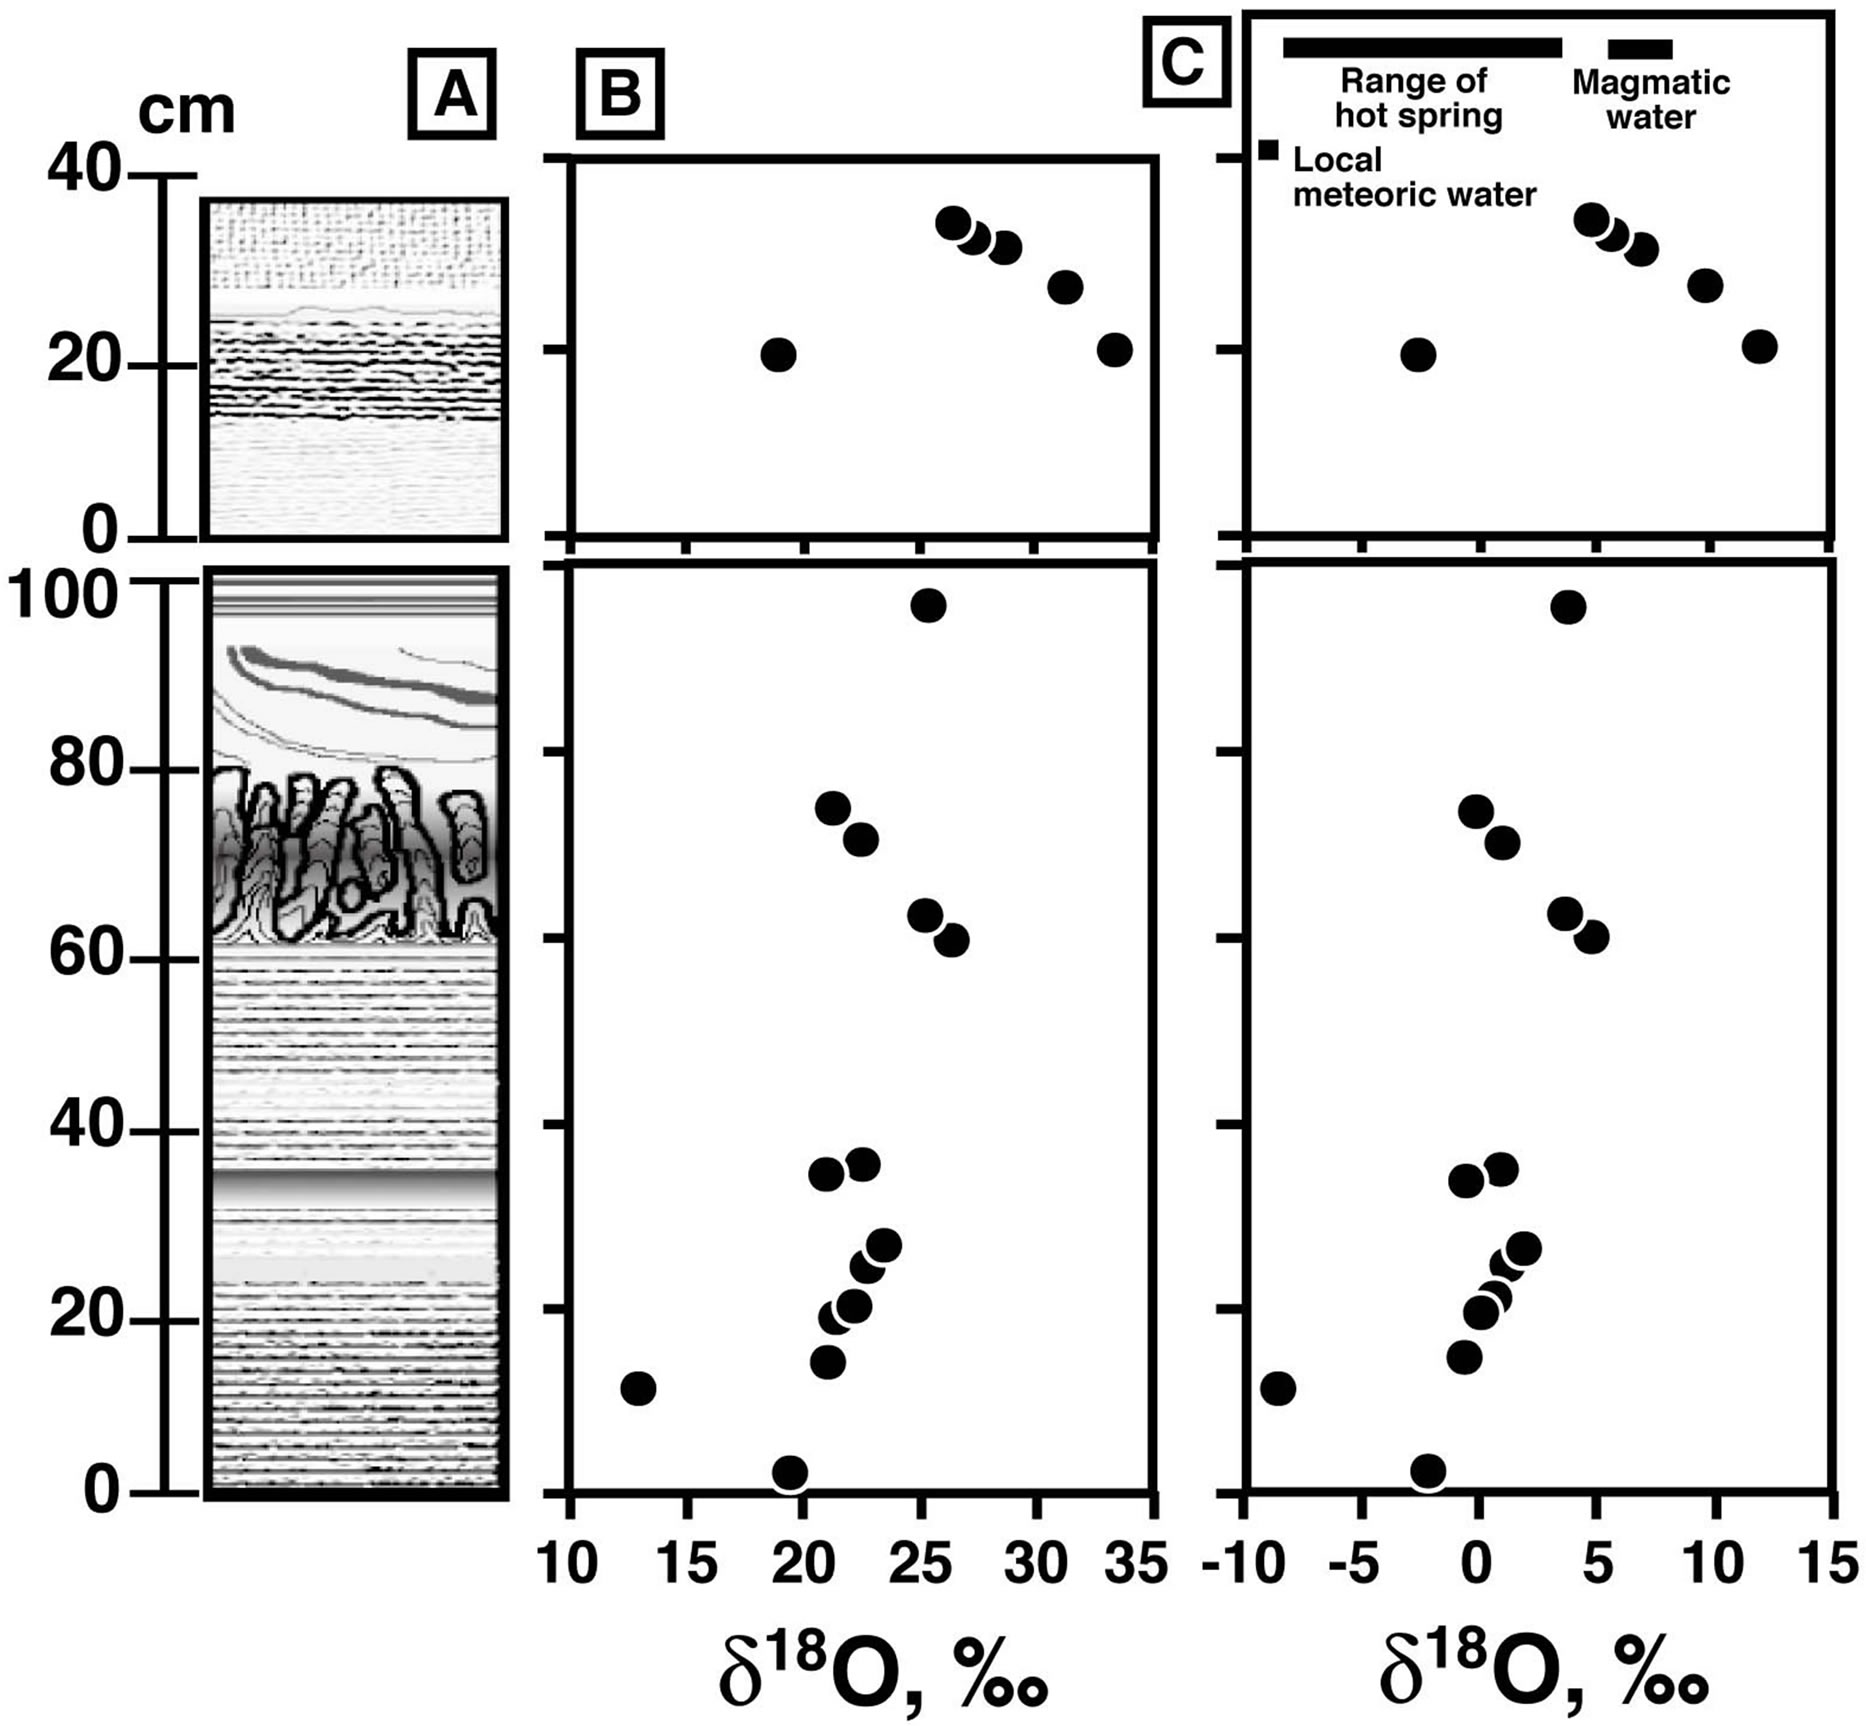
Figure 8. Oxygen Isotopic data for the silica sinter. (A) Schematic column of silica sinter, (B) δ18O values of silica minerals, and (C) the calculated δ18O values for water that precipitated silica minerals at 96˚C. Typical ranges for meteoric water in the area [28], modern hot spring water from the Osorezan geothermal field [6], and magmatic water [25] are shown.
silica sinter has no clear relation with their crystallinity, which may suggest that the δ18O of the silica sinter has not changed greatly during diagenesis but has preserved the characteristics of the primary precipitate.
The δ18O value of silica minerals is controlled primarily by the temperature of precipitation and the δ18O value of the water that transports the silica. For the oxygen isotopes in the silica sinter, there are two probable temperatures that control the minerals’ δ18O values. The first possibility is that the oxygen isotopes in the silica minerals are controlled by the temperature of the geothermal water in the reservoir rock. Because silica sinter is formed at the surface, the silica mineral precipitates at <100˚C, the boiling point of water at 1 atm. Since silica minerals from geothermal water precipitate very rapidly at the surface, oxygen in the structure of the dissolved aqueous silica (H4SiO4 or a more complex formula, [19]) cannot exchange with the oxygen of surrounding water molecules. Therefore, the temperature of the water in geothermal reservoir, rather than the temperature at precipitation, has been preserved in the isotopic oxygen value of silica minerals. The second possibility is that the δ18O value of silica sinter may be controlled by the temperature of precipitation, probably around 100˚C. If the exchange of oxygen between the dissolved aqueous silica and the water is very rapid, the silica minerals will bear a record of the temperature of precipitation in their isotopic makeup. We will examine these two possibilities.
The temperature of the geothermal reservoir in the Osorezan area was estimated to be about 220˚C based on alkali and silica geothermometers [6,22]. The isotopic oxygen values of the water from which the silica precipitated are calculated at 220˚C from the δ18O values of the silica minerals using an oxygen isotope fractionation factor between quartz and water.
The calculated δ18O values of the water that was responsible for depositing the silica sinter in layer A are 8.4-14.3‰, and those in layer B are 8.0‰ - 22.1‰ with most δ18O values being >10‰. The δ18O values that are >10‰ are much heavier than those of meteoric water (<0‰), sea water (~0‰) and magmatic water (typically in the range of 8‰ ± 2‰) [25]. Such very high isotopic values are significant for waters formed when water reacts with sedimentary and/or metamorphic rocks at low temperatures [26]. However, water from such origins is not likely to be included in the geothermal system in the Osorezan area.
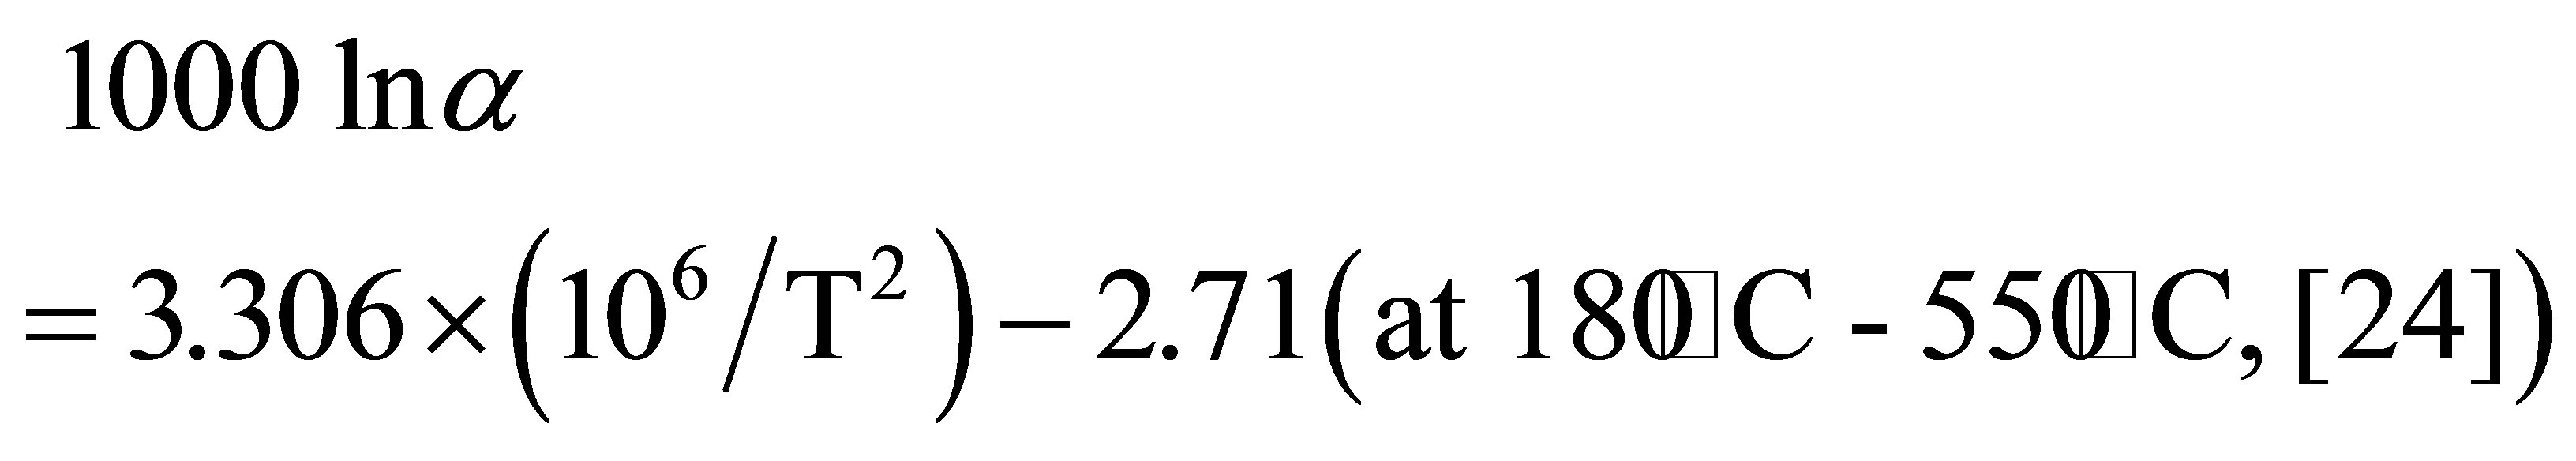
The temperature of the water that actually precipitates amorphous silica around active vent is 96˚C. Thus, δ18O values for water are calculated at 96˚C using the δ18O values of the silica mineral. The following equation is used for the fractionation factor between water and amorphous silica.

The calculated δ18O values of the water are −8.3‰ to 4.6‰ in layer A and −2.5‰ to 11.5‰ in layer B. The δ18O values of modern geothermal water observed at the Osorezan area are between −10‰ and 3‰ [6], which are in the range between meteoric water in the area (−9‰) [28], and high-temperature volcanic gas (6‰ to 8‰) [29]. The calculated δ18O values at 96˚C agree very reasonably with those of natural water. Therefore, silica minerals, especially opal-A, precipitate under an isotopic equilibrium between oxygen in their structures and water, even at relatively low temperatures around 100˚C. A similar isotopic equilibrium was reported in silica scale precipitated inside the production pipes of wells at a geothermal plant. Based on the fractionation factor estimated from the δ18O values of amorphous silica and water, Kita et al. (1985) [26] suggested equilibrated oxygen isotope fractionation even at low temperatures.
Aoki (1992) [6] suggested that mixing of the three endmember fluids (neutral pH chloride, steam-heated acid sulfate, and steam-heated CO2-rich waters) and cold groundwater can reasonably explain the observed variation in the surface composition of hot springs in the Osorezan geothermal field. The δ18O-δD plot of the hot spring waters clearly shows the mixing trend of local groundwater and high-temperature volcanic fluids [6]. The δ18O of the hot spring water in the area varies between −9‰ and +3‰ (Figure 8C), and the isotopic composition of the least-diluted neutral pH chloride fluid is δ18O = ~3‰. The δ18O of the water estimated from the δ18O of the silica sinter is heavier than that of local meteoric water, but approximately overlaps with the δ18O range observed in present-day hot spring waters. This overlap suggests that the origin of the water from which the 150 cm thick silica sinter of this study precipitated is not different from present day hot spring water.
δ18O values of the water calculated from the silica sinter of layer B are higher than those in layer A. The high δ18O values suggest the influence of high-temperature magmatic fluid in layer B. The concentrations of metals such as Sb are rather high in layer B. This also suggests a larger influence of a magmatic component in layer B.
8. Summary and Conclusions
The major features of the silica sinter from the Osorezan geothermal field can be summarized as follows:
1) The silica sinter of this study consists of two parts, a thick eastern mound (layer A) and a thin western part
(layer B). Layer A’s maximum thickness is 150 cm, and it consists of alternating white to light gray layers about 1 cm thick interspersed with yellowish and reddish layers. A red to reddish gray layer with a unique stromatolitic texture, having aggregates of stratified concentric layers extending upward, appears in the middle of layer A. Layer B is characterized by alternating loose white layers about 1 mm thick.
2) The mineralogical constituents of the sinter are dominated by silica minerals. Layer B consists of opal-A, while layer A contains opal-A and opal-CT.
3) We measure trace elements such as Au, Hg, As, and Sb. Au content ranges from 5 to 310 ppb, and Hg content is between 0.8 and 30.7 ppm, with high concentrations observed in the colored layers of layer A. The concentration of As varies between 25 and 201 ppm, and an exceptionally high concentration of As, 650 ppm, was observed in newly formed white silica sinter around an active vent.
4) The δ18O of the silica minerals in layer A vary between 13‰ and 26‰, while those of layer B are higher, from 19‰ to 33‰. The hydrothermal fluid from which the silica sinter precipitates is dominated by meteoric water is similar to present day hot spring water.
9. Acknowledgements
This work was supported by a Grant-in-Aid for Scientific Research from the Japan Society for the Promotion of Science (JSPS).
REFERENCES
- A. Belhadi, T. Nakanishi, K. Watanabe and E. Izawa, “Gold Mineralization and Occurrence of Sinter in the Hoshino Area, Fukuoka Prefecture, Japan,” Resource Geology, Vol. 52, No. 4, 2002, pp. 371-380. http://dx.doi.org/10.1111/j.1751-3928.2002.tb00147.x
- B. Jones, R. W. Renaut and M. R. Rosen, “Biogenicity of Silica Precipitation around Geysers and Hot-Spring Vents, North Island, New Zealand,” Journal of Sedimentary Research, Vol. 67, No. 1, 1997, pp. 88-104. http://dx.doi.org/10.1306/D42684FF-2B26-11D7-8648000102C1865D
- N. R. Herdianita, P. R. L. Brown, K. A. Rodgers and K. A. Campbell, “Mineralogical and Textural Changes Accompanying Ageing of Silica Sinter,” Minerallium Deposita, Vol. 35, No. 1, 2000, pp. 48-62. http://dx.doi.org/10.1007/s001260050005
- R. L. Sherlock, R. M. Tosdal, N. J. Lehman, J. R. Graney, S. Losh, E. C. Jowett and S. E. Kesler, “Origin of the McLaughlin Mine Sheeted Complex: Metal Zoning, Fluid Inclusion and Isotopic Evidence,” Economic Geology, Vol. 90, No. 8, 1995, pp. 2156-2181. http://dx.doi.org/10.2113/gsecongeo.90.8.2156
- N. H. Trewin, “Depositional Environment and Preservation of Biota in Lower Devonian Hot-springs of Rhynie, Aberdeenshire, Scotland,” Transaction of Royal Society of Edinburgh (Earth Science), Vol. 84, 1994, pp. 433- 442. http://dx.doi.org/10.1017/S0263593300006234
- M. Aoki “Magmatic Fluid Discharging to the Surface from the Osorezan Geothermal System, Northern Honshu, Japan,” Geological Survey of Japan Report, No. 279, 1992, pp. 16-21.
- New Energy and Industrial Technology Development Organization, “Shimokita Area,” Geothermal Development Promotion Survey Project Report, NEDO, No. 9 (in Japanese).
- S. Togashi, “Petrology of Osore-Yama Volcano, Japan,” Journal of Japanese Association of Mineralogists, Petrologists and Economic Geologists, Vol. 72, No. 1, 1977, pp. 45-61. http://dx.doi.org/10.2465/ganko1941.72.45
- M. Aoki “Gold and Base metal Mineralization in an Evolving Hydrothermal System at Osorezan, Northern Honshu, Japan,” Geological Survey of Japan Report, No. 277, 1991, pp. 67-70.
- M. Aoki and M. Hosoda “Mode of Occurrence and Genesis of Silica Minerals in the Osorezan Geothermal Area,” Science Report of Hirosaki University, Vol. 29, 1982, pp. 114-121. (in Japanese)
- M. Aoki and S. Yui, “Mineralogical Properties and Genesis of Scorodite in the Osorezan Geothermal Area,” Science Report of Hirosaki University, Vol. 28, 1981, pp. 104-111. (in Japanese)
- H. Graetsch, “Structural Characteristics of Opaline and Microcrystalline Silica Minerals,” Reviews in Mineralogy, Vol. 29, 1994, pp. 209-232.
- B. Jones, R. W. Renaut and M. R. Rosen, ”Biogenicity of Goldand Silver-Bearing Siliceous Sinters Forming in Hot (75˚C) Anaerobic Spring-water of Champagne Pool, Waiotapu, North Island, New Zealand,” Journal of Geological Society of London, Vol. 158, No. 6, 2001, pp. 895-911.
- B. Y. Lynne, K. A. Campbell, B. J. James, P. R. L. Browne and J. Moore, “Tracking Crystallinity in Siliceous HotSpring Deposits,” American Journal of Science, Vol. 307, No. 3, 2007, pp. 612-641. http://dx.doi.org/10.2475/03.2007.03
- K. J. Murata and M. B. II. Norman, “An Index of Crystallinity for Quartz,” American Journal of Science, Vol. 276, No. 9, 1976, pp. 1120-1130. http://dx.doi.org/10.2475/ajs.276.9.1120
- N. R. Herdianita, K. A. Rodgers and P. R. L. Brown, “Routine Instrumental Procedures to Characterize the Mineralogy of Modern and Ancient Silica Sinters,” Geothermics, Vol. 29, No. 1, 2000, pp. 65-81. http://dx.doi.org/10.1016/S0375-6505(99)00054-1
- R. Cunneen and R. H. Sillitoe, “Paleozoic Hot Spring Sinter in the Drummond Basin, Queensland, Australia,” Economic Geology, Vol. 84, No. 1, 1989, pp. 135-142. http://dx.doi.org/10.2113/gsecongeo.84.1.135
- N. C. White, D. G. Wood and M. C. Lee, “Epithermal Sinters of Paleozoic Age in North Queensland, Australia,” Geology, Vol. 17, No. 8, 1989, pp. 718-722. http://dx.doi.org/10.1130/0091-7613(1989)017<0718:ESOPAI>2.3.CO;2
- R. Day and B. Jones, “Variation in Water Content in Opal-A and Opal-CT from Geyser Discharge Aprons,” Journal of Sedimentary Research, Vol. 78, No. 4, 2008, pp. 301-315. http://dx.doi.org/10.2110/jsr.2008.030
- K. Hayashi, T. Maruyama and H. Satoh, “Precipitation of Gold in a Low-Sulfidation Epithermal Gold Deposit: Insight from a Submillimeter-Scale Oxygen Isotope Analysis of Vein Quartz,” Economic Geology, Vol. 96, No. 1, 2001, pp. 211-216. http://dx.doi.org/10.2113/gsecongeo.96.1.211
- K. Hayashi, T. Maruyama and H. Satoh, “Submillimeter Scale Variation of Oxygen Isotope of Vein Quartz at the Hishikari Deposit, Japan,” Resource Geology, Vol. 50, No. 3, 2000, pp. 141-150.
- R. O. Fournier and J. J. Rowe, “Estimation of Underground Temperatures from the Silica Content of Water from Hot Springs and Wet-steam Wells,” American Journal of Science, Vol. 264, No. 9, 1966, pp. 685-697.
- J. D. Rimstidt and D. R. Cole, “Geothermal Mineralization I: The Mechanism of Formation of the Beowawe, Nevada, Siliceous Sinter Deposit,” American Journal of Science, Vol. 283, No. 8, 1983, pp. 861-875. http://dx.doi.org/10.2475/ajs.283.8.861
- L. Zhang, L. Jingxiu, Z. Huanbo and C. Zhensheng, “Oxygen Isotope Fractionation in the Quartz-Water-Salt System,” Economic Geology, Vol. 84, No. 6, 1989, pp. 1643-1650. http://dx.doi.org/10.2113/gsecongeo.84.6.1643
- J. Hoefs, “Stable Isotope Geochemistry,” 5th Edition, Springer-Verlag, Berlin, 2004. http://dx.doi.org/10.1007/978-3-662-05406-2
- H. P. Taylor, “The Application of Oxygen and Hydrogen Isotope Studies to Problems of Hydrothermal Alteration and Ore Deposition,” Economic Geology, Vol. 69, No. 6, 1974, pp. 843-883. http://dx.doi.org/10.2113/gsecongeo.69.6.843
- I. Kita, S. Taguchi and O. Matsubaya, “Oxygen Isotope Fractionation between Amorphous Silica and Water at 34˚C-93˚C,” Nature, Vol. 314, No. 6006, 1985, pp. 83- 84. http://dx.doi.org/10.1038/314083a0
- C. Mizota and M. Kusakabe, “Spatial Distribution of δD- δ18O Values of Surface and Shallow Groundwaters from Japan, South Korea and East China,” Geochemical Journal, Vol. 28, No. 5, 1994, pp. 387-410. http://dx.doi.org/10.2343/geochemj.28.387
- W. F. Giggenbach, “Isotopic Shifts in Water from Geothermal and Hydrothermal Systems along Convergent Plate Boundaries and their Origin,” Earth and Planetary Science Letters, Vol. 113, No. 4, 1992, pp. 495-510. http://dx.doi.org/10.1016/0012-821X(92)90127-H