Food and Nutrition Sciences
Vol. 3 No. 4 (2012) , Article ID: 18502 , 9 pages DOI:10.4236/fns.2012.34075
Impact of Chlorine, Temperature and Freezing Shock on the Survival Behavior of Escherichia coli O157:H7 on Ready-to-Eat Meats*
![]()
1Food Safety and Intervention Technologies Research Unit, USDA, Agricultural Research Service, Research Facility, Eastern Regional Research Center, Wyndmoor, USA; 2Residue Chemistry and Predictive Microbiology Research Unit, USDA, Agricultural Research Service, Research Facility, Eastern Regional Research Center, Wyndmoor, USA.
Email: {#shiowshuh.sheen, andy.hwang, vijay.juneja}@ars.usda.gov
Received February 4th, 2012; revised March 4th, 2012; accepted March 12th, 2012
Keywords: Chlorine; lag time; growth rate; E. coli O157:H7; modeling
ABSTRACT
Foodborne pathogens continue to pose a potential food safety hazard in ready-to-eat (RTE) meat. Chlorine is commonly used to sanitize processing equipment where Escherichia coli O157:H7 (Ec) may survive and contaminate food products. The objective of this study was to characterize the survival behavior of Ec with different stresses on RTE meats. A multi-strain cocktail of Ec was pre-treated with freezing shock for 15 - 20 h and/or chlorine (0, 25, and 50 ppm) for one hour, and then inoculated onto RTE meat surfaces to obtain about 3.0 log CFU/g. Samples were stored at three abuse temperatures (12˚C, 18˚C, and 24˚C) and Ec was enumerated during the storage. The freezing shock impact was studied using the Ec cocktail stored in a freezer overnight followed by chlorine exposure for one hour. The lag phase and growth rate of Ec were estimated using DMFit (Combase, Baranyi’s model). Results indicated that Ec growth was suppressed by chlorine treatment. Freezing shock was found to have little impact in terms of lag time and growth rate. The lag phase of Ec after exposure to 0 ppm of chlorine (50.3 h) was shorter than that of Ec treated with 25 ppm (54.6 h) and 50 ppm (164.1 h) at 12˚C. However, the lag phase decreased with an increase in temperature, e.g. at 25 ppm, lag times were 54.6, 51.1 and 48.9 h for 12˚C, 18˚C and 24˚C, respectively. Lag times increased with an increase in chlorine concentration. At 24˚C, lag times were 15.8, 48.9, and 52.4 h for 0, 25, and 50 ppm, respectively. The growth rate increased with an increase in temperature for 0 and 25 ppm chlorine levels, but decreased at 50 ppm level. Growth rate and lag phase as a function of temperature and chlorine concentration can be described by polynomial models and modified Ratkowsky-type and Zwietering-type models. Results of this study will contribute to risk assessment of RTE meats.
1. Introduction
Foodborne pathogen (e.g. Escherichia coli O157:H7, Listeria monocytogenes and Salmonella spp.) contamination in foods is one of the safety concerns for the consumers, manufacturers and regulatory agencies. E. coli O157:H7 has been isolated from ready-to-eat (RTE) foods and implicated in several outbreaks [1,2]. The Centers for Disease Control and Prevention (CDC) [3] estimated that 48 million people (1 in 6 Americans) get sick, 128,000 are hospitalized, and 3000 die each year from foodborne diseases in the US Outbreaks of foodborne illness and their economical and public health impacts have been reported by the Foodborne Diseases Active Surveillance Network [4] and Frenzen et al. [5]. Due to the high cost of illness and potential threat to public health, both FDA and FSIS have set up rigid standard procedures to monitor the food processes and supply chain to enhance food safety.
With the ubiquity of E. coli O157:H7 in the environment, cross-contamination of this microorganism could result from contacts among contaminated processing equipments, workers, and foods which have no further treatment before consumption. In order to reduce the microbial foodborne hazard, surface sanitation using chlorinated water is one of the most common sanitation methods in food processing plants. Chlorine is a very effective agent in water treatment (portable water and water used in recreational settings) to eliminate E. coli O157:H7 [6]. There are different reports regarding the chlorine resistance of E. coli O157:H7 in various foods or media. Sharma et al. [7] reported that cells attached to surface or enmeshed in biofilms may have altered sensitivities to cleaners and sanitizers compared to those of planktonic cells. The E. coli O157:H7 cells in biofilms were killed more effectively by treatment with an alkaline cleaner than with hypochlorite alone, possibly through a synergistic effect. Virto et al. [8] observed that addition of small amount of organic matter to the chlorination medium (150 ppm of trypticase soy broth vs. distilled water) drastically increased the resistance of microorganisms, especially in E. coli and Yersinia enterocolitica. Their study further indicated that the resistance may depend on changes of permeabilization of the cytoplasmic membrane. Microorganisms adapting to a changing or hostile environment became resistant to the stress has also reported by others. Taormina and Beuchat [9] studied the survival and heat resistance of L. monocytogenes after alkali and chlorine exposure. Listeria cells survived exposure to processing environments which were not effectively sanitized with alkaline detergents might pose great potentials of cross-contamination. The alkaline-pH-induced cross-protection of Listeria against heat may enhance its survival potential in minimally processed foods. Samelis et al. [10] reported the survival/growth of E. coli O157:H5 in a fresh meat model system with decontamination runoff waste fluid treatment and its resistance to subsequent lactic acid stress (pH 3.5). Wan Norhana et al. [11] reported the effects of temperature, chlorine and acids on the survival of L. monocytogenes and Salmonella on shrimp treated with 100 ppm sodium hypochlorite solution and acetic, hydrochloric and lactic acids. They concluded that pathogens attached to the shrimp surface were more resistant to heat, chlorine and acids when compared to their planktonic counterparts. This conclusion demonstrated that when a model system was used for food safety study, the food model system should be closely monitored to represent the real situations in production or storage. Rajkovic et al. [12] investigated the resistance of three pathogens, including E. coli O157:H7, after exposure to repetitive cycles of mild bactericidal treatments and concluded that the ability of foodborne pathogens to adapt to mild bactericidal treatments created new challenges in risk assessment and hazard analysis. Aarnisalo et al. [13] compared several commercially available disinfectants and chlorinated alkaline cleaners against 10 strains of L. monocytogenes at refrigerated temperatures. They concluded that the adaptive response of L. monocytogenes to disinfectants or chlorinated alkaline cleaners appeared to be a minor concern if proper concentration was used. However, problems associated with the effectiveness in disinfection in industrial applications may rise due to the improper use and lack of understanding of specific limitations.
Cold stress is another factor which could affect microbial survival. It is well known that most food pathogens may survive the cold storage which is commonly used in food industry. E. coli O157:H7 can multiply very slowly at temperature as low as 44˚F (6.7˚C) in ground beef [14]. Bollman et al. [15] studied the impact of cold shock (10˚C, 1.5 h) on survival of E. coli O157:H7 in frozen foods. They found that there was no significant difference on E. coli O157:H7 survival with and without cold shock in ground beef or pork. In contrast, a cold shock treatment showed a significant enhancement on E. coli survival in milk, whole egg or sausage. Grzadkowska and Griffiths [16] concluded that E. coli O157:H7 had a greater cold shock effect and cryotolerance than nonO157 strains in their study. The food matrix changed the cold shock response in all their investigated E. coli strains. Tasara and Stephan [17] presented an overview of L. monocytogenes adaptation to the environmental cold stresses and the molecular adaptive and/or response mechanisms, which provided useful insights regarding how L. monocytogenes and other foodborne pathogens may survive a physical or chemical shocking exposure.
The objectives of this study were 1) to investigate the effects of stresses (including freezing shock and chlorine exposure) on the growth of E. coli O157:H7 in RTE meat and 2) to model the E. coli O157:H7 behavior as affected by the imposed stresses and temperature.
2. Materials and Methods
2.1. E. coli O157:H7 Strains and Cocktail Preparation
A cocktail of five E. coli O157:H7 strains, which were isolated and obtained from the Food Safety and Inspection Service (FSIS) from pork sandwich (strain OB- 90520A), bottom round (strain OB1525C), beef patty (strain OB1423C), ground beef (strain OB1680G), and salami outbreak (strain 380 - 94), was used in this study. A loopful of each strain was transferred from a −80˚C stock culture into 10 ml Brian Heart Infusion broth (BHI, Becton, Dickinson and Company, Sparks, MD) and incubated at 37˚C for 6 h. A loopful of cell suspension of each strain was then separately transferred to a fresh 10 ml BHI broth and incubated at 37˚C for 24 h. Each strain was plated to verify cell counts for equal contribution with adjustment of adding 0.1% peptone water (PW) before the final cocktail preparation. One ml of cell suspension from each strain was combined, and the cocktail was further diluted with sterile 0.1% PW to the targeted level of E. coli O157:H7.
2.2. Preparation of Chlorine Solution
Chlorine solutions at 250 ppm and 500 ppm were prepared using a 5.25% sodium hypochlorite solution (Fisher Scientific, Pittsburgh, PA). The 250 ppm chlorine solution was prepared by adding 1 ml of sodium hypochlorite with 99 ml of sterile water in a dark glass bottle and mixed well just before the use. Similarly, the 500 ppm chlorine solution was prepared using the sodium hypochlorite and sterile water volume ratio at 1:49.
2.3. Experimental Design
The experimental conditions used to simulate the survival behavior of E. coli O157:H7 exposed to chlorine concentration and abuse temperature were 0 - 50 ppm and 12˚C - 24˚C, respectively. For model development, the full combinations of chlorine and temperature included 9 sets of combination at chlorine concentrations of 0, 25 and 50 ppm and temperatures of 12˚C, 18˚C and 24˚C (i.e. 2 factors × 3 levels). Each set was repeated twice and with duplicate samples for each set; a total of 18 data sets (9 × 2) were used in the regression analyses. Freezing shock was performed using the same design with the addition of an overnight storage in a freezer. The developed models were verified by experimental data selected inside and outside the parameter ranges.
2.4. Chlorine Exposure and Freezing Shock
E. coli O157:H7 cocktail was exposed to chlorine solutions of various concentrations for one hour before inoculation onto RTE meat. The cocktail mixture was blended with a chlorine solution and 0.1% PW at a ratio of 1:1:8 (v/v) to attain the targeted microbial counts and chlorine concentrations. For example, a 5 log CFU/ml E. coli with 25 ppm chlorine was prepared using a 1 ml of 6 log CFU/ml E. coli, 1 ml of 250 ppm chlorine solution and 8 ml of PW. The mixture was vortexed 30 seconds and kept for 1 h to achieve the chlorine exposure time. The pH value of each final mixture was measured by replacing the 1 ml of E. coli O157:H7 cocktail with PW, i.e. 1 ml chlorine solution and 9 ml of PW, using a Daigger pH meter (Daigger Model 5500 pH Meter, Vernon Hills, IL). Since the E. coli O157:H7 survival counts will be reduced during the chlorine shocking treatment, the targeted inoculation counts were attained in several trials. For freezing shock treatment, the prepared cocktail was stored in a freezer overnight before mixing with chlorine. The cold shock was harsher than the treatment at 10˚C, 1.5 h by Bollman et al. [15] or 10˚C, 6 h by Grzadkowska and Griffiths [16]. The ham was purchased at a local manufacturer, sliced, thermal-treated (95˚C, 20 min in a sealed pouch) and then cut into 3 cm × 3 cm size. One-tenth ml of the prepared cocktail at 3 log CFU/ml level was applied evenly onto one side of the 3 cm × 3 cm sliced ham surface (weight about 5 g) and was allowed to dry for 10 - 15 min on a tray under a laminar flow hood before vacuum packed (Model CN 200, MULTIVAC, Kansas City, MO).
2.5. Storage and Microbial Analysis
The samples were stored at 12˚C, 18˚C and 24˚C for up to 10 days. Duplicate samples were enumerated for E. coli O157:H7 counts during storage using the CT-SMAC selective media. At least two sampling were performed for each treatment. To enumerate E. coli O157:H7 count in samples, 0.1 and 0.5 ml of the stomached liquid samples with proper dilutions were evenly spread on the CT-SMAC agar plates and incubated at 37˚C for 24 to 48 h.
2.6. Model Consideration and Development
The growth data were analyzed using the DMFit software available on the Combase website (www.combase.cc). Baranyi and Roberts model [18] was applied to fit the growth data to obtain lag times and growth rates of E. coli O157:H7 at each chlorine and temperature combination. Two categories of models were considered for modeling the lag time (LAG) and growth rate (GR) to describe the E. coli O157:H7 survival after treating with chlorine. One was a typical linear regression or polynomial model based on the experimental design. The other was a secondary model available in the literature which showed the most suitable fit to the current data with necessary modifications. The linear and non-linear regression procedures (SAS, v9.1) were used for data analyses.
3. Results and Discussion
In order to cover a broader range of target parameters, the chlorine upper limit was initially set at 100 ppm. However, it was found difficult to achieve a stable and reliable initial count with 1 h of chlorine exposure. The chlorine was further reduced to 75 ppm and similar results were attained. It implied that chlorine at 75 ppm level and higher imposed a great stress on microbial cells so that a considerable percentage of E. coli O157:H7 was eliminated which is similar to the findings for L. monocytogenes reported by Sheen et al. [19]. At chlorine level, i.e. ≤50 ppm, the initial plate counts on non-selective and selective media showed no significant difference in survival counts (P > 0.05) with counts on non-selective media slightly higher (0.2 - 0.3 log CFU/ml) than the selective one. Since meat samples were pre-treated at 95˚C for 20 min to eliminate the background microbes, very few background counts appeared on the non-selective plates. This observation indicated that permanent damage may have occurred to some E. coli O157:H7 cells, with one hour chlorine exposure. The E. coli O157:H7 count reduction was around 3.0 log CFU/ml at chlorine levels of 25 - 50 ppm. At higher chlorine levels, e.g. ≥100 ppm, typically used in sanitization, E. coli O157:H7 counts may be reduced by ≥106 in seconds or minutes on contact. It should be noted that the chlorine impact on microbial survival depends on many factors, e.g. chlorine concentration, pH, water activity, organic compounds, temperature, contact surface, foods, etc. Peptone (organic compounds) may have enhanced the E. coli O157:H7 survival in the current study, which is consistent with the conclusion by Virto et al. [8]. However, the results demonstrated E. coli O157:H7 behavior and survival, in case of improper cleaning procedures and subsequent RTE meat contamination. The study provides important information for risk assessment.
In this study, the lag phase became longer at low temperatures (i.e. 12˚C) and increased the potential of other microbes (e.g. mold growth was observed) to outgrow E. coli O157:H7 that resulted in making reliable E. coli O157:H7 cell counts difficult. The 0 ppm chlorine treatment served as a control for E. coli O157:H7 growth on the RTE ham at three different temperatures. An additional step in preparing the stressed E. coli O157:H7 sample was performed to further examine E coli O157: H7 growth on RTE meat surface. Following one hour chlorine shock, E. coli (~103 CFU/ml survival) was centrifuged (3000 × g) and washed with 0.1% PW twice and re-suspended, then inoculated on ham surface. No significant difference in either LAG or GR calculations compared with those without wash procedures was observed (P > 0.05). Chlorine residuals were tested using Reflectoquant strip and the RQflex plus system (LRE Relais und Elektronik GMBH, Munich, Germany), and the result showed the residual chlorine was less than 1 ppm.
The chlorine exposure or treatment in this study simulated the cross-contamination in a processing facility where equipment was sanitized between two shifts and biofilm is not involved. However, the sanitization was assumed to be incomplete and E. coli O157:H7 that survived on equipment surface experienced chlorine stress, and then contaminated the RTE meats and proceeded to the finished product line. The chlorine-stressed E. coli O157:H7 level used to inoculate the RTE meat was about 2.7 ± 0.2 log CFU/ml on the non-selective media plate count for each experiment. The cell counts with 50 ppm chlorine treatment were 0.5 log cfu/ml lower (P < 0.05, ANOVA, SAS v9.1) than that with 25 ppm exposure. The chlorine exposed E. coli O157:H7 was inoculated onto the ham surface, packed, vacuum sealed, then, incubated at 12˚C, 18˚C and 24˚C. The pH of the inoculum with 0, 25 and 50 ppm chlorine was 7.0 ± 0.2.
DMFit was applied to evaluate the growth/survival data to obtain lag time and growth rate of each experiment for secondary model development. All growth data fit the Baranyi model well with R2 ≥ 0.96. Based on the lag time and growth rate results with freezing shock, it can be concluded that there was no significant impact due to freezing stress (P > 0.05). Those data were combined with non-freezing shock data for model development. For modeling purpose, polynomial models are commonly used to describe or predict microbial lag phase and growth rate within ranges of selected parameters with proper experimental design. Cheroutre-Vialette and Lebert [20] reported the L. monocytogenes growth behavior with pH shock, osmotic shock (water activity) and their combination using several different types of models including polynomial models. Uljas et al. [21] used probabilistic models, which involved logistic regression and response surface models to describe or predict the E. coli O157:H7 population in apple cider with seven parameters. Pradhan et al. [22] developed a revised risk assessment, which took into account the L. monocytogenes contamination and growth of deli meats from production to consumer, with impact of lactate and diacetate on listeriosis cases and death. They further predicted that the human listeriosis cases caused by deli meats could be reduced by 2.5 to 7.8-fold with proper reformulation. Koutsoumanis and Angelidis [23] presented the “probabilistic modeling approach” to evaluate the compliance of RTE foods with new European Union safety criteria for L. monocytogenes. Their model system was based on: 1) growth/no growth boundary models, 2) kinetic growth models, 3) product characteristics data, and 4) storage temperature data—a more comprehensive approach for food safety evaluation. Risk assessment typically involves and integrates many different models in which the microbial growth and/or inactivation models are needed to attain the reliable results.
Lag time (LAG) and growth rate (GR) data from the experimental combinations were suitable for polynomial model development using the general linear regression procedures. Models developed for the LAG and GR are shown below in Equations (1) and (2), respectively.
LAG = 28.7980 + 3.0308CLO – 0.1501(T * CLO)
+ 0.0241CLO2 (1)
where LAG is the lag time in hours, T is temperature in ˚C; CLO is chlorine concentration in ppm. The R2 is 0.91 and the temperature factor in terms of T and T2 were not significant (P > 0.05) in the regression analyses.
GR0.5 = 0.1923 + 0.0084CLO − 0.0005 (T * CLO)
+ 0.0005T2 (2)
where GR is the growth rate in log cfu/hr and R2 = 0.87. The terms in T and CLO2 were not significant (P > 0.05). GR was expressed in a squared-root which can be easily compared with the results from the modified Ratkowskytype secondary model [24].
Although the polynomial equations may well describe the relationship among different parameters, the models typically were limited by the ranges of parameters applied in the experimental design. In the current study, temperatures at 12˚C - 24˚C and chlorine concentrations at 0 - 50 ppm were applied. Furthermore, polynomial models may include quadratic, cubic and quartic equations, in which the quadratic model was most commonly used. It is highly desirable to develop models which can cover a wider range of important factors for applications.
Another secondary model considered and tested for lag time is the hyperbola model, which was proposed by Zwietering et al. [25] and applied by Oscar [26] to predict the potential growth behavior of Salmonella typhimurium on cooked chicken. Sheen et al. [19] also applied the similar principles to model L. monocytogenes growth shocked with chlorine.
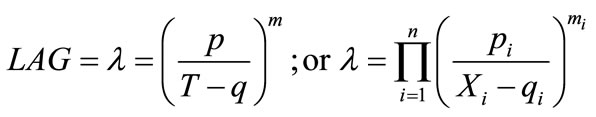 (3)
(3)
where, p is the rate of change of lag time as a function of temperature; q is the temperature at which lag time is infinite; and m is an exponent to be estimated. Other factors (in terms of Xi) may be integrated into the model (using Π operator) and a general multi-factor equation can be generated which also shown in Equation (3). However, this kind of model with applications is little investigated and may be applicable to certain conditions only. For current application, the model is constructed to take into account of both temperature and chlorine factors and shown as:
 (4)
(4)
Or,
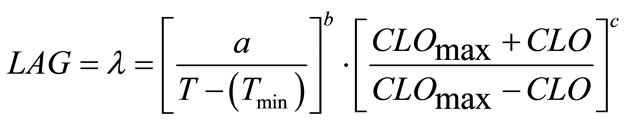 (5)
(5)
where, a, b and c are coefficients to be estimated. The temperature (T) and chlorine concentration (CLO) where E. coli O157:H7 has infinite lag time were set at 6˚C and 100 ppm, respectively. Rutala and Cole [27] reported the lowest concentration of chlorine that reliably inactivated bacteria in hospitals is 100 ppm. The non-linear regression analyses resulted in Equation (6) where, a = 799.301, b = 0.7516 and c = 1.2609:
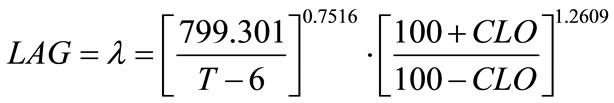 (6)
(6)
Statistical analyses showed F-value = 256.36; Pr > F (<0.0001); Sum of squared error/uncorrected total = 1937.8/101294.0. The R2 is typically not available for non-linear regression analysis. Coefficient “a” does not satisfy the definition set for “p” in Equation (3), which was not derived based on growth theory but relatively an empirical model. Therefore, “a” may only be treated as an unknown to be estimated as well as “b” and “c”. In Equation (5), if (100 + CLO) was replaced by a coefficient “k”, which became similar to temperature factor term, the non-linear regression result was found singular and failed to converge. The Tmin set to 4˚C or 5˚C was also tested, the regression showed similar statistical results.
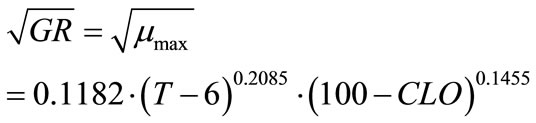
The secondary model for growth rate consideration was the square-root-type or Ratkowsky-type model [24, 28,29]. MeMeekin et al. [30] included the water activity term in the Ratkowsky-type model and Adams et al. [31] added the pH factor. The general expression (including temperature) is shown below:
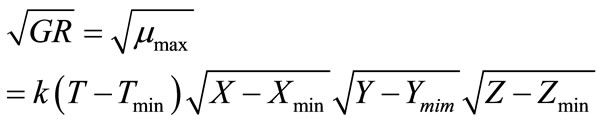 (7)
(7)
where, k is a coefficient to be determined and X, Y, Z can be water activity or pH or others. Tmin is the minimum growth temperature. Xmin (or Ymin, Zmin) is the minimum factor X (or Y, Z), e.g. pH, below which growth becomes not possible. A more general model expression was presented by Ross et al. [32] to include many other parameters. Equation (7) was analyzed in the current study and acceptable regression results were found not possible. Therefore, a slightly modified form was developed which is:
 (8)
(8)
where, k, g and h are coefficients to be determined. The non-linear regression results are:
 (9)
(9)
Statistical analyses showed F-value = 218.45; Pr > F (<0.0001); Sum of squared error/uncorrected total = 0.0553/2.4526.
Since Equation (7) was derived from the general observation of different microbial growth in various conditions, it might not fit all conditions which impact the growth curve. Huang [33] also reported that growth kinetics of Escherichia coli O157:H7 was better fit by Belehradek-type model (McMeekin et al. [34]) than by traditional Ratkowsky model. The author presented the model as μmax = k(T − Tmin)1.5, which can be converted to (μmax)1/2 = k1(T − Tmin)0.75. With more parameters involved, the model may become much complicated to achieve acceptable statistical analyses.
Figure 1 indicated that the LAG decreased with increase of temperature and decrease of shocked chlorine concentration. The 0 ppm also showed the growth data at control conditions of E. coli O157:H7 on ham surface, which might be further affected by ham composition. Although the LAG can be extended by the chlorine concentration, the higher temperature may offset the chlorine effect, e.g. the LAGs were about the same at 0 ppm chlorine at 12˚C and at 50 ppm chlorine at 24˚C abuse temperature. It is also interesting to note that the lag times were similar (between 50 and 60 h) at 25ppm chlorine concentration for all three temperatures. Figure 2 showed that the growth rate slightly increased with increase of chlorine ppm at 12˚C and 18˚C, but decreased with increase of chlorine at 24˚C. Unless the sanitization completely eliminated E. coli O157:H7 there exist the risk that microbes might survive and grow when environmental conditions become favorable. Figures 1 and 2 clearly show that it is difficult to predict the microbial survival behavior under stresses without experimental data support.
Two secondary types of models are presented in this study, i.e. the linear regression models and the empirical models based on observations and curve fitting. It is interesting to compare the models in terms of their predicted vs. experimental data. Figure 3 shows the comparison of linear regression models in which the solid line (slope = 1) indicates the predicted and observed values are equal. When the data points are above or below
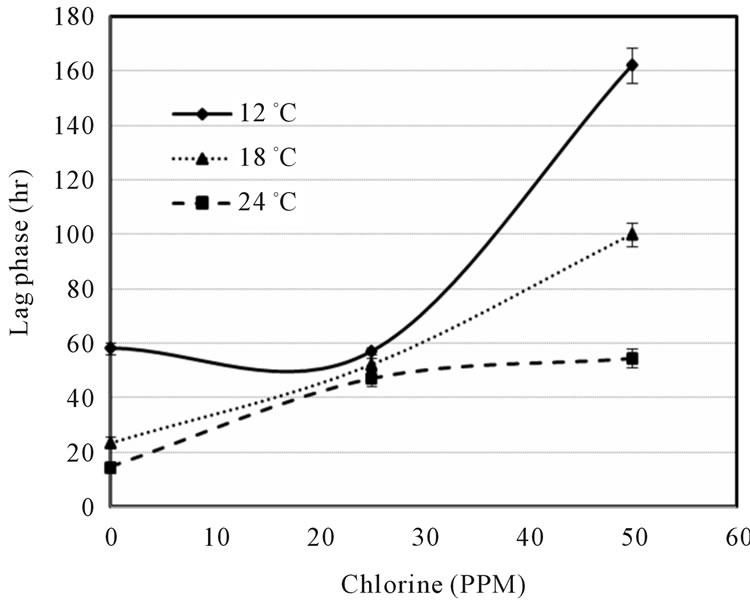
Figure 1. Lag phase vs. chlorine concentration (ppm) at three abuse temperatures.
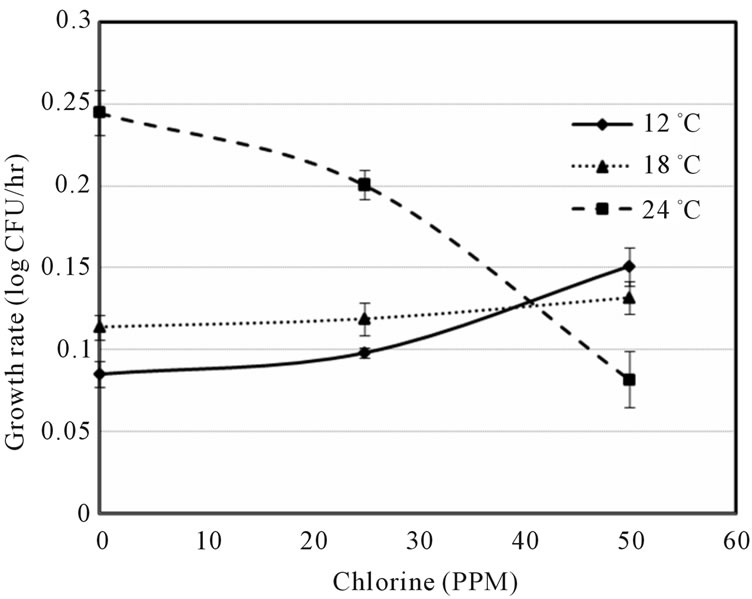
Figure 2. Growth rate vs. chlorine concentration (ppm) at three abuse temperatures.
the solid line, the predicted values are over or under estimated, respectively. Similarly, Figure 4 demonstrates the results of comparison between the Ratkowsky-type and Zwietering-type models. In Figure 4, The LAG data show a narrower 95% confident range than those from Figure 3, which indicates that the regression model may predict data closer to the experimental ones. However, the GRs in Figures 3 and 4 show the reverse trend where the linear regression model may perform better than Ratkowsky-type model.
Model performance in accuracy of prediction was evaluated using a 40 ppm chlorine shock (pH 7.1), then inoculated on ham and stored at 12˚C and 18˚C. The predicted LAG and GR (for 12˚C) from Equations (1), (2), (6) and (9) were 116.542, 0.1298, 115.0272 and 0.0971, respectively. The experimental data were 109.891 (for LAG) and 0.1228 (for GR). For 18˚C, predicted values were 80.518, 0.1091, 68.3198 and 0.1296, respectively, and the experimental data were 76.245 (LAG) and 0.1238 (GR). All developed models predicted the LAG and GR within 20% of the experimental values at both 12˚C and 18˚C. Another experiment was performed to evaluate the developed models outside the chlorine parameter range, i.e. chlorine shock at 60 ppm and 18˚C abused temperature. The experimental data resulted for LAG and GR were 125.323 h and 0.1254 log cfu/h, respectively. Equations (6) and (9) predicted the values of 134.804 h and 0.1152 log cfu/hr, which were within 10% range of the experiment data. However, Equations (1) and (2) showed the predicted values of 135.298 h (LAG) and 0.1013 log cfu/h (GR). It is generally agreed that the linear regression model with experimental design is only applicable within the designed parameter ranges. In the current case, Equations (1) and (2) were found suitable for applications with chlorine shock at 60 ppm. Since no
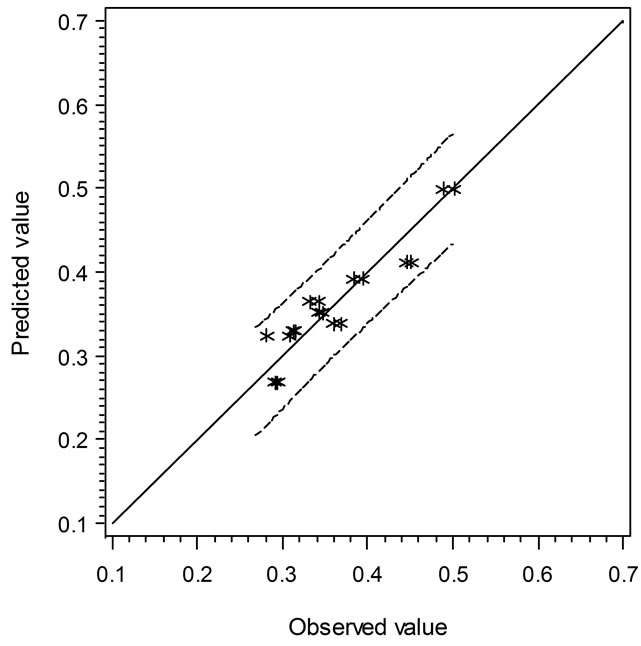
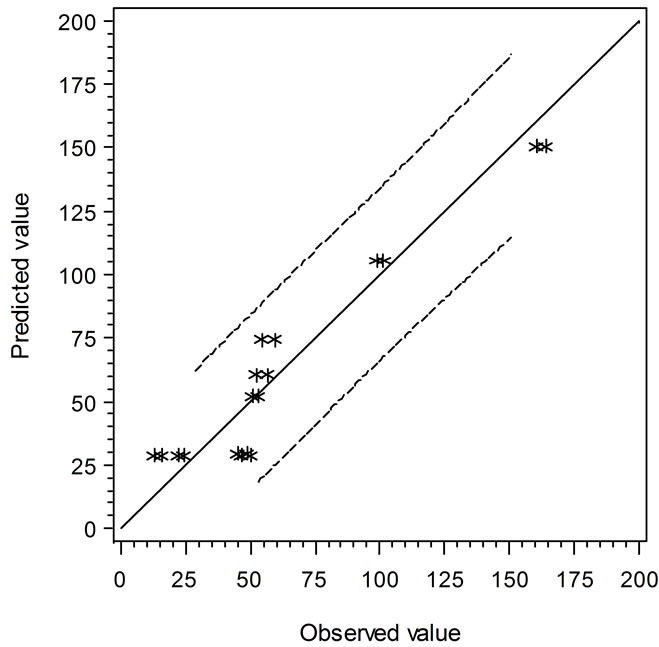
Figure 3. The predicted vs. observed values of LAG (top) and GR0.5 (bottom) using Equations (1) and (2), respectively.
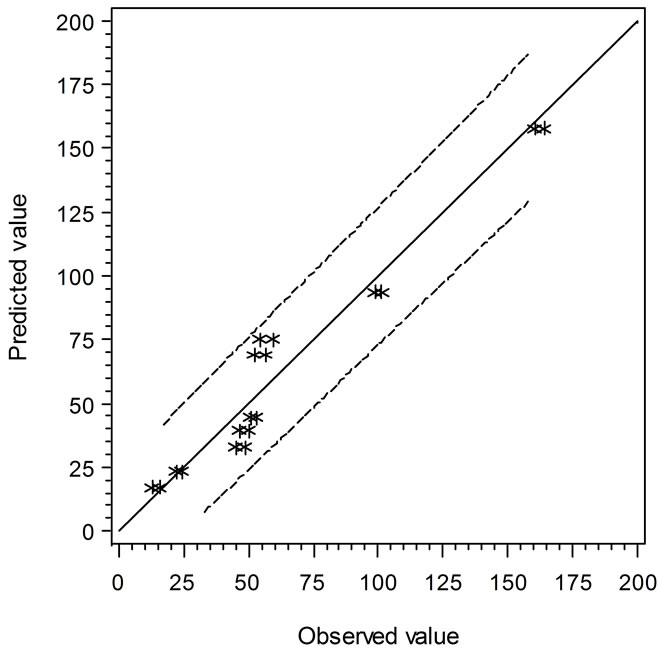
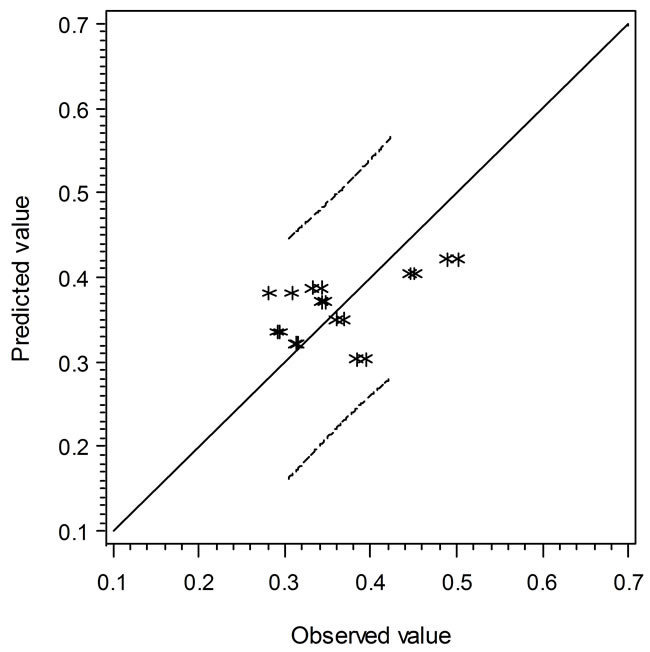
Figure 4. The predicted vs. observed values of LAG (top) and GR0.5 (bottom) using Equations (6) and (9), respectively.
reliable data with chlorine shock at 75 ppm were available, Equations (1) and (2) can not be further validated for wider range of chlorine concentration. General speaking, secondary models similar to modified Ratkowskytype and Zwietering-type might be more suitable for applications with broader parameter ranges.
4. Conclusion
This study provided useful results and information regarding the effects of chlorine concentration, abuse temperatures and freezing shock on the survival and growth behavior of E. coli O157:H7 in RTE meat. The freezing shock was found to have little impact on E. coli O157:H7 survival behavior in terms of lag time and growth rate. Two types of secondary models, as a function of chlorine concentration and abuse temperature, were developed and presented, i.e. the polynomial regression models, modified Ratkowsky-type and Zwietering-type models. The modified Ratkowsky-type and Zwietering-type models were applicable to a wider range of parameters, although the polynomial regression models were found suitable with chlorine at 60 ppm which is outside the parameter range. Those models may be used for risk assessment, within applicable conditions, to enhance the RTE meat safety.
5. Acknowledgements
The authors thank Dr. John Phillips for his assistance in the SAS program set-up and analyses, and recognize the dedicated laboratory work of Sonya Costa and Peggy Williamson of the Food Safety and Intervention Technologies Research Unit, ERRC/ARS/USDA, Wyndmoor, PA.
REFERENCES
- J. Tilden Jr., W. Young, A. M. McNamara, C. Custer, B. Boesel, M. A. Lambert-Fair, J. Majkowski, D. Vugia, S. B. Werner, J. Hollingsworth and J. G. J. Morris, “A New Route of Transmission for Escherichia coli: Infection from Dry Fermented Salami,” American Journal Public Health, Vol. 86, 1996, pp. 1142-1145. doi:10.2105/AJPH.86.8_Pt_1.1142
- E. coli Blog, “Surveillance & Analysis on E. coli News and Outbreaks,” 2011. http://www.ecoliblog.com/
- Centers for Disease Control and Prevention (CDC), “CDC Report 1 in 6 Get Sick from Foodborne Illnesses Each Year, New Estimates More Precise,” 2010. http://www.cdc.gov/media/pressrel/2010/r101215.html
- Foodborne Diseases Active Surveillance Network (FoodNet), “FoodNet Annual Report,” 2007. http://www.cdc.gov/foodnet/annual/2007/2007_annual_report_508.pdf
- P. D. Frenzen, A. Drake and F. J. Angulo, “Emerging Infections Program FoodNet Working Group: Economic Cost of Illness due to Escherichia coli O157 Infections in the United States,” Journal of Food Protection, Vol. 68, No. 12, 2005, pp. 2623-2630.
- E. W. Rice, R. M. Clark and C. H. Johnson, “Chlorine Inactivation of Escherichia coli O157:H7,” Emerging Infectious Diseases, Vol. 5, No. 3, 1999, pp. 461-463. doi:10.3201/eid0503.990322
- M. Sharma, G. M. Richards and L. R. Beuchat, “Escherichia coli O157:H7,” Center for Food Safety, University of Georgia, Griffin, 2004. http://www.ugacfs.org/research/pdfs/escherichiacoli1572004.pdf
- R. Virto, P. Maňas, I. Álvarez, S. Condon and J. Raso, “Membrane Damage and Microbial Inactivation by Chlorine in the Absence and Presence of a Chlorine-Demanding Substrate,” Applied Environmental Microbiology, Vol. 71, No. 9, 2005, pp. 5022-5028. doi:10.1128/AEM.71.9.5022-5028.2005
- P. J. Taormina and L. R. Beuchat, “Survival and Heat Resistance of Listeria monocytogenes after Exposure to Alkali and Chlorine,” Applied Environmental Microbiology, Vol. 67, No. 6, 2001, pp. 2555-2563. doi:10.1128/AEM.67.6.2555-2563.2001
- J. Samelis, J. N. Sofos, P. A. Kendall and G. C. Smith, “Survival or Growth of Escherichia coli O157:H7 in a Model System of Fresh Meat Decontamination Runoff Waste Fluid and Its Resistance to Subsequent Lactic Acid Stress,” Applied Environmental Microbiology, Vol. 71, No. 10, 2005, pp. 6228-6234. doi:10.1128/AEM.71.10.6228-6234.2005
- M. N. Wan Norhana, S. E. Poole, H. C. Deeth and G. A. Dykes, “The Effects of Temperature, Chlorine and Acids on the Survival of Listeria and Salmonella Strains Associated with Uncooked Shrimp Carapace and Cooked Shrimp Flesh,” Food Microbiology, Vol. 27, No. 2, 2010, pp. 250-256. doi:10.1016/j.fm.2009.10.008
- A. Rajkovic, N. Smigic, M. Uyttendaele, H. Medic, L. de Zutter and F. Devlieghere, “Resistance of Listeria monocytogenes, Escherichia coli O157:H7 and Campylobacter jejuni after Exposure to Repetitive Cycles of Mild Bactericidal Treatments,” Food Microbiology, Vol. 26, No. 8, 2009, pp. 889-895. doi:10.1016/j.fm.2009.06.006
- K. Aarnisalo, J. Lunden, H. Korkeala and G. Wirtanen, “Susceptibility of Listeria monocytogenes Strains to Disinfectants and Chlorinated Alkaline Cleaners at Cold Temperatures,” LWT—Food Science and Technology, Vol. 40, No. 6, 2007, pp. 1041-1048. doi:10.1016/j.lwt.2006.07.009
- Food Safety and Inspection Service (FSIS), “Fact Sheets: Meat Preparation—Ground Beef and Food Safety,” 2011. http://www.fsis.usda.gov/factsheets/fround_beef_and_food_safety/index.asp
- J. Bollman, A. Ismond and G. Blank, “Survival of Escherichia coli O157:H7 in Frozen Foods: Impact of the Cold Shock Response,” International Journal of Food Microbiology, Vol. 64, No. 1-2, 2001, pp. 127-138. doi:10.1016/S0168-1605(00)00463-3
- D. Grzadkowska and M. W. Griffiths, “Cryotolerance of Escherichia coli O157:H7 in Laboratory Media and Food,” Journal of Food Science, Vol. 66, No. 8, 2001, pp. 1169-1173. doi:10.1111/j.1365-2621.2001.tb16100.x
- T. Tasara and R. Stephan, “Cold Stress Tolerance of Listeria monocytogenes: A Review of Molecular Adaptive Mechanism and Food Safety Implications,” Journal of Food Protection, Vol. 69, No. 6, 2006, pp. 1473‑1484.
- J. Baranyi and T. A. Roberts, “A Dynamic Approach to Predicting Bacterial Growth in Food,” International Journal of Food Microbiology, Vol. 23, No. 3-4, 1994, pp. 277-294. doi:10.1016/0168-1605(94)90157-0
- S. Sheen, C. A. Hwang and V. K. Juneja, “Modeling the Impact of Chlorine on The Behavior of Listeria monocytogenes on Ready-to-Eat Meats,” Food Microbiology, Vol. 28, No. 5, 2011, pp. 1095-1100. doi:10.1016/j.fm.2011.01.001
- M. Cheroutre-Vialette and A. Lebert, “Growth of Listeria monocytogenes as a Function of Dynamic Environment at 10 C and Accuracy of Growth Predictions with Available Models,” Food Microbiology, Vol. 17, No. 1, 2000, pp. 83-92. doi:10.1006/fmic.1999.0290
- H. E. Uljas, D. W. Schaffner, S. Duffy, L. Zhao and T. C. Ingham, “Modeling of Combined Processing Steps for Reducing Escherichia coli O157:H7 Populations in Apple Cider,” Applied Environmental Microbiology, Vol. 67, No. 1, 2001, pp. 133-141. doi:10.1128/AEM.67.1.133-141.2001
- A. K. Pradhan, R. Ivanek, Y. T. Gröhn, I. Geornaras, J. N. Sofos and M. Wiedmann, “Quantitative Risk Assessment for Listeria monocytogenes in Selected Categories of Deli Meats: Impact of Lactate and Diacetate on Listeriosis Cases and Deaths,” Journal of Food Protection, Vol. 72, No. 5, 2009, pp. 978-989.
- K. Koutsoumanis and A. S. Angelidis, “Probabilistic Modeling Approach for Evaluating the Compliance of Ready-to-Eat Foods with New European Union Safety Criteria for Listeria monocytogenes,” Applied Environmental Microbiology, Vol. 73, No. 15, 2007, pp. 4996- 5004. doi:10.1128/AEM.00245-07
- D. A. Ratkowsky, R. K. Lowry, T. A. McMeekin, A. N. Stokes and R. E. Chandler, “Model for Bacterial Culture Growth Rate Throughout the Entire Biokinetic Temperature Range,” Journal Bacteriology, Vol. 154, No. 3, 1983, pp. 1222-1226.
- M. H. Zwietering, H. G. A. M. Cuppers, J. C. De Wit and K. van’t Riet, “Evaluation of Data Transformations and Validation of Models for the Effect of Temperature on Bacterial Growth,” Applied Environmental Microbiology, Vol. 60, No. 1, 1994, pp. 195-203.
- T. P. Oscar, “Development and Validation of a Tertiary Simulation Model for Predicting the Potential Growth of Salmonella typhimurium on Cooked Chicken,” International Journal of Food Microbiology, Vol. 76, No. 3, 2002, pp. 177-190. doi:10.1016/S0168-1605(02)00025-9
- W. A. Rutala, E. C. Cole, C. A. Thomann and D. J. Weber, “Stability and Bactericidal Activity of Chlorine Solution,” Infection Control Hospital Epidemiology, Vol. 19, No. 5, 1998, pp. 323-327. doi:10.1086/647822
- T. Wijtzes, F. M. Rombouts, M. L. Kant-Muermans, K. van’t Riet and M. Zwietering, “Development and Validation of a Combined Temperature, Water Activity, pH Model for Bacterial Growth Rate of Lactobacillus curvatus,” International Journal of Food Microbiology, Vol. 63, No. 1-2, 2001, pp. 57-64. doi:10.1016/S0168-1605(00)00401-3
- T. Ross and P. Dalgaard, “Secondary Models,” In: R. C. McKellar and X. Lu, Eds., Modeling Microbial Responses in Food, CRC Press, New York, 2004.
- T. A. McMeekin, R. E. Chandler, P. E. Doc, C. D. Garland, J. Olley, S. Putro and D. A. Ratkowsky, “Model for the Combined Effect of Temperature and Salt Concentration/Water Activity on Growth Rate of Staphylococcus xylosus,” Journal of Applied Bacteriology, Vol. 62, No. 6, 1987, pp. 543-550. doi:10.1111/j.1365-2672.1987.tb02687.x
- M. R. Adams, C. L. Little and M. C. Easter, “Modelling the Effect of pH, Acidulant and Temperature on Growth of Yersinia enterocolitica,” Journal of Applied Bacteriology, Vol. 71, No. 1, 1991, pp. 65-71.
- T. Ross, D. A. Ratkowsky, L. A. Mellefont and T. A. McMeekin, “Modelling the Effects of Temperature, Water Activity, pH and Lactic Acid Concentration on the Growth Rate of Escherichia coli,” International Journal of Food Microbiology, Vol. 82, No. 1, 2003, pp. 33-43. doi:10.1016/S0168-1605(02)00252-0
- L. Huang, “Growth Kinetics of Escherichia coli O157:H7 in Mechanically-Tenderized Beef,” International Journal of Food Microbiology, Vol. 140, No. 1, 2010, pp. 40-48. doi:10.1016/j.ijfoodmicro.2010.02.013
- T. A. McMeekin, J. N. Olley, T. Ross and D. A. Ratkowsky, “Predictive Microbiology: Theory and Application,” Research Studies Press Ltd., Taunton, 1993.
NOTES
*Mention of trade names or commercial products in this publication is solely for the purpose of providing specific information and does not imply recommendation or endorsement by the US Department of Agriculture.
#Corresponding author.