American Journal of Plant Sciences
Vol.5 No.5(2014), Article ID:43674,12 pages DOI:10.4236/ajps.2014.55080
Distribution Profiles and Interrelations of Stomatal Conductance, Transpiration Rate and Water Dynamics in Young Maize Laminas under Nitrogen Deprivation
Dimitris L. Bouranis*, Alexandros Dionias, Styliani N. Chorianopoulou, Georgios Liakopoulos, Dimosthenis Nikolopoulos
Plant Physiology Laboratory, Department of Crop Science, Agricultural University of Athens, Athens, Greece
Email: *bouranis@aua.gr
Copyright © 2014 by authors and Scientific Research Publishing Inc.
This work is licensed under the Creative Commons Attribution International License (CC BY).
http://creativecommons.org/licenses/by/4.0/


Received 30 December 2013; revised 15 February 2014; accepted 2 March 2014
ABSTRACT
Seven-day-old maize (Zea mays) plants were grown hydroponically for ten days in N-deprived nutrient solution. The distribution profiles according to the position on the stem of the –N laminas stomatal conductance, transpiration rate, photosynthetic rate (1st-group) were monitored, along with the corresponding profiles of dry mass, water amount, water content, length, surface area, and specific surface area (2nd-group), relative to control. In the uppermost –N laminas, the changes within a parameter of the 1st-group were significantly higher and of the 2nd-group significantly lower than the control, respectively. Correlations of the corresponding values among the parameters of the 1st- or 2nd-group were linear. The parameters between groups correlated non-linearly. Transpiration rate was divided by the lamina’s dry mass correlated with surface area in a power-type function. The slopes of the response ratios linear relations between the various pairs of parameters could be used for simulation of a lamina’s response to the deprivation.
Keywords:N-Deprivation; Hydroponics; Zea mays; Stomatal Conductance; Transpiration Rate; Photosynthetic Rate; Response Ratios

1. Introduction
The exchange of gases by a plant is regulated by the opening and closing of stomata. Transpiration through stomata accounts for most of the water loss from the plant. Among other functions, transpiration enables mass flow of mineral nutrients and water from roots to shoots. Apart from transpirational water loss (E), stomatal aperture regulates gas exchange, and eventually photosynthetic rate (A). The decrease of A in plants via hydraulic or hormonal signals is an indirect mode of action of nutrients on photosynthesis [1] . Effects of N-deficiency on plant’s stomatal behaviour, hydraulic performance and water relations have been described; nitrate deficiency can induce stomatal closure and can cause reductions in leaf growth rates [2] -[5] . The deprivation produces signal (or a combination of various signals) carrying information with regard to soil nutrient levels; then the signal is transferred from the roots to the stomata of the growing leaves. Nitrate controls the function of aquaporins, which in turn has an impact on root hydraulic conductance. It has been proven that N-deficiency results in major reductions of root hydraulic conductivity, a fact which may lead to lower stomatal conductance (gs). Whether stomatal closure and diminished hydraulic conductivity are the primary effects of nutrient-stress response has been discussed [6] . Nutrient deficiency can also regulate gs via the supply alteration of guard cells with rootor leaf-sourced hormones, such as abscisic acid and cytokinines. The stomatal closure procedure includes ABA action. Evidence has been provided that the effects of nitrate on transpiration and growth are mediated by pH-based ABA redistribution [7] . N-deficiency affects plant metabolism and plants adjust their metabolism to its supply. A scheme combining current knowledge about the effects of N on metabolism has been provided [8] ; especially, the effect of N-deficiency on ABA in maize plant parts at various developmental stages has been reported [9] . The hormonal signals affect stomatal conductance and therefore the lamina’s gas exchange.
In a previous work, the fluctuations of the laminas mean stomatal conductance, transpiration rate, and photosynthetic rate, along with the fluctuations on the laminas total dry mass, water amount, length and surface area, as well as their responses to nitrate deprivation have been reported [10] . The approach focused on the time series analysis of the response ratios (Rr), i.e. the –N value divided by the corresponding control’s one at a given day, of these parameters. Under nitrate deprivation, all Rr time courses but the photosynthetic rate included early deviations from the control zone without recovery. The “control zone” represented the range 0.85 - 1.15; the points outside it indicated the existence of statistically significant fluctuations due to the deprivation. The deviations from the control zone appeared at day 4.
In young maize plants, the growing point atop an unelongated stem, i.e. the crown, produces leaves each of which is differentiated into the lower portion, the sheath, tightly folded around the main axis of the shoot for a distance, and the upper portion, the lamina, which is relatively flat and extents outward at an angle from the sheath. The positional distribution of the laminas on the stem also incorporates age distribution. In this follow-up study, we aimed at comparatively monitoring the impact of N-deprivation on stomatal conductance, transpiration rate, photosynthetic rate, and maximum (intrinsic) quantum yield of PSII photochemistry (Fv/Fm) of each lamina according to its position on the stem in young maize plants under N-deprivation, during early leaf growth. To this end, seven-day-old maize plants were grown hydroponically for ten days in N-deprived nutrient solutions against the corresponding experiment under full nutrition. The corresponding distribution profiles of water amount, dry mass, water content, length, surface area, and specific surface area according to the position of the N-deprived maize laminas on the stem were also monitored. The following questions were addressed by this work: 1) How does each of these physiological parameters respond to the deprivation relative to leaf position? and 2) Could any interrelations between the aforementioned parameters be identified during the onset of N-deficiency that may be used to simulate the early plant responses to nutrient stress?
2. Materials and Methods
2.1. Plant Material and Hydroponics Set up
Maize (Zea mays ‘Cisko’, Syngenta Hellas) seeds were kept on wet filter paper, in the dark (28˚C, relative humidity 76%) until germination. Four days later, the most uniform plants were selected and maintained in a hydroponic batch culture for 3 days in well-aerated distilled H2O. A controlled environment of 170 μmol photons m−2·s−1 PPFD and a 14-h light photoperiod with day/night growth conditions at shoot base 28/23˚C and RH 36/40% was used. Complete nutrient solution (control) contained 5 mM ΚΝΟ3, 1 mM KH2PO4, 2 mM Mg(NO3)2, 2.5 mM CaSO4, 1 mM MgSO4, 0.07 mM EDTA FeNa, 4 mM Ca(NO3)2, 0.9 μM ZnCl2, 30 μM H3BO3, 0.9 μM CuCl2, 0.5 μM MoO3 and 20 μM MnCl2. For the preparation of the N-deprived nutrient solution (–N) nitrate was replaced by sulfate as a compensatory anion and the pH was adjusted to that of the control (pH = 5.4). At d7 and for the next 10 days, hydroponic batch cultures were run using the respective nutrient solutions. All nutrient solutions were constantly aerated, being replaced every 3 days.
2.2. Measurements
Stomatal conductance (mol H2O m−2·s−1), transpiration rate (mmol H2O m−2·s−1) and photosynthetic rate (μmol CO2 m−2·s−1) were measured by means of the LCPro + (ADC BioScientific Ltd) instrument. A photograph of each lamina was taken and by means of image-J software the length, as well as the surface area of the lamina were calculated. Chlorophyll fluorescence kinetics was recorded using a PAM chlorophyll fluorometer (PAM-2100, Walz GmbH, Effeltrich, Germany). The illumination and recording of the chlorophyll fluorescence kinetics were conducted from the adaxial lamina side. Prior to recording fast chlorophyll fluorescence kinetics, samples were darkened for 30 min using dark leaf clips. After adaptation in the dark, the PAM measuring light (650 nm; PFD < 0.15 μmol quanta m–2·s–1; kept steady during all experiments) was turned on to determine the minimal fluorescence levels in the dark-adapted state (Fo). Subsequently, a 0.8 s saturation pulse (ca. PFD 15,000 μmol quanta m–2·s–1) was applied for the recording of the maximal fluorescence levels in the dark-adapted state (Fm). Maximum (intrinsic) quantum yield of PSII photochemistry was calculated as ΦPSIIo = Fv/Fm, where Fv = Fm – Fo [11] . Fresh weight of every lamina per each experimental day was recorded, the plant material was oven-dried at 80˚C, and the dry weight was recorded. Water amount per lamina, water content and specific area were then calculated.
2.3. Statistical Analysis
Each experiment was performed in triplicate. Analysis of variance between the corresponding –N and control values was performed to study the effect of the N-deprivation on each parameter. Tukey’s Honestly Significant Difference procedure was used for controlling the Type I error rate when making multiple pairwise comparisons as follow-ups to a significant omnibus F test. Quantile-quantile plots of the ANOVA model residuals and the Shapiro-Wilk test were used to check the assumption of normality at 5% level. Bartlett’s test was used to check the assumption of homogeneity of variances between the treatments at 5% level. Nοne of the tests revealed any violations of the assumptions of normality and homogeneity of variances at 5% level within each treatment. All analyses were implemented using the language and environment for statistical computation R.
In the cases where the differences between means of C and the treatment values were statistically significant, the response ratio (i.e. the ratio of the –N value divided by the corresponding control value within each day and position on the stem) was calculated. Values outside the range 0.85 - 1.15 were found to be statistically significant responses. The impact of N-deprivation on the examined parameters relative to time and to leaf position is summarized in Tables 1-3.
2.4. Abbreviations
Li: the lamina of a leaf at the ith position on the stem; L0: the embryonic leaf’s lamina; di: the ith day of treatment; d0: day 7 from sowing; gs: stomatal conductance; E: transpiration rate; A: photosynthetic rate; DM: dry mass; W: water amount; Wc: water content; Sa: surface area; spSa: specific surface area, L: length; Rr: response ratio.
3. Results
Nitrogen deprivation caused a delay in the emergence of the third lamina, whilst no additional leaves were produced during the ten-day-deprivation period; in the control plants a total of five leaves were developed during the same period. The embryonic lamina was in senescence at d8, whilst no other laminas were found to senesce.
N-deprivation affected stomatal conductance of each lamina in a differential fashion. Relative to leaf position a negative impact on gs (i.e. lower –N values than the control ones) was located in the lower laminas; the uppermost lamina presented positive (i.e. higher –N values than control) or no impact. In fact, the uppermost lamina presented increased values due to deprivation already from d2. Relative to time the embryonic lamina (L0) showed the first negative impact on gs at d4; L1 at d6 and L2 at d10. In contrast, L3 presented increased gs during the time course (Figure 1, Table 1).
The impact of N-deprivation on the laminas transpiration rate was as that on stomatal conductance. Relative to leaf position negative impact on E was found in the lower laminas; the uppermost lamina showed no impact

Table 1. Time course of the response ratios (i.e. the ratio of the -N value divided by the corresponding control value within each experimental day) distribution profiles of the laminas stomatal conductance, transpiration rate and photosynthetic rate. “ns” indicates statistically non-significant response ratios, and the dash a non-functional leaf.
Table 2. Time course of the response ratios (i.e. the ratio of the -N value divided by the corresponding control value within each experimental day) distribution profiles of the laminas chlorophyll fluorescence. “ns” indicates statistically non-significant response ratios.
up to d6 and then a positive one. Relative to time L0 showed the first negative impact on E at d4; L1 at d6 and L2 at d8. In contrast, L3 presented increased E during the time course (Figure 1, Table 1).
The impact of N-deprivation on the laminas photosynthetic rate was similar to that on stomatal conductance, too. Relative to leaf position negative impact in A was found in the lower laminas; whilst the uppermost lamina showed no impact up to d4 and then a positive one. Relative to time L0 showed the first negative impact on A at d4 and L1 at d6. In contrast to its gs and E, the A of the 2nd lamina was found to be increased occasionally at d6, not affected later on. L3 presented increased A during the time course (Figure 1, Table 1).
Table 3. Time course of the response ratios (i.e. the ratio of the -N value divided by the corresponding control value within each experimental day) distribution profiles of the laminas water amount, dry mass, water content, length, surface area, and specific surface area,. “ns” indicates statistically non-significant response ratios.
With regard to photochemical efficiency of PSII, no statistically significant differences due to N-deprivation were found the first six days. Afterwards, increased photochemical efficiency of PSII was found in the base of the uppermost –N lamina at d8 and a decreased one in the middle and upper part of L1 at d10 under the deprivation (Table 2).
No alterations in water amount per lamina of N-deprived plants were observed at d2. Thereafter, the uppermost lamina presented less water amount with respect to plants under normal nutrition and a gradient of negative impact on water amount was developing from the middle position up. At d10, the gradient of changes in the water amount appeared in all laminas; the higher the lamina’s position the less its water amount (Figure 2, Table 3). At this day, the embryonic leaf was dry, non-functional already from d8 (Table 2).
No differences in laminas dry mass were observed at d2 due to N-deprivation. A negative impact on the uppermost lamina’s dry mass was apparent from d4 onwards. A temporary positive impact on the L0 and L1 was observed at d6 only; otherwise the N-deprivation did not cause statistically significant differences on the laminas dry mass (Figure 2, Table 3).
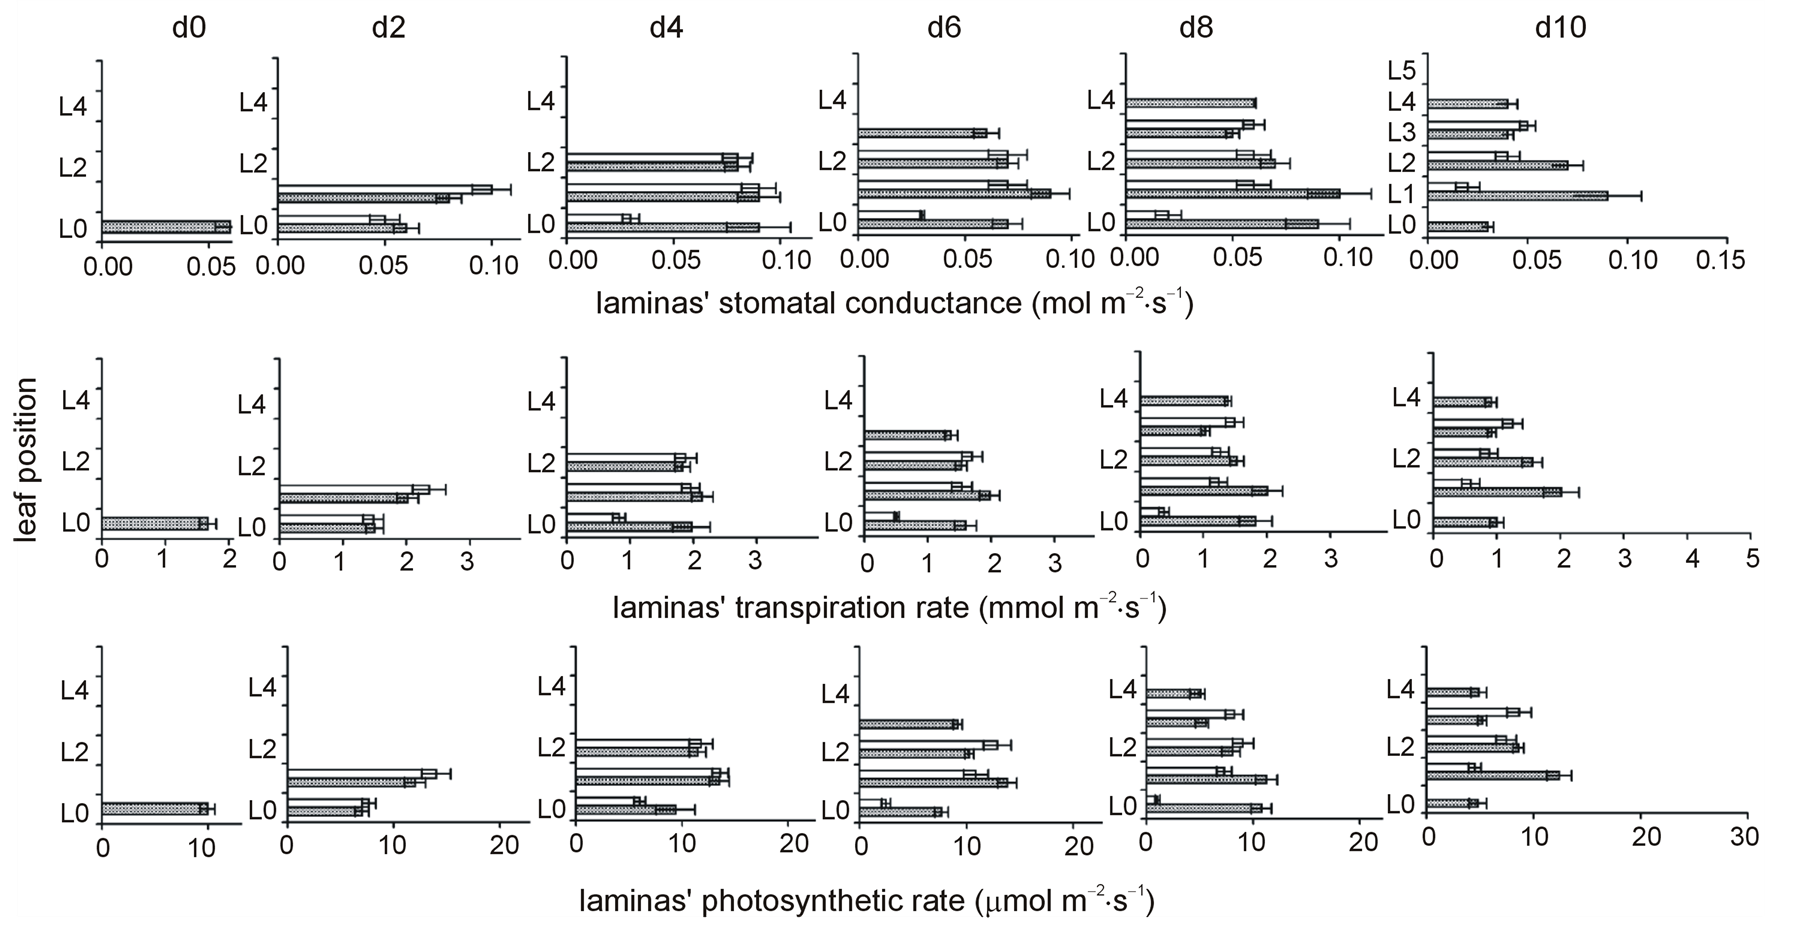
Figure 1. The time course of N-deprivation’s effect on the distribution profiles of laminas’ stomatal conductance, transpiration rate, and photosynthetic rate. Grey bars: plants in full nutrition, white bars: N-deprived plants, d0: seven-day-old maize plants. Error bars represent standard error.
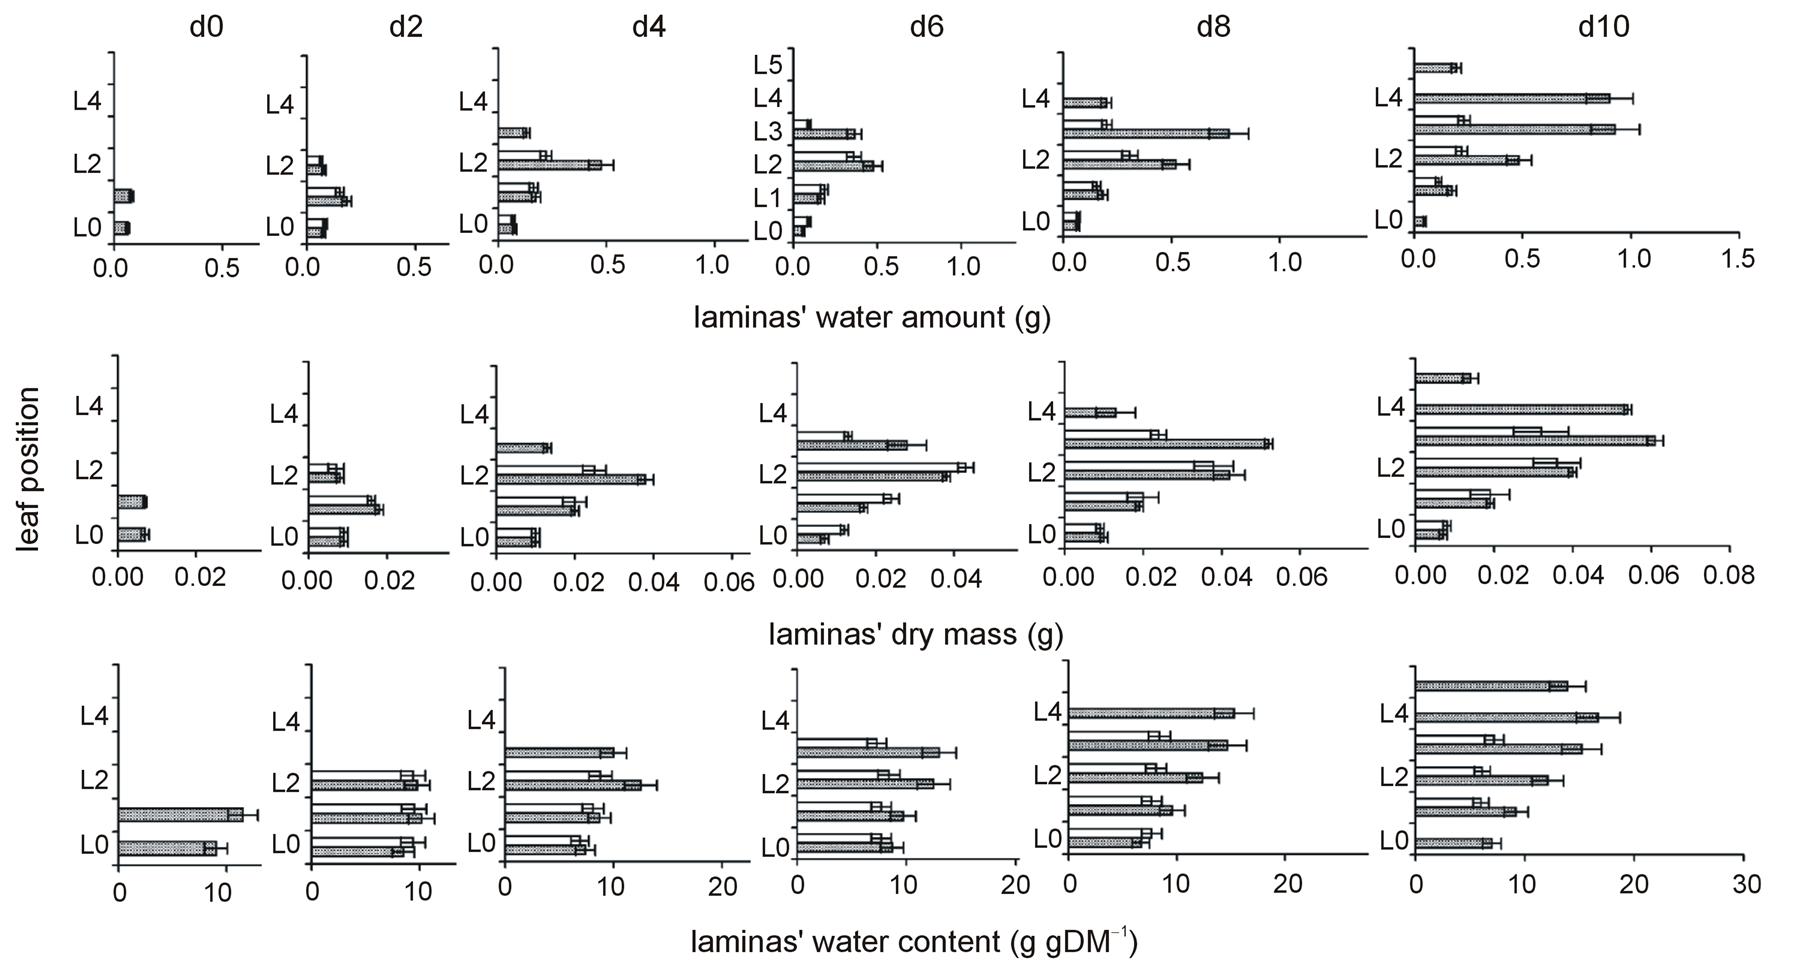
Figure 2. The time course of N-deprivation’s effect on the distribution profiles of laminas’ water amount, dry mass, and water content. Grey bars: plants in full nutrition, white bars: N-deprived plants, d0: seven-day-old maize plants. Error bars represent standard error.
No differences in laminas water content were observed at d2 due to N-deprivation. Water content was reduced in the uppermost lamina at d4; after d4, all laminas but the embryonic one presented reduced water content. The reduction of water content due to N-deprivation was more intense in younger (upper) leaves than older (lower) ones. This gradient was maintained up to d8 and eventually became steeper at d10 (Figure 2, Table 3).
The length of the uppermost lamina only was found to be reduced due to N-deprivation from d4 onwards (Figure 3, Table 3).
With regard to the laminas surface area, the upper lamina presented a reduced surface area from the beginning of the deprivation. A temporary positive impact on the L0 and L1 was observed at d6 only; otherwise the N-deprivation did not cause statistically significant differences on the laminas’ surface area. At d10, the surface area of the not functional embryonic lamina was half that of the control plants (Figure 3, Table 3).
The specific surface area of the uppermost lamina, in parallel to the embryonic one, were both reduced due to the deprivation from d6 onwards; this held also true for the lamina below the uppermost one at d10 (Figure 3, Table 3). The impact of the deprivation on the embryonic lamina increased after d6.
4. Discussion
An analysis of the kinetics of several key physiological parameters of maize plants during the onset of N-deficiency has been conducted in order to elucidate how stomatal conductance, transpiration rate and water dynamics are distributed relative to lamina position in response to this nutrient stress. Focusing on the initial effects, stomatal conductance was the only physiological parameter among the studied ones that responded to the N-deprivation at d2, whilst the surface area was the only responding morphometric parameter at d2, too. Day 4 under nitrate deprivation was a notable time point because the distribution profiles of the studied parameters were differentiated after that day. The presented distribution profiles could be distinguished into two groups based on whether and how the profile of each parameter was differentiated after day 4 under N-deprivation. Stomatal conductance, transpiration rate, and photosynthetic rate constituted a group of parameters in which the negative impact (with response ratio values lower than 1) due to deprivation was located in the lower laminas (1st group). Positive impact (with response ratio values greater than 1) was presented in the uppermost lamina only (Table 1). In contrast, the negative impact in water amount, dry mass, water content, length and surface area (the 2nd group of parameters) due to N-deprivation was located in the uppermost lamina (Table 3). In the case of water amount or water content the negative impact was extended in several upper laminas, not only in the uppermost one. Any positive impact within the 2nd group was found in the lower lamina and only during d6. Although the experiments were performed in hydroponics, the water amount of the upper leaves was significantly reduced by N-deprivation. This reduction was combined with a retardation in the appearance of new leaves. The impact of N-deprivation on the laminas’ water content followed the same pattern with that of lamina water amount, although to a lighter degree. Based on the spatiotemporal gradients of the water content’s response ratios (Table 3) and the corresponding ones of the laminas’ stomatal conductance and traspiration rate response ratios (Table 1), the interaction between the nitrate deprivation and the water status of plants was remarkable.
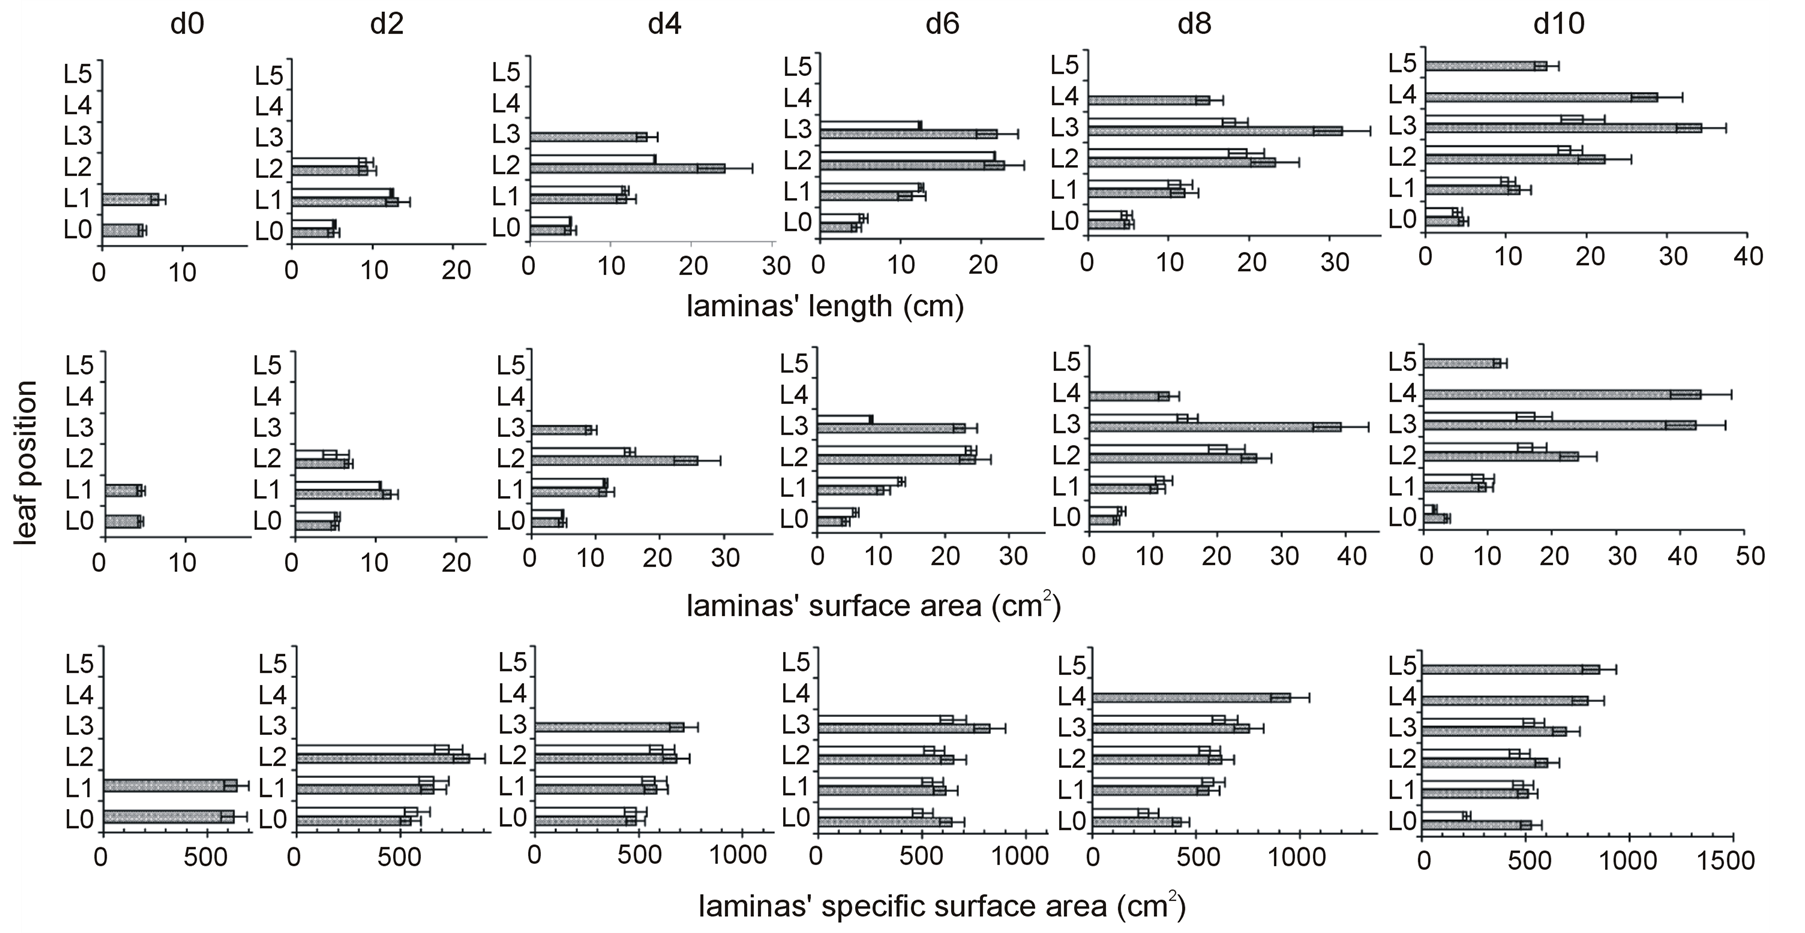
Figure 3. The time course of N-deprivation’s effect on the distribution profiles of laminas length, surface area, and specific surface area. Grey bars: plants in full nutrition, white bars: N-deprived plants, d0: seven-day-old maize plants. Error bars represent standard error.
The integration of the nutrient status with the water status constitutes a crucial aspect of plants’ response to various deficiencies. Plants respond by closing the stomata and by reducing lamina expansion, in order to conserve the required for their survival water, carbohydrates and nutrients. Transpiration and photosynthesis are closely intertwined and interconnected. Plants optimize their water use efficiency, which is achieved by adjusting the photosynthesis rate relative to that of transpiration [12] through tight control of water loss from stomata. C4 photosynthesis in the case of maize is a trait that reduces water consumption.
When nitrate supply is limited the stomata close regardless of soil water availability; leaves grow more slowly and root growth is maintained, being characterized often by greater lateral root proliferation. The aforementioned responses are also responses to water stress [13] . Regulation of transpiration by nitrate may be accomplished by the concerted regulation of root hydraulic conductivity through control of aquaporins, and of stomatal conductance through NO, hormone action and pH [14] . It has been demonstrated [15] that there is interaction between nitrate concentration in the nutrient solution and root hydraulic properties. This interaction adjusts water uptake and the link between resoursce availability and the hydraulic adjustments provides appropriate dynamic responses at the whole plant level. Responses to N-deprivation are mediated by root-to-shoot or shoot-to-root chemical signals; however N-deprivation results in a significant inhibition of water transport [16] . Abscisic acid (ABA) in low nitrate-grown barley was only increased in the xylem and not in the leaves [17] . Low nitrate availability may modulate responses in the shoot via a sensitization of stomatal and/or leaf growth receptors to ABA. N deficiency can both enhance stomatal sensitivity to an ABA signal, whereas N-deficiency does not always lead to increases in lamina ABA concentration [18] .
Correlations between the corresponding values of stomatal conductance and transpiration rate (Figure 4(a)), transpiration rate and photosynthetic rate (Figure 4(c)), as well as stomatal conductance and photosynthetic rate

Figure 4. Correlations between the corresponding values of various pairs of parameters of the 1st group. Laminas stomatal conductance (gs; mol m−2·s−1), transpiration rate (E; mmol m−2·s−1), photosynthetic rate (A; μmol m−2·s−1). Closed circles and solid lines: plants in full nutrition; open circles and dashed lines: plants under N-deprivation. “Rr” after the parameter’s symbol indicates the parameter’s response ratio value due to N-deprivation.
(Figure 4(e)), revealed strong positive linear relationships in both the control and N-deficient plants. Correlations between dry mass and water amount (Figure 5(a)) or surface area (Figure 5(c)) or length (Figure 5(e)) revealed strong positive linear relationships, too, in both the control and N-deficient plants. Correlations between water amount and water content, or between surface area and specific surface area exhibited poor linear relationships in both the control and N-deficient plants (Table 4). In contrast, correlations between the parameter of one group and a parameter of the other one were non-linear. As an example, the correlation between the laminas dry mass and the transpiration rate (Figure 6(a)) was approached by a polynomial fit of 3rd order.
In plants under full nutrition, the maximum value of the parameter was obtained when dry mass of the lamina was around 0.02 g per lamina; in –N laminas there was hardly any relationship. Transpiration rate per lamina (E·Sa) produced an adequate correlation with lamina’s dry mass (Figure 6(c)) fitted by a power-type function (Table 4). Furthermore, the correlation between the lamina’s surface area and lamina’s transpiration rate divided by the corresponding dry mass value (E/DM) was satisfactorily fitted by a power-type function (Figure 6(e), Table 4).
Table 4. Summary of r2 values, mean slopes, and trend line equations of the correlations presented in the corresponding Figures.
Correlating the response ratios of a parameter to the corresponding ones of another parameter within the same group, linear relationships with positive slope were also obtained. Negative slopes were found when correlating response ratios of parameters between the two groups. The relationship between the corresponding response ratios of E/DM against DM produced a poor linear fit (Figure 6(d)). In each linear relationship, the mean slope was calculated and the results are summarized in Table 4.
5. Conclusion
The spatiotemporal gradients of the response ratios produced by the nitrate deprivation were strongly interrelated. The mean slope for correlations not presented in the figures, can be derived by using a combination of the given mean slopes. With the presented set of tools at hand, by measuring for example a lamina’s traspiration rate and its surface area, we can simulate with acceptable approximation the values of any other of this set of parameters, thus simulating the impact of N-deprivation on another lamina at a given position on the stem and time. By measuring the lamina’s surface area and determining its dry mass, we can estimate its transpiration rate, and then all the other parameters, within the experimental period and maize cultivar tested.
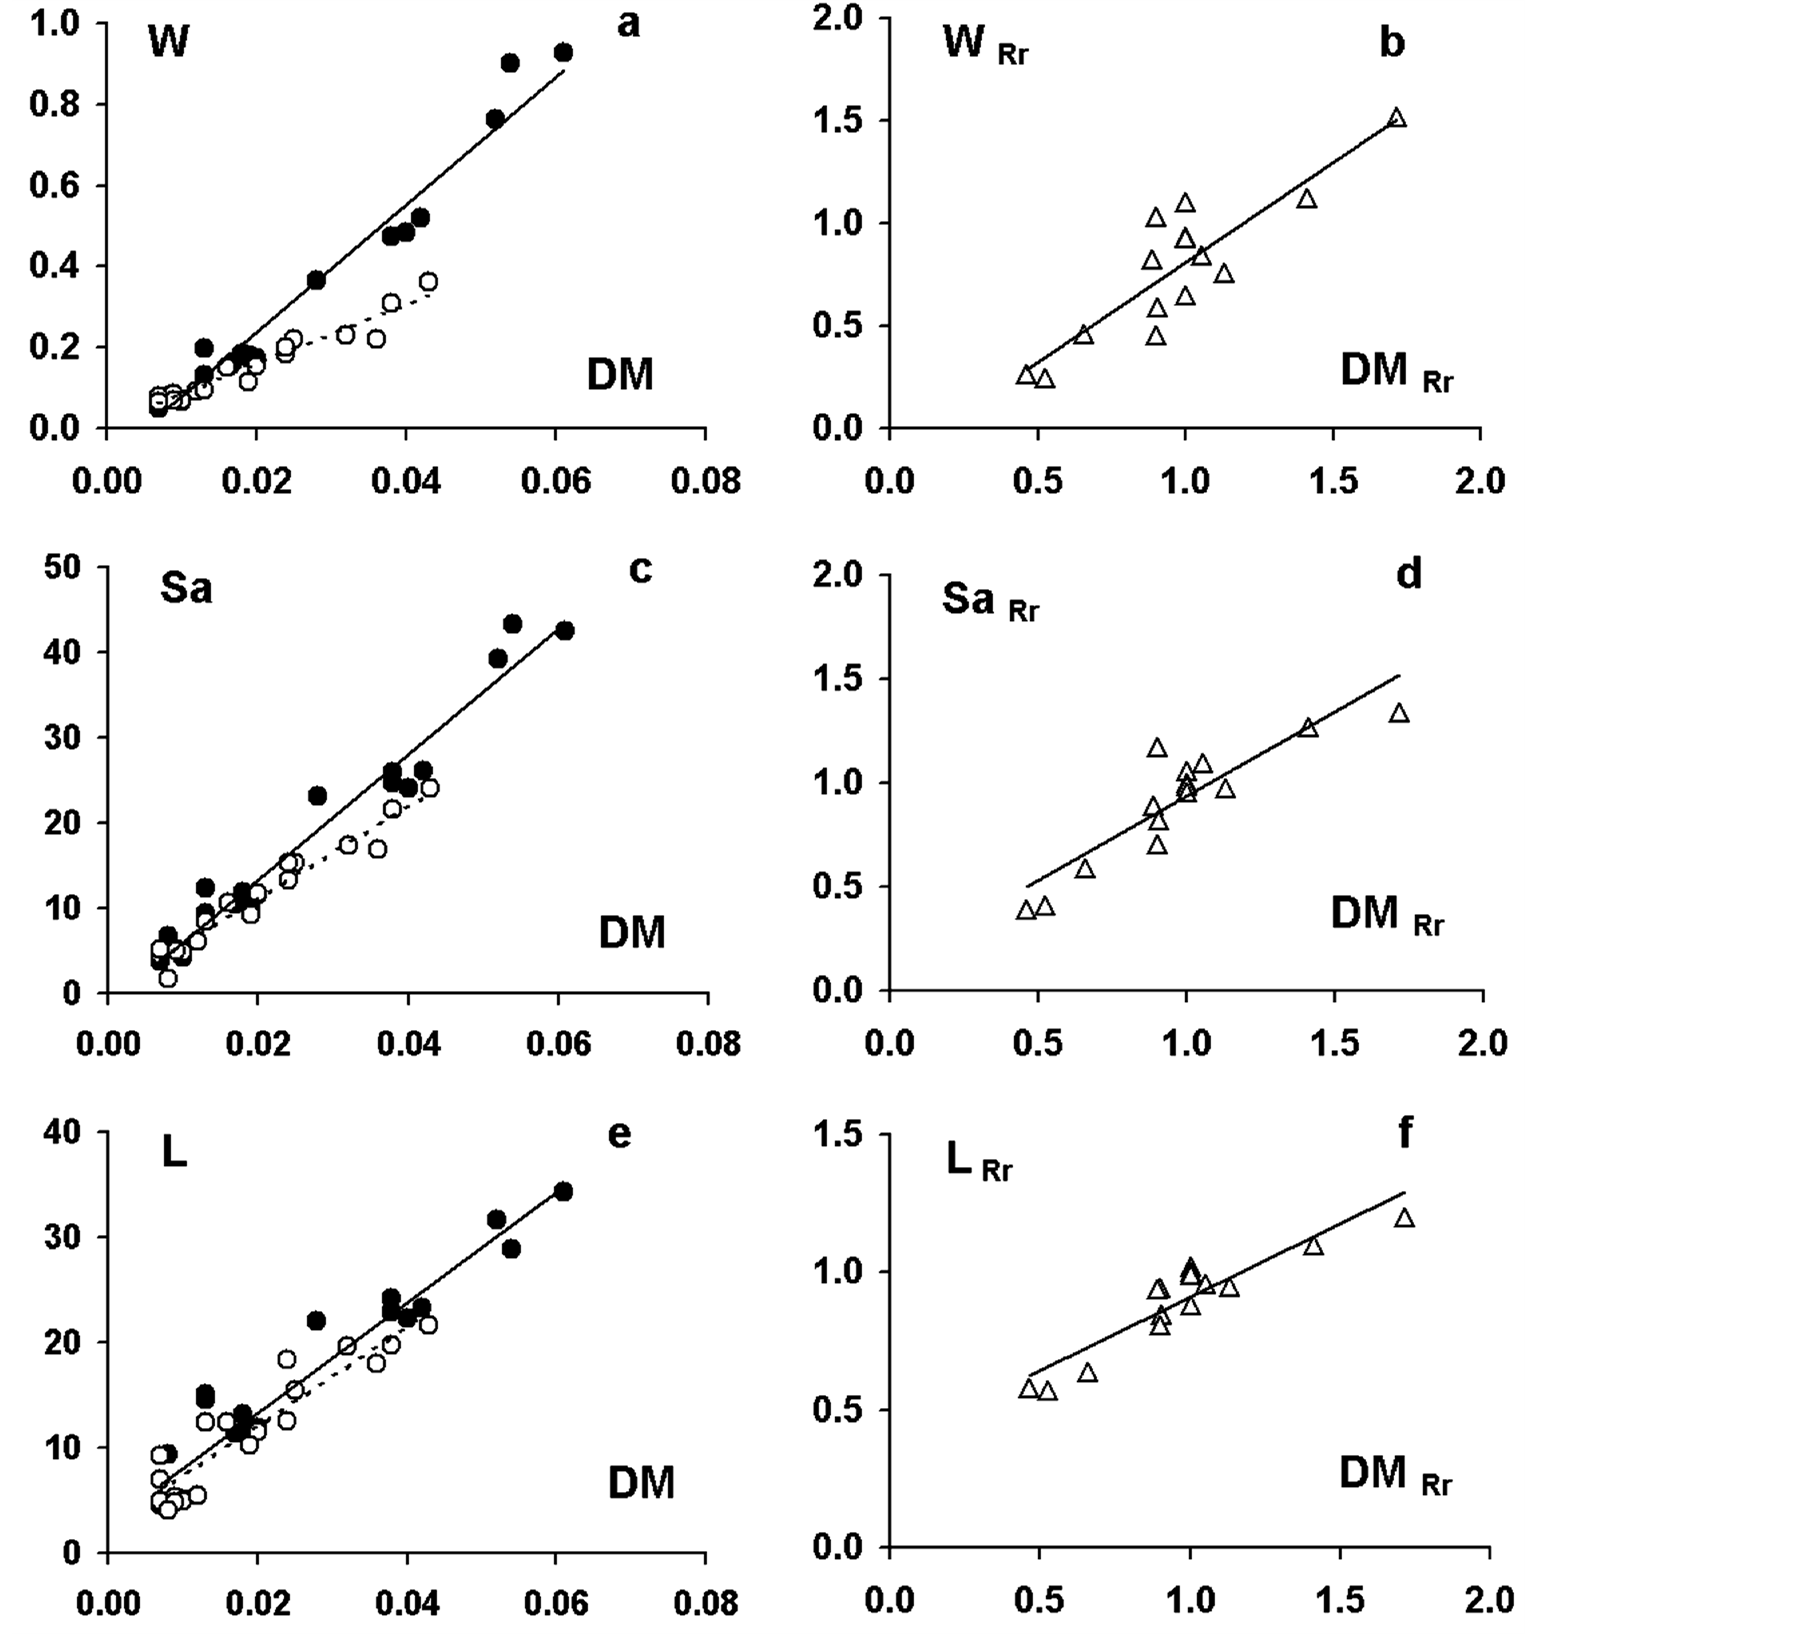
Figure 5. Correlations between the corresponding values of various pairs of parameters of the 2nd group. Dry mass (DM; g), water amount (W; g), surface area (Sa; cm2) and length (L; cm). Closed circles and solid lines: plants in full nutrition; open circles and dashed lines: plants under N-deprivation. “Rr” after the parameter’s symbol indicates the parameter’s response ratio value due to N-deprivation.

Figure 6. Correlations between the corresponding values of various pairs of parameters among the two groups. transpiration rate (E; mmol m−2·s−1), dry mass (DM; g), surface area (Sa; cm2). Closed circles and solid lines: plants in full nutrition; open circles and dashed lines: plants under N-deprivation. “Rr” after the parameter’s symbol indicates the parameter’s response ratio value due to N-deprivation.
Acknowledgements
We would like to express our appreciation to Syngenta Hellas and George Pontikas for the supply of maize seeds, and to Lampros Bouranis for providing advice on the statistical analysis of the data.
References
- Engels, C., Kirkby, E. and White, P. (2012) Mineral Nutrition, Yield and Source-Sink Relations. In: Marschner, P., Ed., Marschner’s Mineral Nutrition of Higher Plants, 3rd edition, Elsevier, Berlin, 101. http://dx.doi.org/10.1016/B978-0-12-384905-2.00005-4
- Radin, J.W. (1990) Responses of Transpiration and Hydraulic Conductance to Root Temperature in Nitrogenand Phosphorus-Deficient Cotton Seedlings. Plant Physiology, 92, 855-857. http://dx.doi.org/10.1104/pp.92.3.855
- McDonald, A.J.S. and Davies, W.J. (1996) Keeping in Touch: Responses of the Whole Plant to Deficits in Water and Nitrogen Supply. Advances in Botanical Research, 22, 229-300. http://dx.doi.org/10.1016/S0065-2296(08)60059-2
- Ward, E.J., Oren, R., Bjarn, D., Sigurdsson, B.D., Jarvis, P.G. and Linder, S. (2008) Fertilization Effects on Mean Stomatal Conductance Are Mediated through Changes in the Hydraulic Attributes of Mature Norway Spruce Trees. Tree Physiology, 28, 579-596. http://dx.doi.org/10.1093/treephys/28.4.579
- Eichert, T., Peguero-Pina, J. J., Gil-Pelegrín, E., Heredia, A. and Fernández, V. (2010) Effects of Iron Chlorosis and Iron Resupply on Leaf Xylem Architecture, Water Elations, Gas Exchange and Stomatal Performance of Field-Grown Peach (Prunus persica). Physiologia Plantarum, 138, 48-59. http://dx.doi.org/10.1111/j.1399-3054.2009.01295.x
- Clarkson, D.T., Carvajal, M., Henzler, T., Waterhouse, R.N., Smyth, A.J., Cooke, D.T. and Steudle, E. (2000) Root Hydraulic Conductance: Diurnal Aquaporin Expression and the Effects of Nutrient Stress. Journal of Experimental Botany, 51, 61-70. http://dx.doi.org/10.1093/jexbot/51.342.61
- Wilkinson, S., Bacon, M.A.Z. and Davies, W.J. (2007) Nitrate Signalling to Stomata and Growing Leaves: Interactions with Soil Drying, ABA, and Xylem Sap pH in Maize. Journal of Experimental Botany, 58, 1705-1716. http://dx.doi.org/10.1093/jxb/erm021
- Amtmann, A. and Armengaud, P. (2009) Effects of N, P, K and S on Metabolism: New Knowledge Gained from MultiLevel Analysis. Current Opinion in Plant Biology, 12, 275-283. http://dx.doi.org/10.1016/j.pbi.2009.04.014
- Battal, P., Turker, M. and Tileklioglu, B. (2003) Effects of Different Mineral Nutrients on Abscisic Acid in Maize (Zea mays). Annales Botanici Fennici, 40, 301-308.
- Bouranis, D.L., Chorianopoulou, S.N., Dionias, A., Sofianou, G., Thanasoulas, A., Liakopoulos, G. and Nikolopoulos, D. (2012) Comparison of the S-, Nor P-Deprivations’ Impacts on Stomatal Conductance, Transpiration and Photosynthetic Rate of Young Maize Leaves. American Journal of Plant Sciences, 3, 1058-1065. http://dx.doi.org/10.4236/ajps.2012.38126
- Genty, B., Brintais, J.-M. and Baker, N.R. (1989) The Relationship Betweenthe Quantum Yield of Photosyntetic Electron Transport and Quenching of Chlorophyll Fluorescence. Biochimica et Biophysica Acta, 990, 87-92. http://dx.doi.org/10.1016/S0304-4165(89)80016-9
- Farquhal, G.D., Buckley, T.N. and Miller, J.M. (2002) Optimal Stomatal Control in Relation to Leaf Area and Nitrogen. Silva Fennica, 36, 625-637.
- Wilkinson, S. and Davies, W.J. (2002) ABA-Based Chemical Signalling: The Coordination of Responses to Stress in Plants. Plant, Cell & Environment, 25, 195-210. http://dx.doi.org/10.1046/j.0016-8025.2001.00824.x
- Cramer, M.D., Hawkins, H.-J. and Verboom, G.A. (2009) The Importance of Nutritional Regulation of Plant Water Flux. Oecologia, 161, 15-24. http://dx.doi.org/10.1007/s00442-009-1364-3
- Gorska, A., Ye, Q., Holbrook, N.M. and Zwieniecki, M.A. (2008) Nitrate Control of Root Hydraulic Properties in Plants: Translating Local Information to Whole Plant Responses;” Plant Physiology, 148, 1159-1167. http://dx.doi.org/10.1104/pp.108.122499
- Maurel, C., Verdoucq, L., Luu, D.-T. and Santoni, V. (2008) Plant Aquaporins: Membrane Channels with Multiple Integrated Functions. Annual Review of Plant Biology, 59, 595-624. http://dx.doi.org/10.1146/annurev.arplant.59.032607.092734
- Brewitz, E., Larsson, C.-M. and Larsson, M. (1995) Influence of Nitrate Supply on Concentrations and Translocation of Abscisic Acid in Barley (Hordeum vulgare). Physiologia Plantarum, 95, 499-506. http://dx.doi.org/10.1111/j.1399-3054.1995.tb05515.x
NOTES
*Corresponding author.