American Journal of Plant Sciences
Vol.5 No.3(2014), Article ID:42675,20 pages DOI:10.4236/ajps.2014.53047
Transcriptome Analysis of Drought Induced Stress in Chenopodium quinoa
![]()
1Department of Plant and Wildlife Sciences, Brigham Young University, Provo, Utah; 2A. Bonifacio, Fundacion PROINPA, Cochabamba, Bolivia; 3Department of Biology, Utah Valley University, Orem, Utah.
Email: *Jeff_Maughan@byu.edu
Copyright © 2014 Joshua A. Raney et al. This is an open access article distributed under the Creative Commons Attribution License, which permits unrestricted use, distribution, and reproduction in any medium, provided the original work is properly cited. In accordance of the Creative Commons Attribution License all Copyrights © 2014 are reserved for SCIRP and the owner of the intellectual property Joshua A. Raney et al. All Copyright © 2014 are guarded by law and by SCIRP as a guardian.
Received December 4th, 2013; revised January 12th, 2014; accepted January 24th, 2014
KEYWORDS
Quinoa; Drought Tolerance; RNA-Seq; Transcriptome Assembly
ABSTRACT
Quinoa (Chenopodium quinoa Willd.) is a halophytic, allotetraploid grain crop of the Amaranthaceae family with impressive drought tolerance, nutritional content and an increasing worldwide market. Here we report the results of an RNA-seq transcriptome analysis of Chenopodium quinoa using four water treatments (field capacity to drought) on the varieties “Ingapirca” (representing valley ecotypes) and “Ollague” (representing Altiplano Salares ecotypes). Physiological results, including growth rate, photosynthetic rate, stomatal conductance, and stem water potential, support the earlier findings that the Altiplano Salares ecotypes display greater tolerance to drought-like stress conditions than the valley ecotypes. cDNA libraries from root tissue samples for each variety × treatment combination were sequenced using Illumina Hi-Seq technology in an RNA-seq experiment. De novo assembly of the transcriptome generated 20,337 unique transcripts. Gene expression analysis of the RNA-seq data identified 462 putative gene products that showed differential expression based on treatment, and 27 putative gene products differentially expressed based on variety × treatment, including significant expression differences in root tissue in response to increasing water stress. BLAST searches and gene ontology analysis show an overlap between drought tolerance stress and other abiotic stress mechanisms.
1. Introduction
Quinoa (Chenopodium quinoa Willd.) is an allotetraploid (2n = 4x = 36) species belonging to the goosefoot (Chenopodium) genus, which consists of over 120 species of perennial and annual herbaceous flowering plants. Native to the Andean region of South America, this pseudocereal grain crop has been cultivated for thousands of years where it was considered a sacred grain within the ancient Incan and Tiwanakan civilizations [1]. Recent international attention to quinoa is due to its unusually high nutritional value [2], being referred to as the “supergrain of the future” because of its high protein content (reported to have reached 22.1%, [3]), composition and quantity of lipids [4], and ideal balance of essential amino acids [5]. Quinoa has relatively high amounts of vitamins and minerals [6] and is gluten-free. The United Nations declared 2013 as the “International Year of Quinoa” [7].
More than six thousand accessions of improved varieties and landrace ecotypes of quinoa are held in germplasm banks throughout South America. Valencia-Chamorro [8] categorized these varieties and ecotypes into five groups according to an altitudinal gradient and environment: sea level, valleys, the Yungas (subtropics), the Salares (salt flats) and the Altiplano (high plains). Although valley ecotypes are cultivated at around 2000 - 4000 m, they receive similar amounts of annual rainfall as the sea level ecotypes cultivated at lower elevations (800 - 1500 m). The Salares and Altiplano ecotypes are adapted to extreme environmental conditions that typify the Andean Altiplano: high altitude, low precipitation, saline soils and frequent frost [2,9,10]. These regions are known to have below-freezing temperatures and frost for up to 200 days per year [11]. The Salares ecotypes grow in highly saline soils with pH > 8.0. Both Salares and Altiplano ecotypes are cultivated at altitudes around 4000 m and receive as little as 200 mm of annual rainfall [12,13].
Among all the abiotic and biotic stresses endured by crop plants, drought is considered the most important factor limiting crop productivity worldwide [14,15]. Current climate models of global warming indicate an increase in drought episodes and severity in regions prone to drought [16]. For example, in 2012 the United States experienced drought in almost 80% of its agricultural land—making 2012 the most extensive drought experienced by the United States since the 1950s. Yields for corn (122 bushels per acre) and soybean (37.8 bushels per acre) were the lowest since 1995 for corn and 2003 for soybean USDA [17]. Such changes will have devastating economic and sociological impact on human populations. The decrease in corn and soybean production in 2012 drastically affected the supply, demand and price conditions of other crops, meat, poultry, dairy as well as other packaged and processed foods that use these crops. The 2012 drought significantly increased the 2013 price index for beef (up 4% - 5%), dairy products (up 3.5% - 4.5%), poultry (up 3% - 4%), and cereals and bakery products (up 3% - 4%) [18]. Similar outcomes related to drought stress are appearing regularly across the globe in essentially all crops. Understanding how plants respond to drought so that adaptive agricultural strategies can be developed is an urgent and essential goal of plant and crop scientists.
While quinoa is commonly referred to as a drought and salt tolerant crop [19,20], no research has been reported that investigates the genomic basis for droughttolerance differences among quinoa ecotypes. Transcriptome research conducted in Arabidopsis thaliana [21,22], Oryza sativa [23,24], and Sorghum bicolor [25] has been used to successfully identify differentially expressed genes, implicating several biosynthetic pathways that assist in the overall tolerance to drought stress. Recent genomic research in quinoa has successfully identified genes (e.g., SOS1, NHX1, etc.) associated with salt tolerance [26,27], further suggesting the possibility of unraveling the genetic basis of drought resistance in quinoa through transcriptome analysis.
In this study, we compared the response to different water treatments approximating drought-like conditions in two quinoa varieties, specifically “Ingapirca”, derived from a valley ecotype native to Ecuador, and “Ollague”, derived from a Salares ecotype native to Chile [28]. We used RNA sequencing (RNA-Seq) technology to identify putative gene products that are differentially expressed during progressive water stress. We assembled the first root transcriptome of quinoa, using Illumina reads (created in this study) and 454-pyrosequencing and Sanger reads (obtained from previous studies and GenBank). Differentially expressed genes were identified and bioinformatic methods were employed to implicate specific pathways putatively associated with water stress in quinoa.
2. Materials and Methods
2.1. Greenhouse Experiment
Plants were propagated in greenhouse facilities at Brigham Young University (40.245 N, −111.641 W, 1410 m above sea level) in September 2011. Ingapirca is a variety derived from a valley ecotype native to Ecuador and Ollague is a variety derived from a Salares ecotype native to Chile. Seeds of both varieties were kindly provided by Angel Mujica (Universidad del Altiplano, Puno, Peru). Daily average greenhouse conditions were maintained at a maximum temperature of 28˚C, minimum temperature of 19˚C, with a day length of 13 hours. Seedlings were thinned to three seeds per four-inch pot using Sunshine Basic Mix 1 soil (Sun Gro, Vancouver, British Columbia, Canada) supplemented with Osmocote fertilizer (Scotts, Marysville, OH). Three replicates, including the two varieties and four watering treatments were set up using a randomized complete block design. All plants were watered and treated equally for an initial period of three weeks.
2.2. Phenotypic Measurements
Photosynthetic rate, stomatal conductance, transpiration rate, vapor pressure, and temperature of leaf were assayed using the LI-6400XT Portable Photosynthesis System (LI-COR, Lincoln, NE). Plant height was measured and averaged every third day. A pressure bomb (PMS Instrument Company, Albany, OR) with compressed nitrogen was used to measure the stem water potential, while chlorophyll a, b, and total chlorophyll contents were determined as described by Nagata and Yamashta [29] for one plant per replication randomly chosen a priori. Quantitative data were analyzed statistically using the computer program R 2.15.1 [30].
2.3. Drought Treatments
The four drought treatments were induced and maintained by differential watering using the method described by Earl [31]. To calibrate determination of different drought treatments, 130 g of soil was water saturated and defined as the soil water holding capacity or “wet weight” (435.08 g). Oven-drying the saturated soil for four days resulted in a total “dry weight” of 72.58 g. The difference between the wet weight and dry weight (362.50 g) represents the soil water holding capacity of the pot. Field capacity was defined as 40% of the soil water holding capacity (145 g). The other estimated field capacities were calculated based on the 100% field capacity water weight of 145 g. The low, medium, and high water stress treatments were applied at 50%, 30% and 10%field capacity, respectively. Thus, the 100% field capacity treatment (hereafter referred to as the control) was maintained at 293 g (145 g water, 130 g soil, 18 g dry pot), while the low, medium, and high stress treatments were maintained at 220.5 g, 191.5 g, and 162.5 g respectively. Each pot was weighed independently three times per day, with water being added when the pot weight dropped below the weight thresholds.
These different drought treatments were initiated at day 23 when all plants reached the eight-leaf stage of development. The treatments were applied in a progressive manner by maintaining all samples at a particular treatment for 1 day prior to progressing to higher drought treatments. Soil moisture tension and temperature of the soil was measured in control pots using a Davis 6440 watermark soil moisture sensors (Davis Instruments, Hayward, CA). This particular soil moisture sensor converts electrical resistance to a calibrated reading of centibars of soil water suction, ranging from 10 - 200 centibars. Two sensors measured each drought treatment, which were averaged at the conclusion of the study to ensure distinct treatments (Table 1).
2.4. cDNA Library Construction
A flow chart that depicts cDNA library construction is provided as Supplemental Figure 1. Entire roots systems were collected from each variety-treatment combination. The tissue was immediately flash frozen in liquid
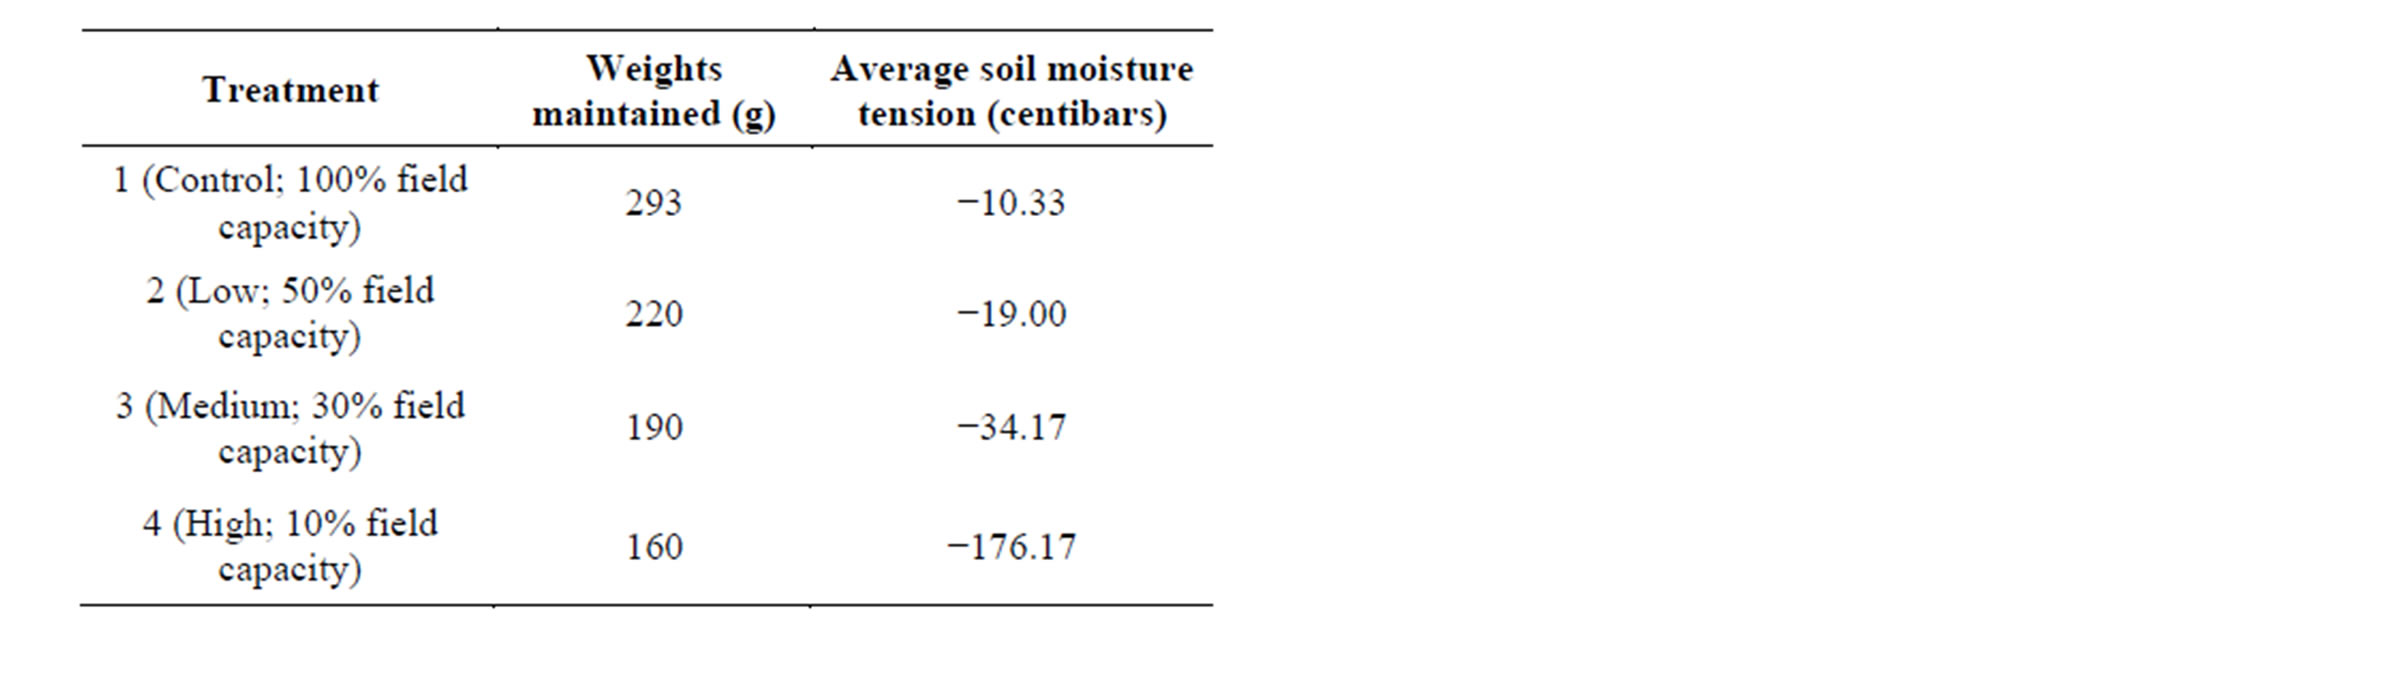
Table 1. The different water treatments used in this study with reported weights maintained (g) throughout the experiment and average soil moisture tension (bars) that were measured once treatments reached their final maintained weights.
nitrogen. RNA was extracted from root tissue using an RNeasy® Plant Mini Kit according to the manufacture’s instructions (Qiagen, Valencia, CA). RNA concentration and quality were assessed using an ND-1000 Spectrophotometer (NanoDrop, Wilmington, DE) and an Agilent 2100 Bioanalyzer (Agilent Technologies, Santa Clara, CA). Conversion of mRNA into cDNA libraries was accomplished using the reagents and protocol provided in the Illumina® TruSeq™ RNA Sample Preparation Kit (Illumina, San Diego, CA). This procedure includes fragmenting the mRNA, synthesis of first and second strand cDNA, followed by end-repair, adenylating the 3’ ends, and ligation of sequence adaptors. Adding unique sequence adaptors, also known as indexing or barcoding, allows for multiple libraries to be sequenced in a single lane. The quality of the synthesized cDNA libraries was verified using a DNA 7500 LabChip® Kit (Agilent Technologies, Santa Clara, CA) on a 2100 Bioanalyzer.
2.5. Sequencing and Assembly
Sequencing was performed at the Microarray and Genomic Analysis Core Facility at the University of Utah (Salt Lake City, UT). The libraries were quantified and checked for quality using an Illumina HiSeq 2000 instrument before being sequenced. The twenty-four cDNA libraries were divided evenly between two lanes of the flow cell (1 × 50 bases). The cDNA library numbering and sequencing layout is depicted in Supplemental Figure 2. The reads have been made publically available through NCBI’s Sequence Read Archive (GenBank SRA #SRR799899 and SRR799901). The resulting Illumina fastq reads were trimmed using the computer program Sickle with a phred quality threshold score of 20 (https://github.com/najoshi/sickle). In addition, 454-pyrosequencing (GenBank SRA #SRR315568-SRR315570) and Sanger sequence reads (GenBank dbEST ID #GI- 47561370-GI47561793), obtained from previous studies, were also converted to fastq format. All reads were assembled de novo using the Trinity assembler (v. 2012- 04-22; [32]). We then mapped the Illumina reads to the predicted Trinity contigs using GSNAP (v. 2012-05-23; [33]) with a max number of paths to print (-n) of 1, limiting mapping of each read to a single contig. The expression counts for each sample were calculated with a samtools script and the read counts for each gene were normalized by length and library size and rounded to the nearest whole number [34].
2.6. Differential Gene Expression Analysis
EdgeR is a Bioconductor package based on a negative binomial (NB) distribution. Robinson et al. [35] modeled the counts for each gene (g) and sample (i) using the following algorithm:
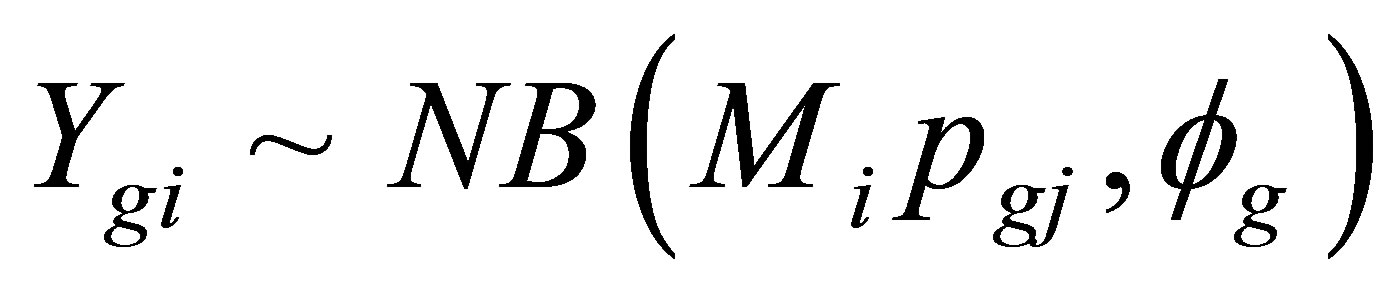
where Mi represents the library size, pgj represents the proportion of gene g in the experimental group j to which sample i belongs, and fg is the over-dispersion parameter that accounts for biological or sample-to-sample variation. Different models were also created that identified 1) genes that were differentially expressed between the two varieties (Ingapirca versus Ollague across all treatments), 2) genes that were differentially expressed among the four drought treatments, and 3) genes that were differentially expressed based on the variety × treatment interaction, where the different variables represent the average expression of Ingapirca control, Ingapirca low stress, Ingapirca medium stress, Ingapirca high stress, Ollague control, Ollague low stress, Ollague medium stress, and Ollague high stress. Transcripts with false discovery rate (FDR) < 0.05 were extracted for further analysis [36].
2.7. GO Annotation and Pathway Analysis
Differentially expressed transcripts were compared to the RefSeq Protein public database using BLASTX [37] with an E-value cut-off of 10e−10 to provide a functional annotation for each contig. We imported all differentially expressed transcripts into Blast2GO (version 2.6.1; [38]) where gene ontology (GO) terms were assigned and clustered based on biological process, cellular component, or molecular function. Mapping and annotation were performed using default parameters (E-value hit filter 1.0e−6, annotation cutoff 55, GO weight 5, HSP-hit coverage cut-off 20). GO enrichment was tested using the Fisher exact test, which uses the Gossip software integrated in the Blast2GO package [39]. This test assessed significant over-representation of GO terms in the list of the regulated genes (462 DE genes—test group) against the non-differentially expressed transcripts (20,337 contigs—reference group), using a cut-off threshold of FDR < 0.05. Specific gene products were identified as well as associated biological pathways as determined by the KEGG pathway [40] mapping functionality offered in the Blast2GO program.
3. Results
3.1. Phenotypic Response
An initial greenhouse study compared the phenotypic responses associated with different water treatments between Ingapirca and Ollague. Measurements included heights, photosynthetic rate, stomatal conductance, and stem water potential. ANOVA analysis identified significant differences between the varieties and among all treatment levels (p = 3.01e−05 and p = 0.00212, Table 2)
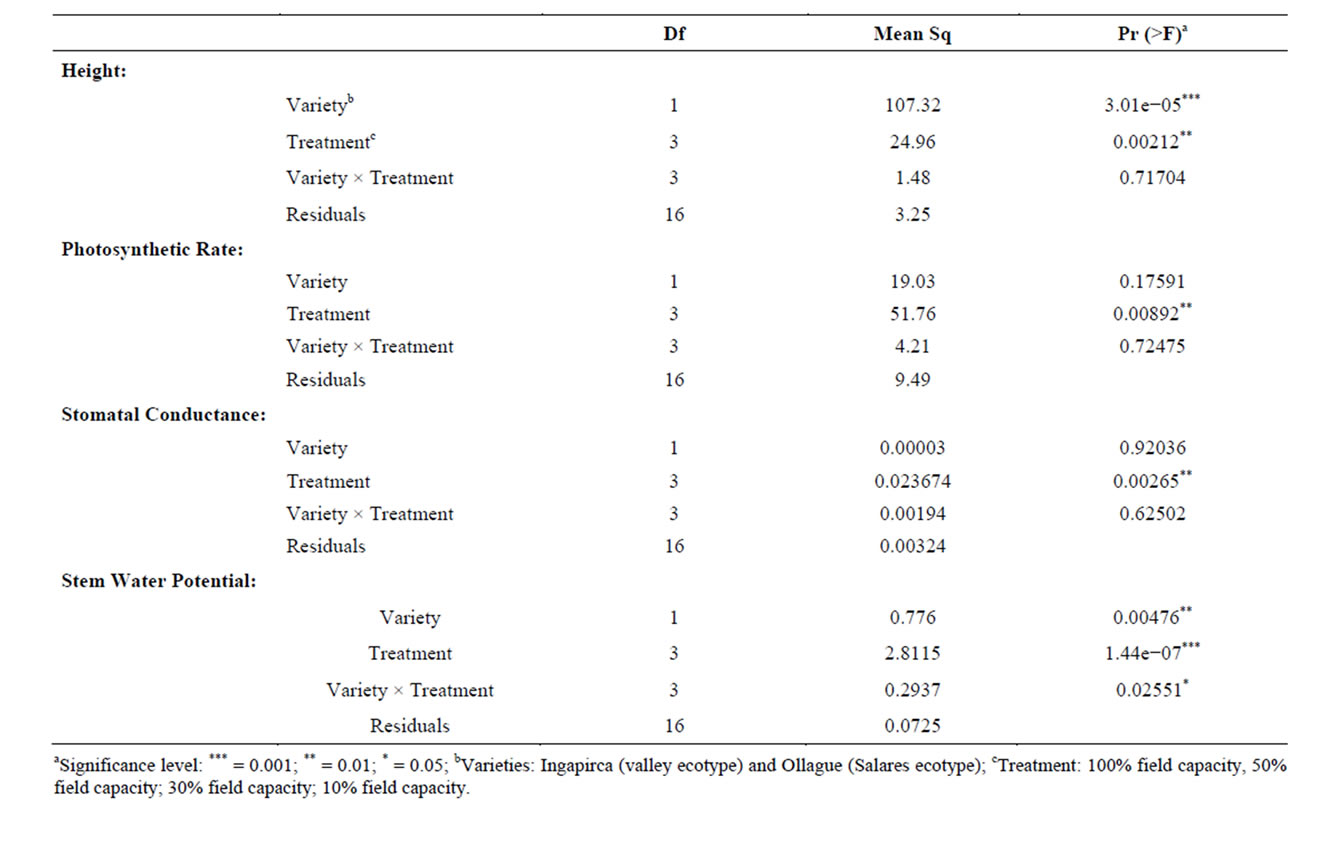
Table 2. ANOVA analysis of phenotypic responses associated with different water treatments between two quinoa varieties.
for plant height. The affects of water stress on plant height was evident in both varieties but more pronounced in the valley variety, Ingapirca, which had a more dramatic decrease in average height between the control and high water stress treatments than the respective treatments for Ollague. The Ollague plants were also negatively affected by the water stress but had a statistically significant lower average height compared to controlsin all treatments (Figure 1(a)).
Similar to height, photosynthetic rate and stomatal conductance measurements exhibited reduced metabolism due to stress treatments (Figures 1(b) and (c)). Ingapirca showed phenotypic effects typical of drought stress, including loss of turgor pressure, causing the plant stem and leaves to droop, and curling of the leaves. The phenotypic effects were symptomatic of the underlying physiology. Under the high water stress treatment Ingapirca had a lower average photosynthetic rate (5.5 µmol CO2 m−2·s−1) and stomatal conductance (0.031 µmol H2O m−2·s−1) when compared to the Ollague plants (9.4 µmol CO2 m−2·s−1 and 0.081 µmol H2O m−2·s−1, Figures 1(b) and (c)). Significant differences for photosynthetic rate and stomatal conductance measurements were identified among the different water treatments in the ANOVA analysis (p = 0.00892 and p = 0.00265, Table 2).
Stem water potential is defined as the capacity of the plant to conduct water from the soil to the atmosphere. Increased negative water potential indicates greater tolerance to water stress conditions. Choné et al. [41] used stem water potential as an indicator of water deficiencies in plum orchards and grapevines. ANOVA analysis revealed significant differences between varieties (p = 0.00476), among water treatments (p = 1.44e−07), and among the variety × treatment interactions (p < 0.02551, Table 2). Ollague exhibited significantly lower average stem water potential (−2.97 MPa) when compared to Ingapirca (−1.95 MPa, Figure 1(d)).
3.2. Sequencing and Assembly
Sequencing of 24 cDNA libraries, prepared from root tissue of each treatment and each variety, generated a total of 385,311,064 sequences reads (~19.27 Gb). After assessing for quality, a total of 373,835,465 reads from the RNA-seq experiment were combined with previously identified quinoa EST sequences derived from various tissue sources (root, leaf, seedling, and seed tissue) and sequencing methodologies (454-pyrosequencing and Sanger sequencing [27,42]). All reads were assembled de novo using the Trinity assembler [32]. The combined assembly produced 20,337 unique consensus sequences (contigs), with contig read length ranging from 201 to 18,777 bp with an average and median length of 525 bp and 435 bp, respectively ( Figure 2).
3.3. Differential Expression Analysis
Implementing different models, EdgeR identified 6170 differentially expressed (DE) contigs based on variety alone and 462 DE contigs based on the different water stress treatments. The variety × treatment DE contigs identified not only showed differential expression based on the water stress treatment, but the manner in which they were differentially expressed was also influenced by variety. There were a total of 27 contigs (Supplemental Table 1) that showed differential expression based on interaction terms.
3.4. Homology and Functional Analysis
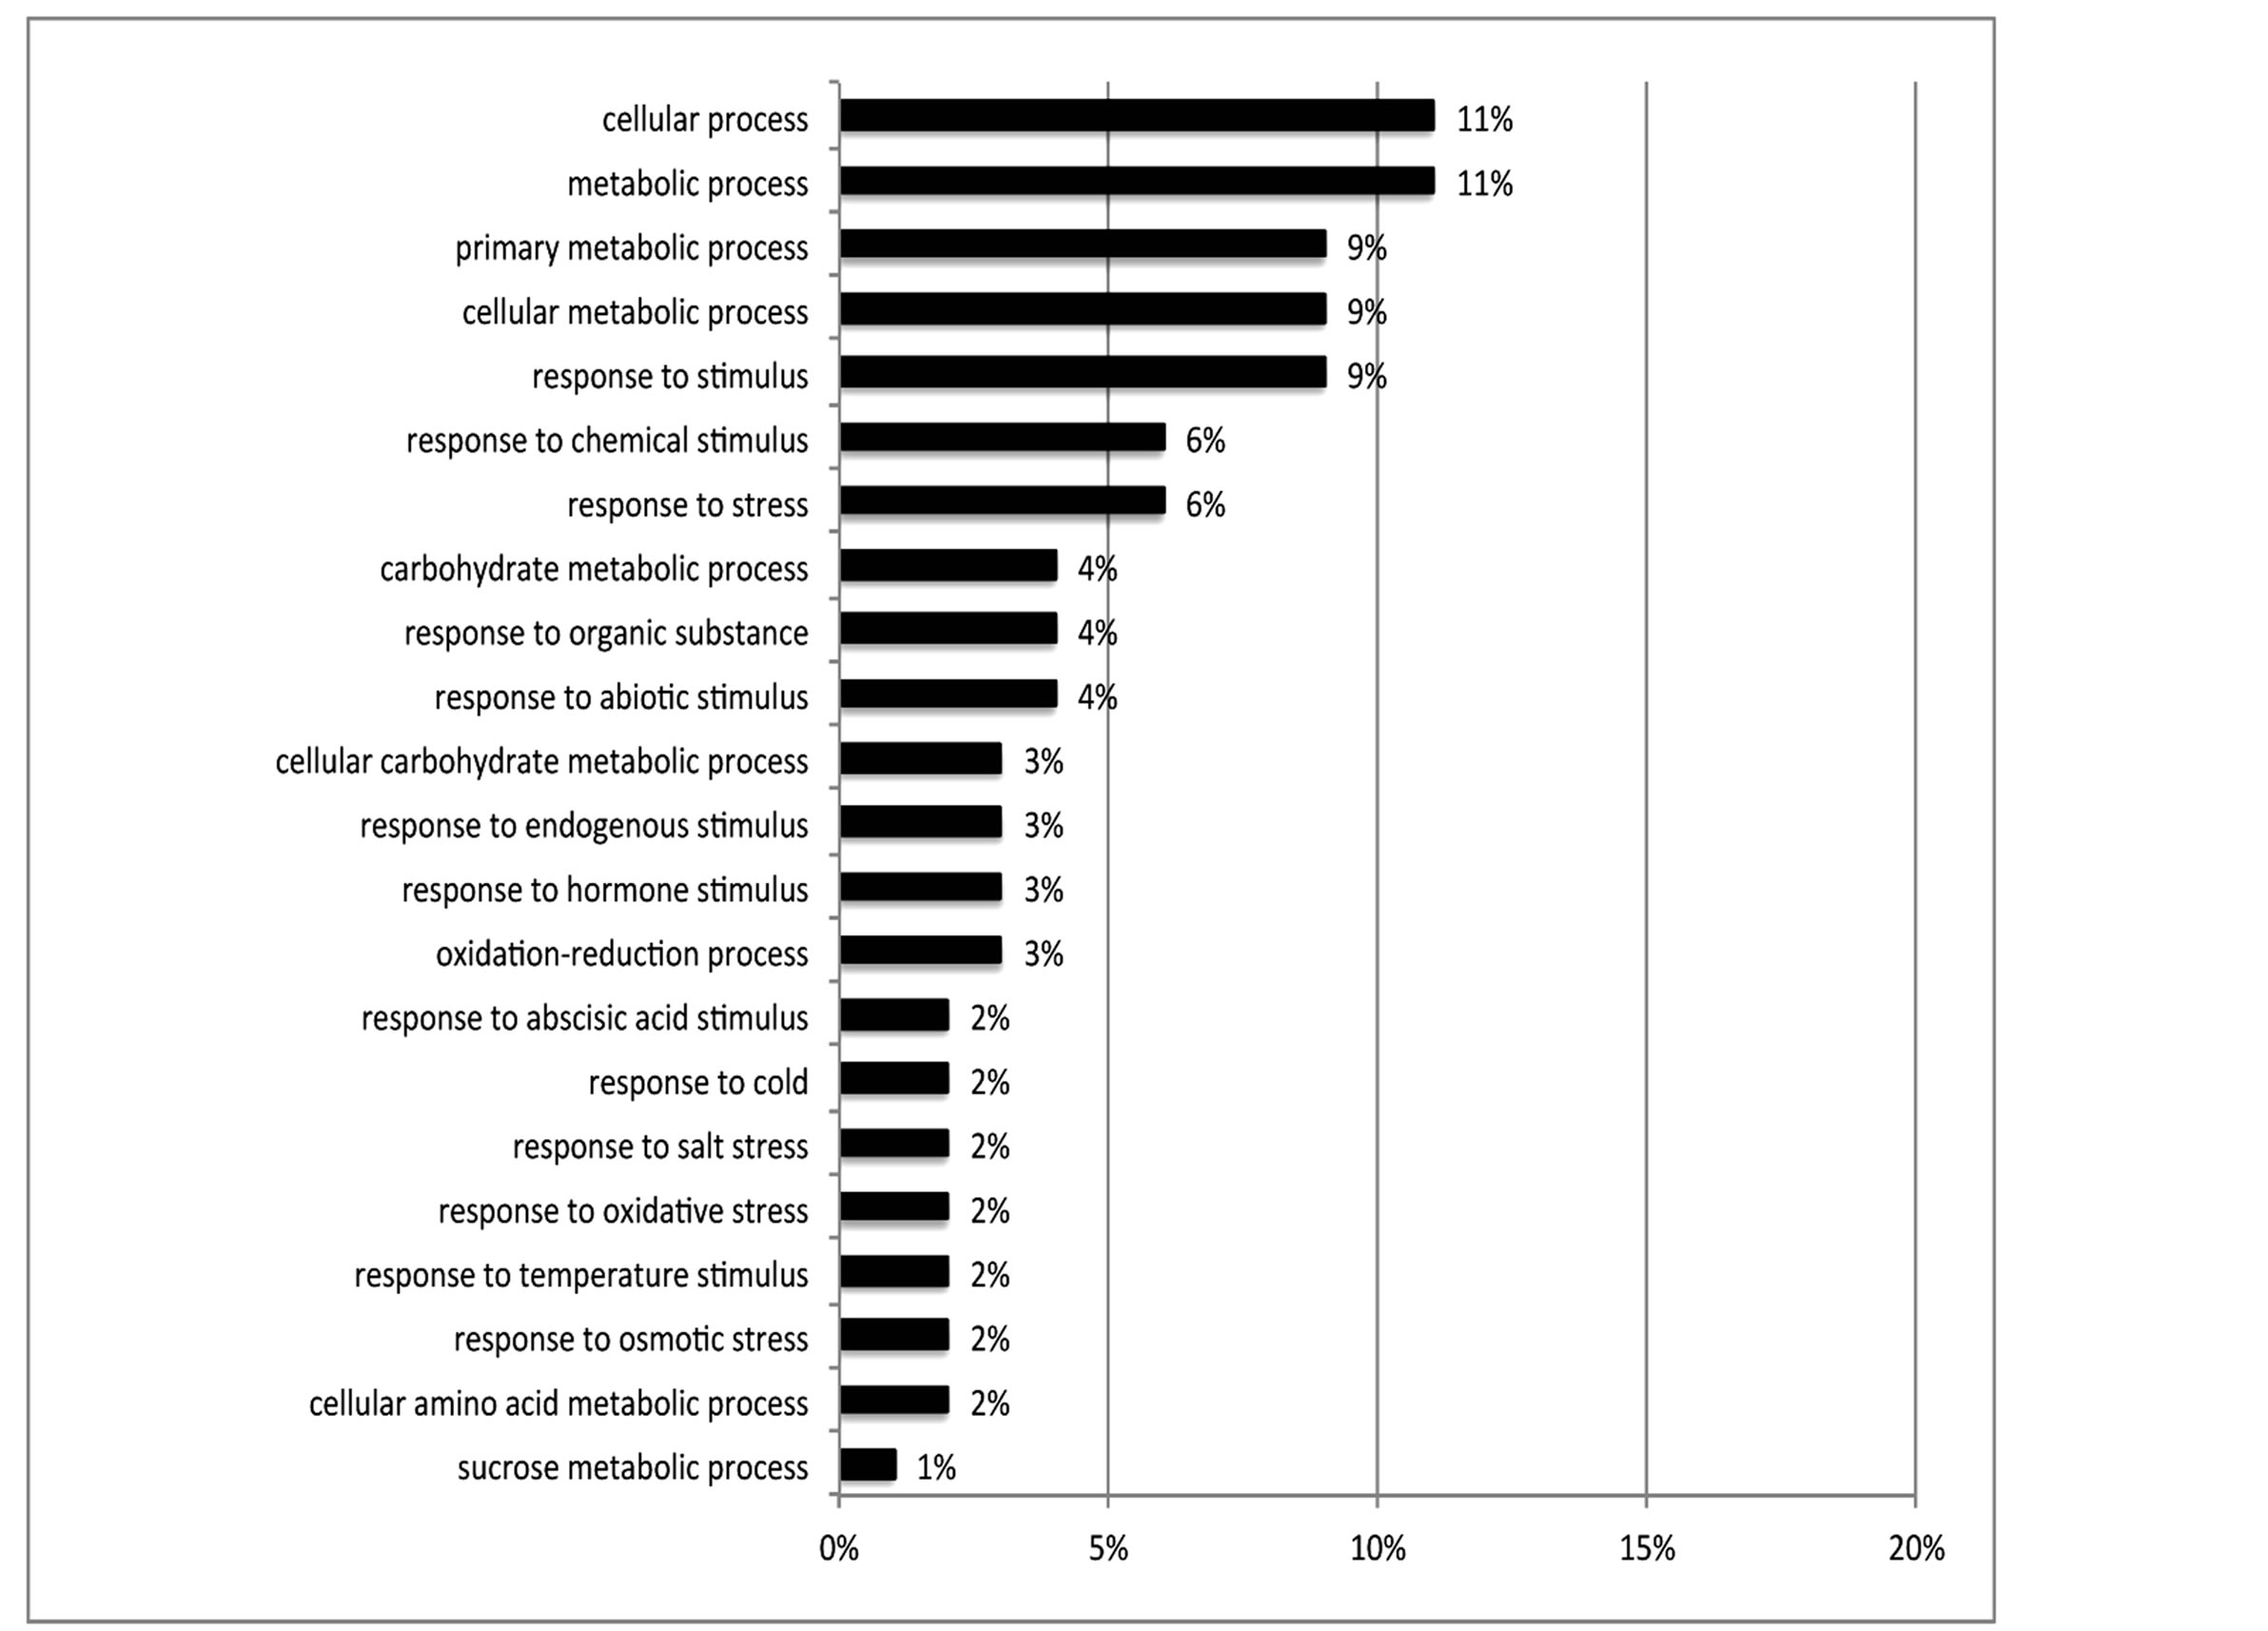
Of the 462 DE contigs identified based on different water stress treatments, 251 had sequences that could be annotated with a functional gene ontology (GO; Blast2Go) and assigned toa GO category (biological processes, cellular components, or molecular function). It should be noted that the different GO categories are non-exclusive, resulting in some contigs being annotated in more than one category. Of the sequences that expressed GO terms, 175 sequences were assigned to the biological process category, 166 sequences to the cellular component category, and 177 to the molecular function category. The most dominant terms seen in the biological process category were cellular and metabolic process. Other major biological processes identified were associated with various response stimuli: abiotic, abscisic acid, chemical, cold, endogenous, hormone, organic substance, osmotic, oxidative and salt stress (Figure 3(a)). Within the molecular-function category, the most dominant terms were catalytic activity and binding. Other major components were ATP-, DNA-, cation-, metal ion-, adenyl ribonucleotide-, and protein binding as well as enzymatic activity such as hydrolase, oxidoreductase, transferase, peroxidase and kinase activity ( Figure 3(b)). The GO enrichment test identified 58 GO categories in our study (FDR < 0.05; Table 3). All of the GO terms identified were over-represented when comparing regulated genes (462 DE treatment genes—test group) against the non-differentially expressed transcripts (20,337 contigs—reference group).
BLASTX searches of the RefSeq Protein database (E-value < 10e−10) identified homology of 21 of the 27 identified DE variety × treatment interaction contigs. GO was performed on the 21 DE variety × treatment genes using Blast2GO. Of the total 21 DE interaction genes, 17 expressed GO term(s). Transferase activity, metal ion binding, cation binding, protein binding, and oxidoreductase activity were the major activities of interaction gene products as indicated by molecular function; while cellular metabolic process, primary metabolic process, response to stress, and response to abiotic stimulus were
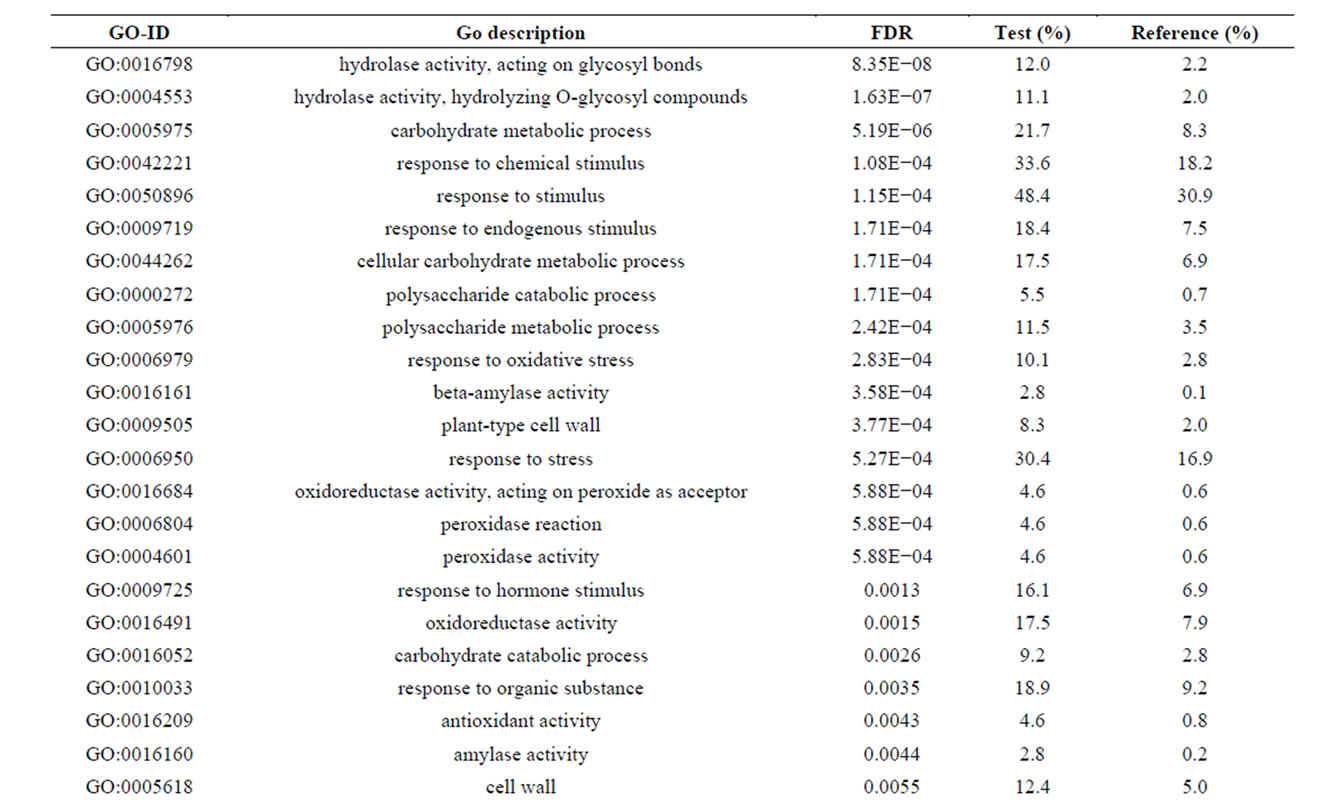
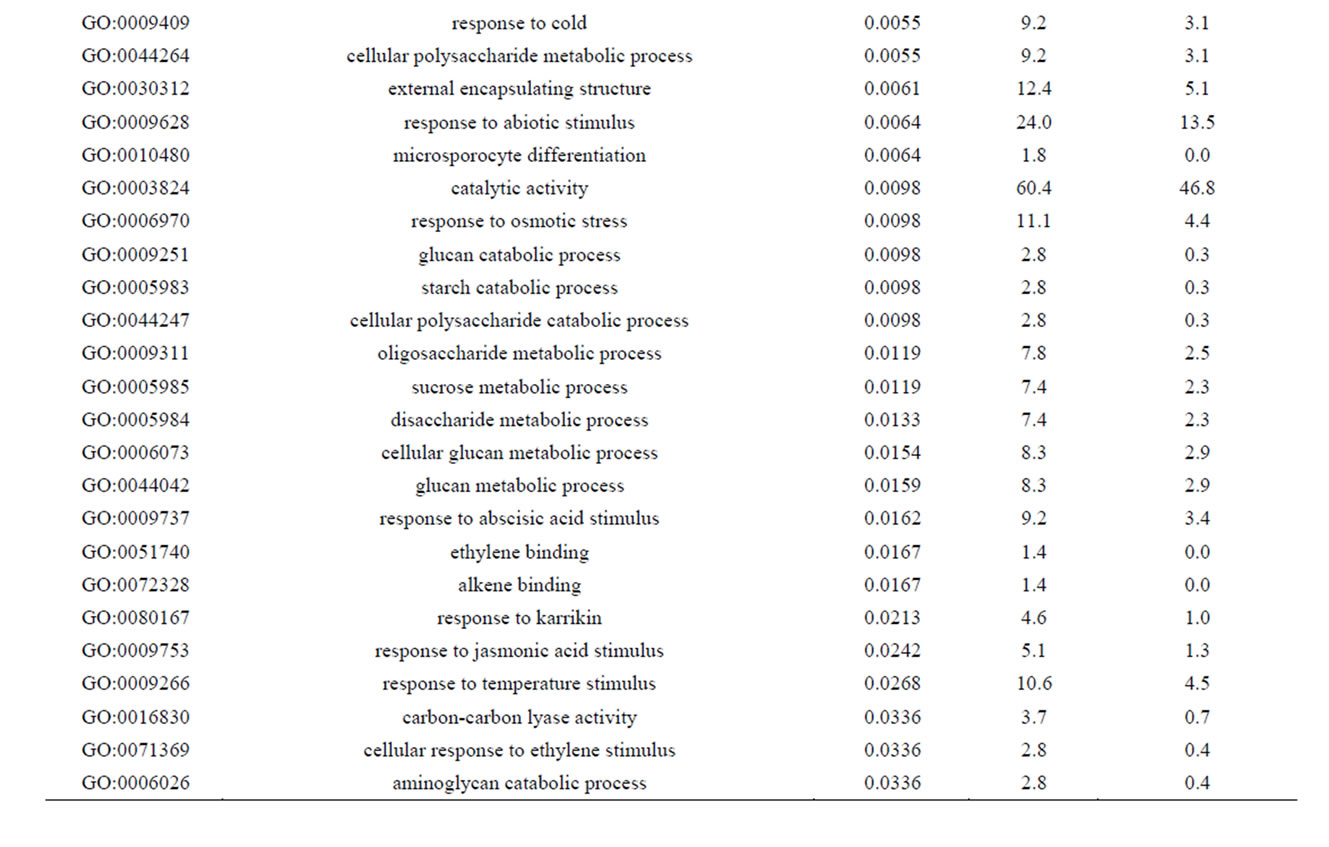
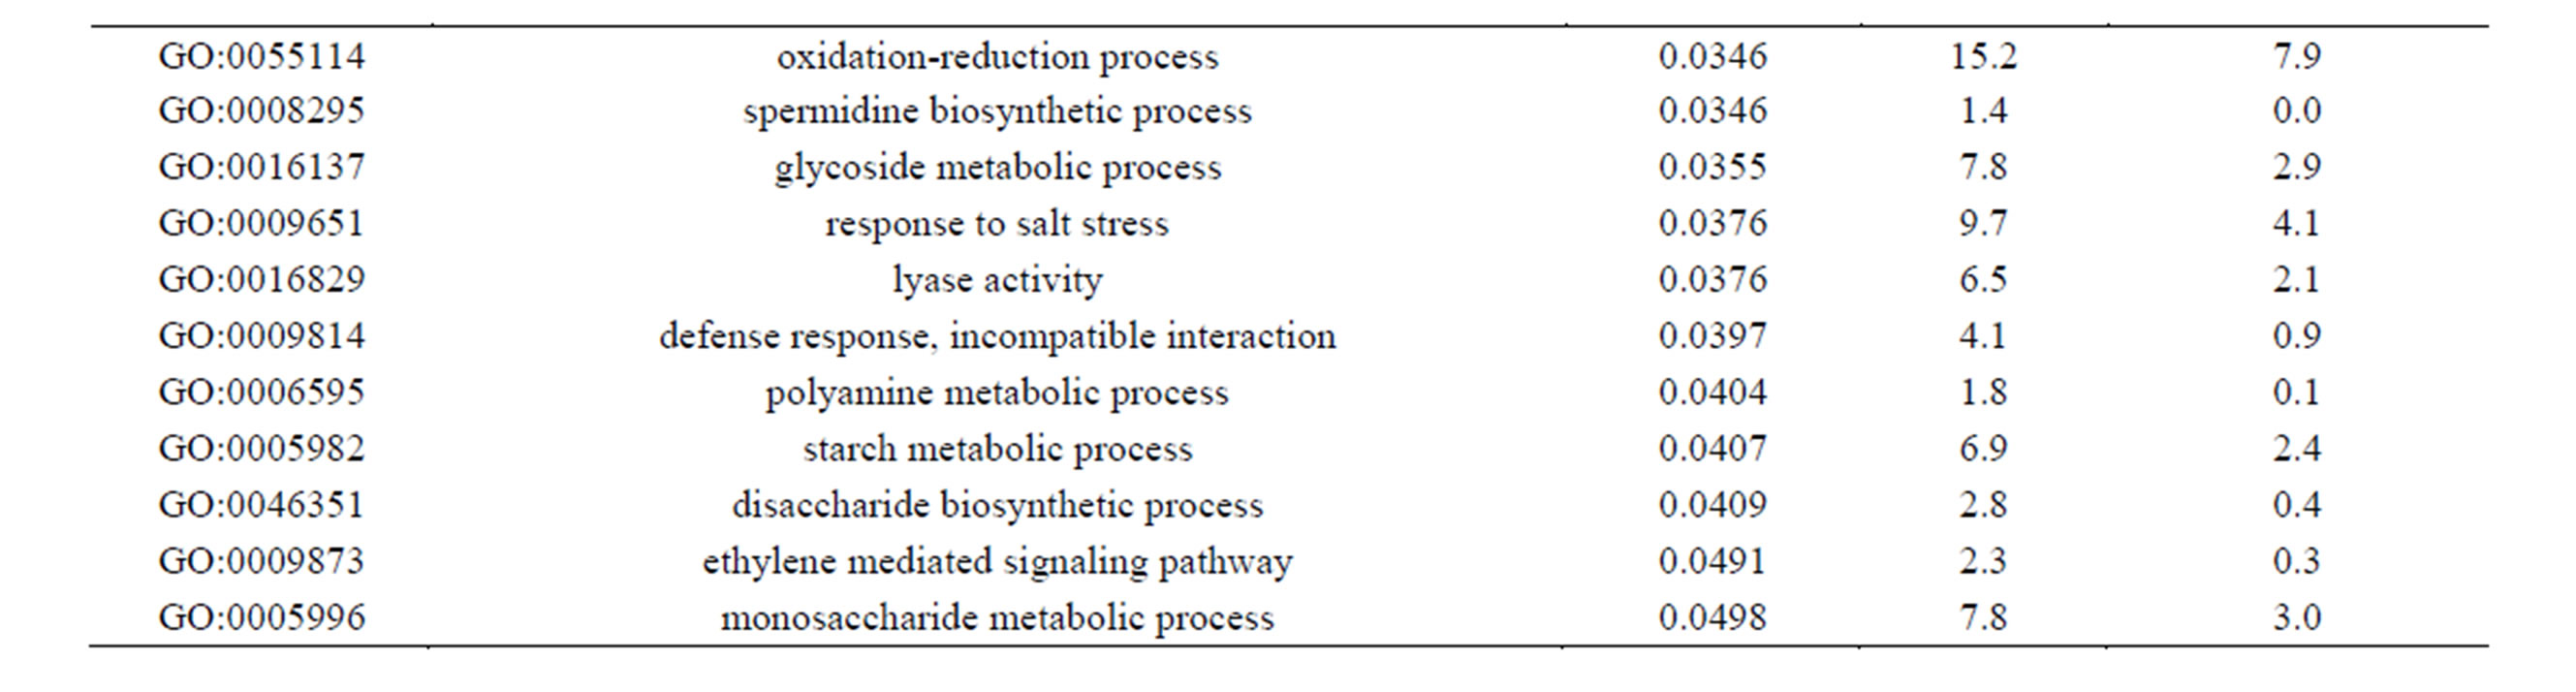
Table 3. Overrepresented GO terms in drought regulated genes. The test group is represented by the regulated genes with at least one GO assigned (462 sequences). The reference group is constituted by the non-regulated transcripts with at least one GO assigned (20,337 sequences). The cut-off threshold was FDR < 0.05.
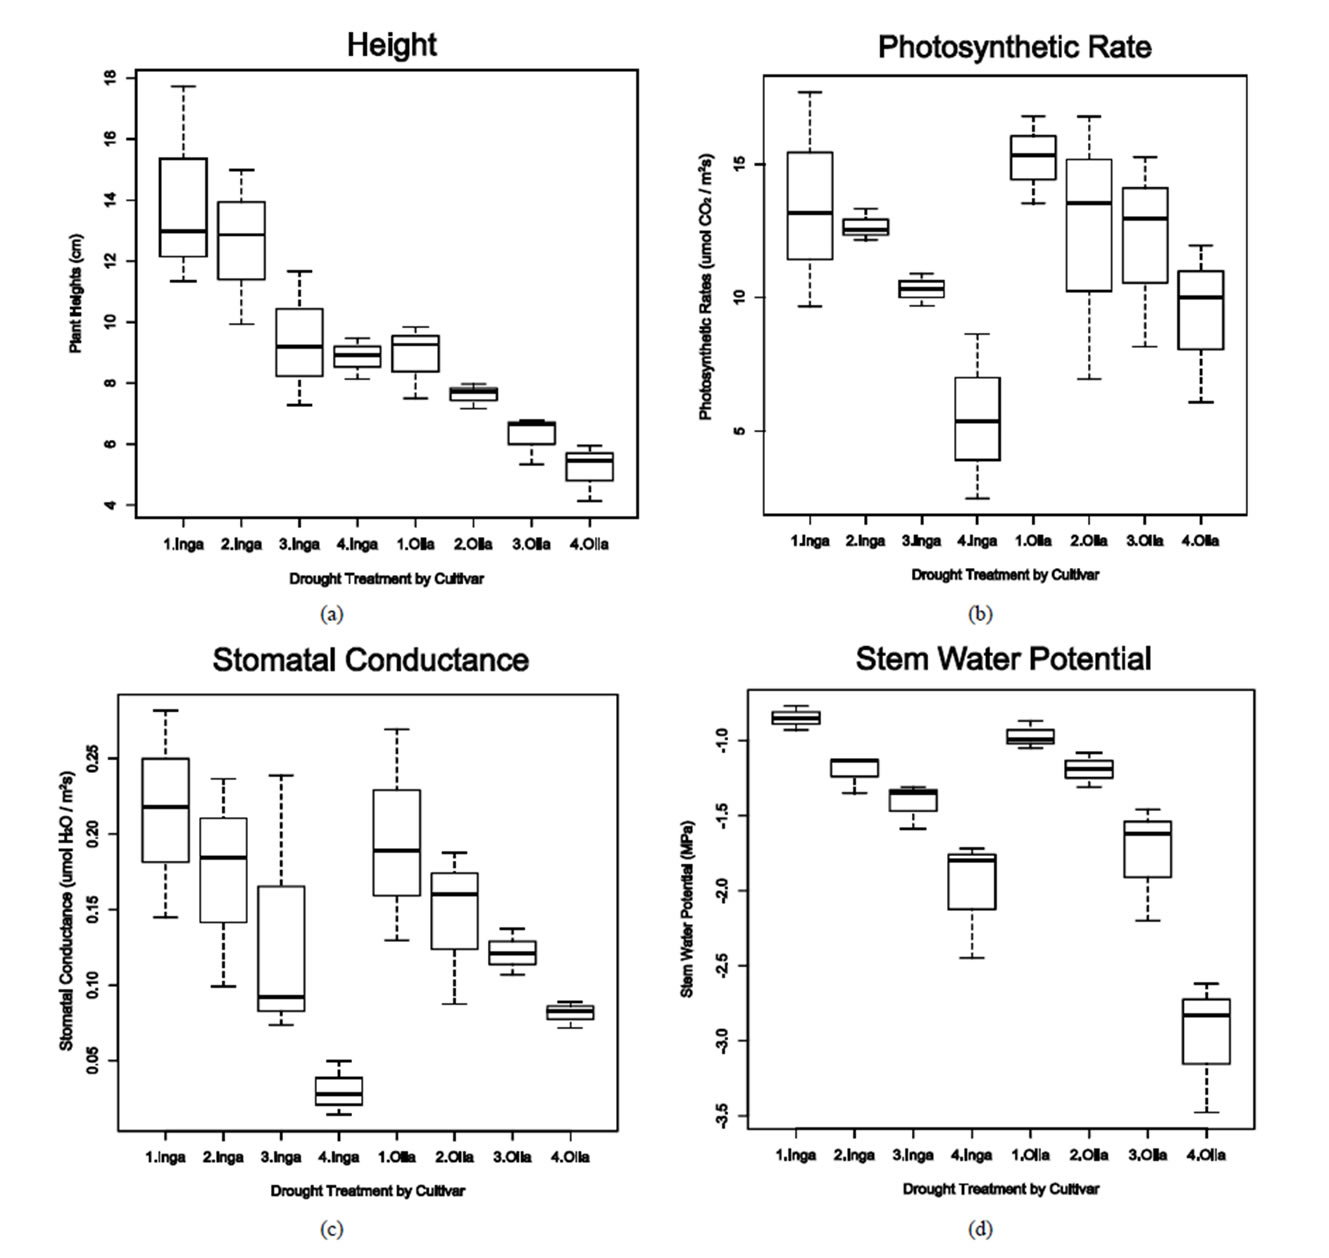
Figure 1. Whisker plots of heights, photosynthetic rate, stomatal conductance, and steam water potentials measured. Ingapirca and Ollague varieties that were subjected to one of four water stress treatments, including a 100% field capacity (1), 50% field capacity (2); 30% field capacity (3); 10% field capacity (4). “Inga” represents the Ingapirca variety while “Olla” represents the Ollague variety. a: Heights; b: Photosynthetic rate; c: Stomatal conductance; d: Stem water potential.
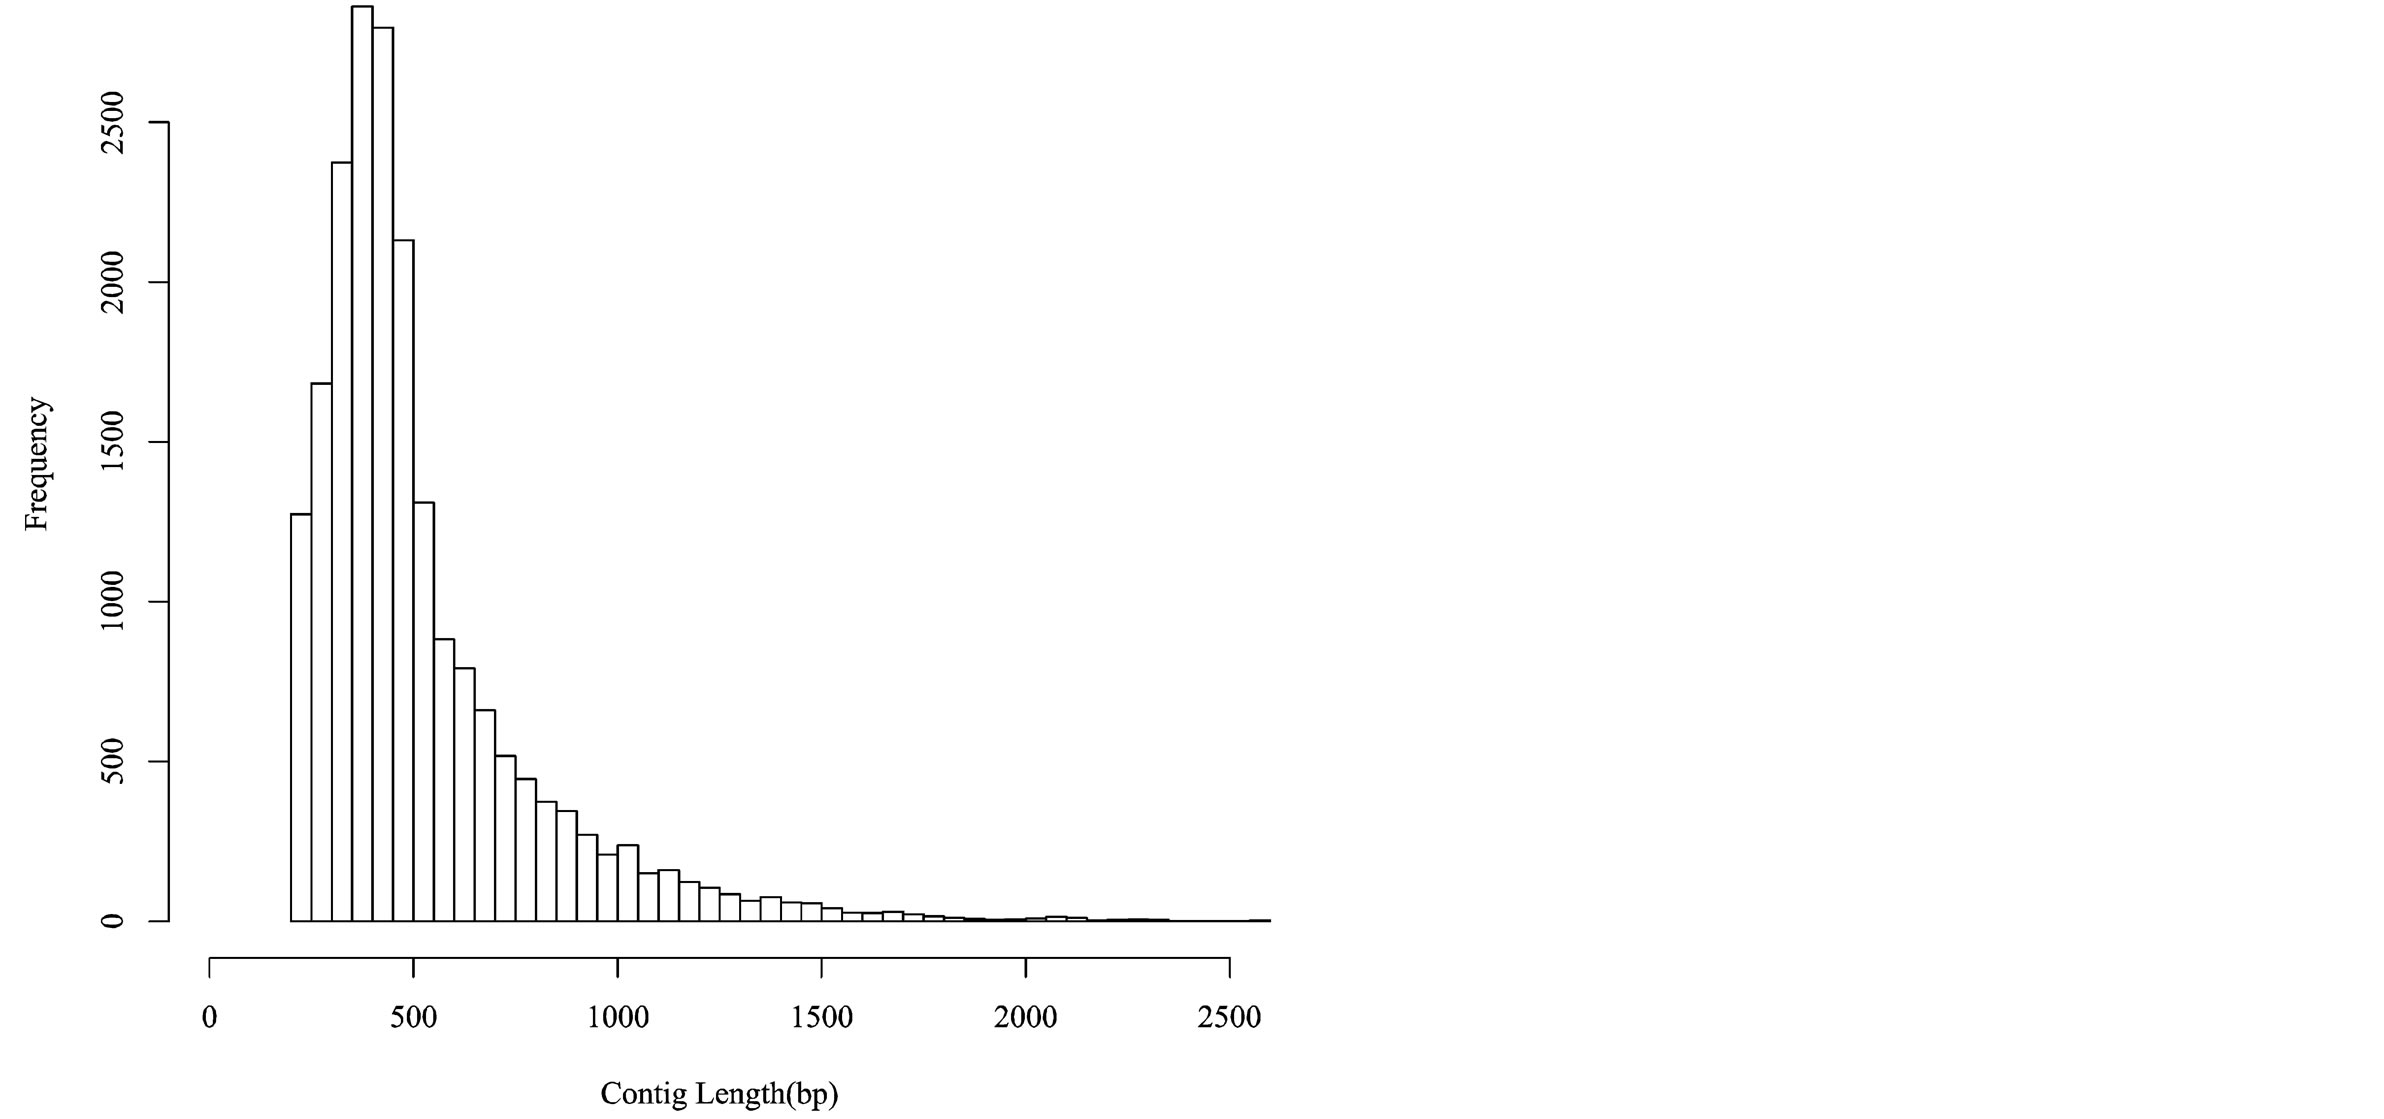
Figure 2. Histogram depicting the unique contig lengths of 454, Illumina, and Sanger sequencing reads.
the major biological processes identified (Figure 4). While this study focused primarily on water deficiency effects, response to oxidative stress, oxidation-reduction process, and response to osmotic stress each contributed 5% and response to abscisic acid stimulus contributed 3%to the overall biological process ontology. The GO enrichment test failed to identify GO terms that were over or under represented among the 27 DE variety × treatment interaction genes, a result likely due to the small number of genes tested.
4. Discussion
4.1. Phenotypic Response
The Salares ecotype (represented by the variety Ollague) was more tolerant to the water stress, as measured by growth rate, photosynthetic rate, stomatal conductance, and stem water potential, when compared to the valley ecotype (represented by variety Ingapirca [27]). Root sensing of water stress is an important mechanism in Salares ecotypes [43]. Sensing water stress, roots initiate an increase in ABA synthesis leading to a decrease in turgor of stomatal guard cells as well as inhibiting shoot growth. Stomatal closure decreases the CO2 levels within the leaf, reducing the light-independent reactions and causing the photosynthetic rate to also decrease. This relationship was seen by Jensen et al. [44] when the net photosynthesis of drought quinoa plants dropped from 14 - 24 µmol m−2·s−1 to 5 - 10 µmol m−2·s−1. Certain quinoa varieties that have inherently higher leaf stomatal conductance to water vapor are capable of retaining higher photosynthesis rates [45]. While we did not measure ABA concentrations in the root or xylem, it appears that both varieties showed common drought responses with a decrease in leaf stomatal conductance and net photosynthetic rate. Interestingly, Ollague appeared to tolerate the high water stress treatment better than Ingapirca, which may have resulted from higher ABA production in Ollague, manifest by higher leaf stomatal conductance and a higher net photosynthesis rate. Lowering water potentials is another mechanism by which Altiplano Salares ecotypes may avoid water stress. Vacher [9] showed that Altiplano Salares ecotypes under water stress had leaf water potential below −4.0 MPa accompanied by decreased stomatal conductance and photosynthesis rate. Our results indicated that Salares ecotypes (represented by variety Ollague,) exhibited significantly reduced stem water potential level (−2.97 MPa) under drought conditions when compared to the valley ecotype (represented by variety Ingapirca) (−1.95 MPa). Tapia [46] reported that ecotypes from the Altiplano, specifically Salares ecotypes of Southern Bolivia, usually mature at 1.0 - 1.8 m height whereas the ecotypes from the valley regions grow to be 2 - 4 m. In our experiments, Ollague plants were significantly smaller at the eight-leaf stage when compared to the Ingapirca. A slower growth rate may represent a coping mechanism that allows Salares ecotypes to tolerate water-limited environments (<200 mm yearly rainfall) of the Altiplano.
4.2. Transcriptome Assembly and Expression Analysis
The development of next-generation sequencing (NGS) technology has made possible cost-effective characterization of non-model plant transcriptomes [47,48]. We combined the Illumina Hi-Seq reads generated in this study with those developed through 454-pyrosequencing and Sanger sequencing to produce a reference root transcriptome for quinoa. Incorporation of reads from different NGS technologies with different read length and read depths created a long backbone of the transcriptional units while shorter read sequences improve accuracy of the assembly by providing sequencing depth coverage. Digital gene expression analysis, also termed RNA-seq, is one of many applications that can be performed using deep transcriptome sequencing [49]. Using edgeR we were able to identify differentially expressed genes based on variety, treatment, and the variety × treatment interaction—indicating that it was a useful statistical method for detecting DE contigs in this study.
4.3. Biological Insight
Plants in general respond to water-deficit conditions through a series of complex cellular, molecular, and physiological processes. Shinozaki and Yamaguchi-Shinozaki [50] explained that the roles gene products play in conferring drought tolerance can be classified as
 (a)
(a)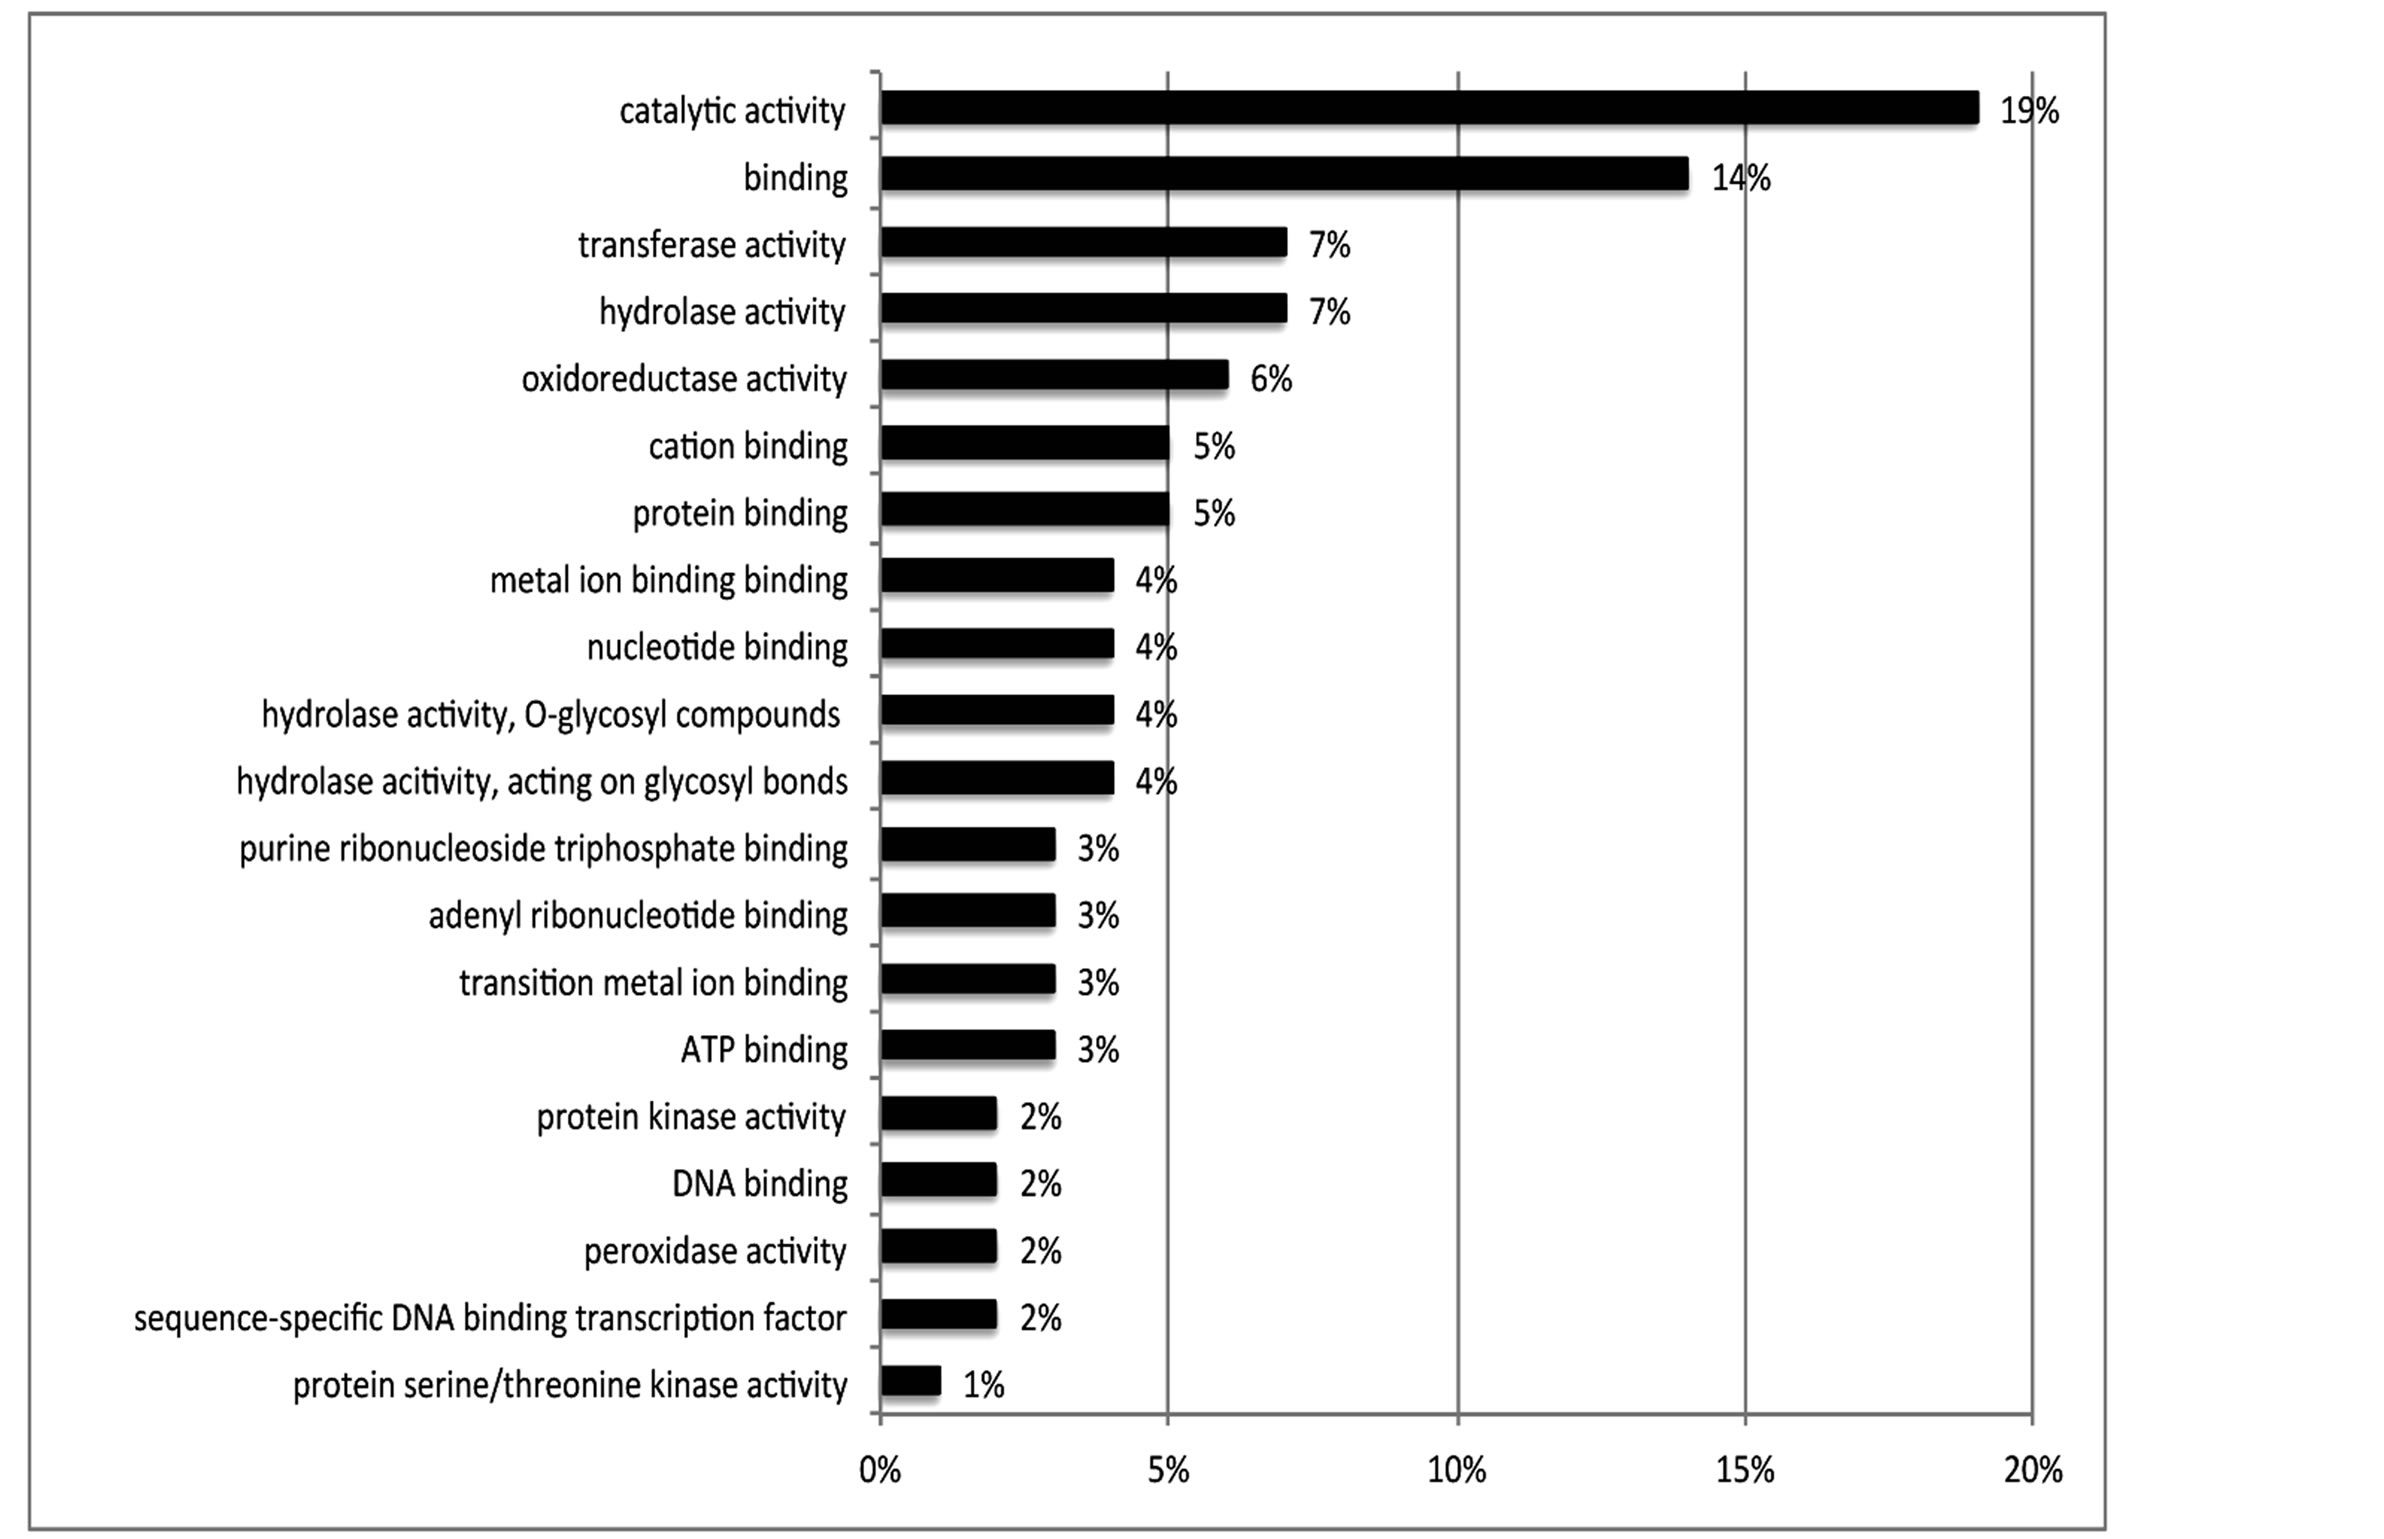 (b)
(b)
Figure 3. Distribution of 462 DE genes that were differentially expressed based on treatment according to GO annotation. a: Biological Process (BP); b: Molecular Function (MF).
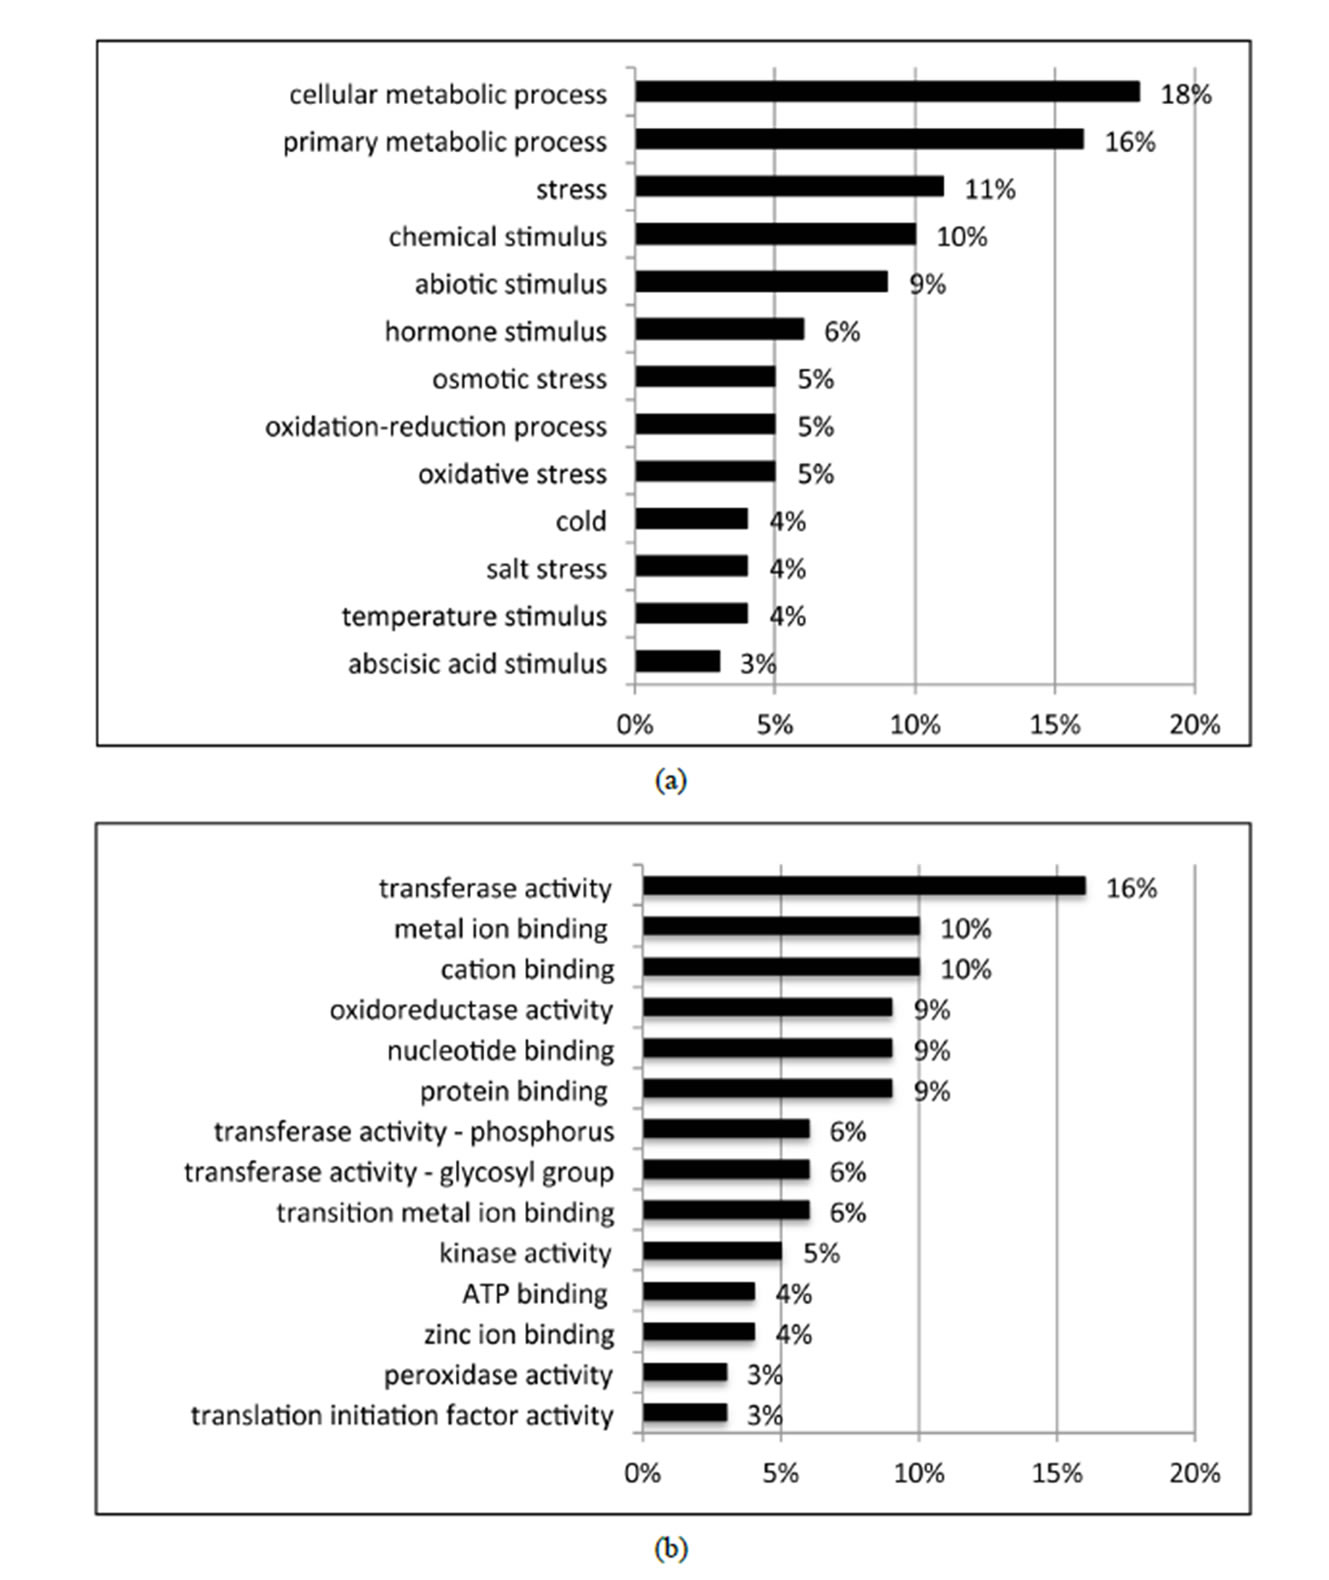
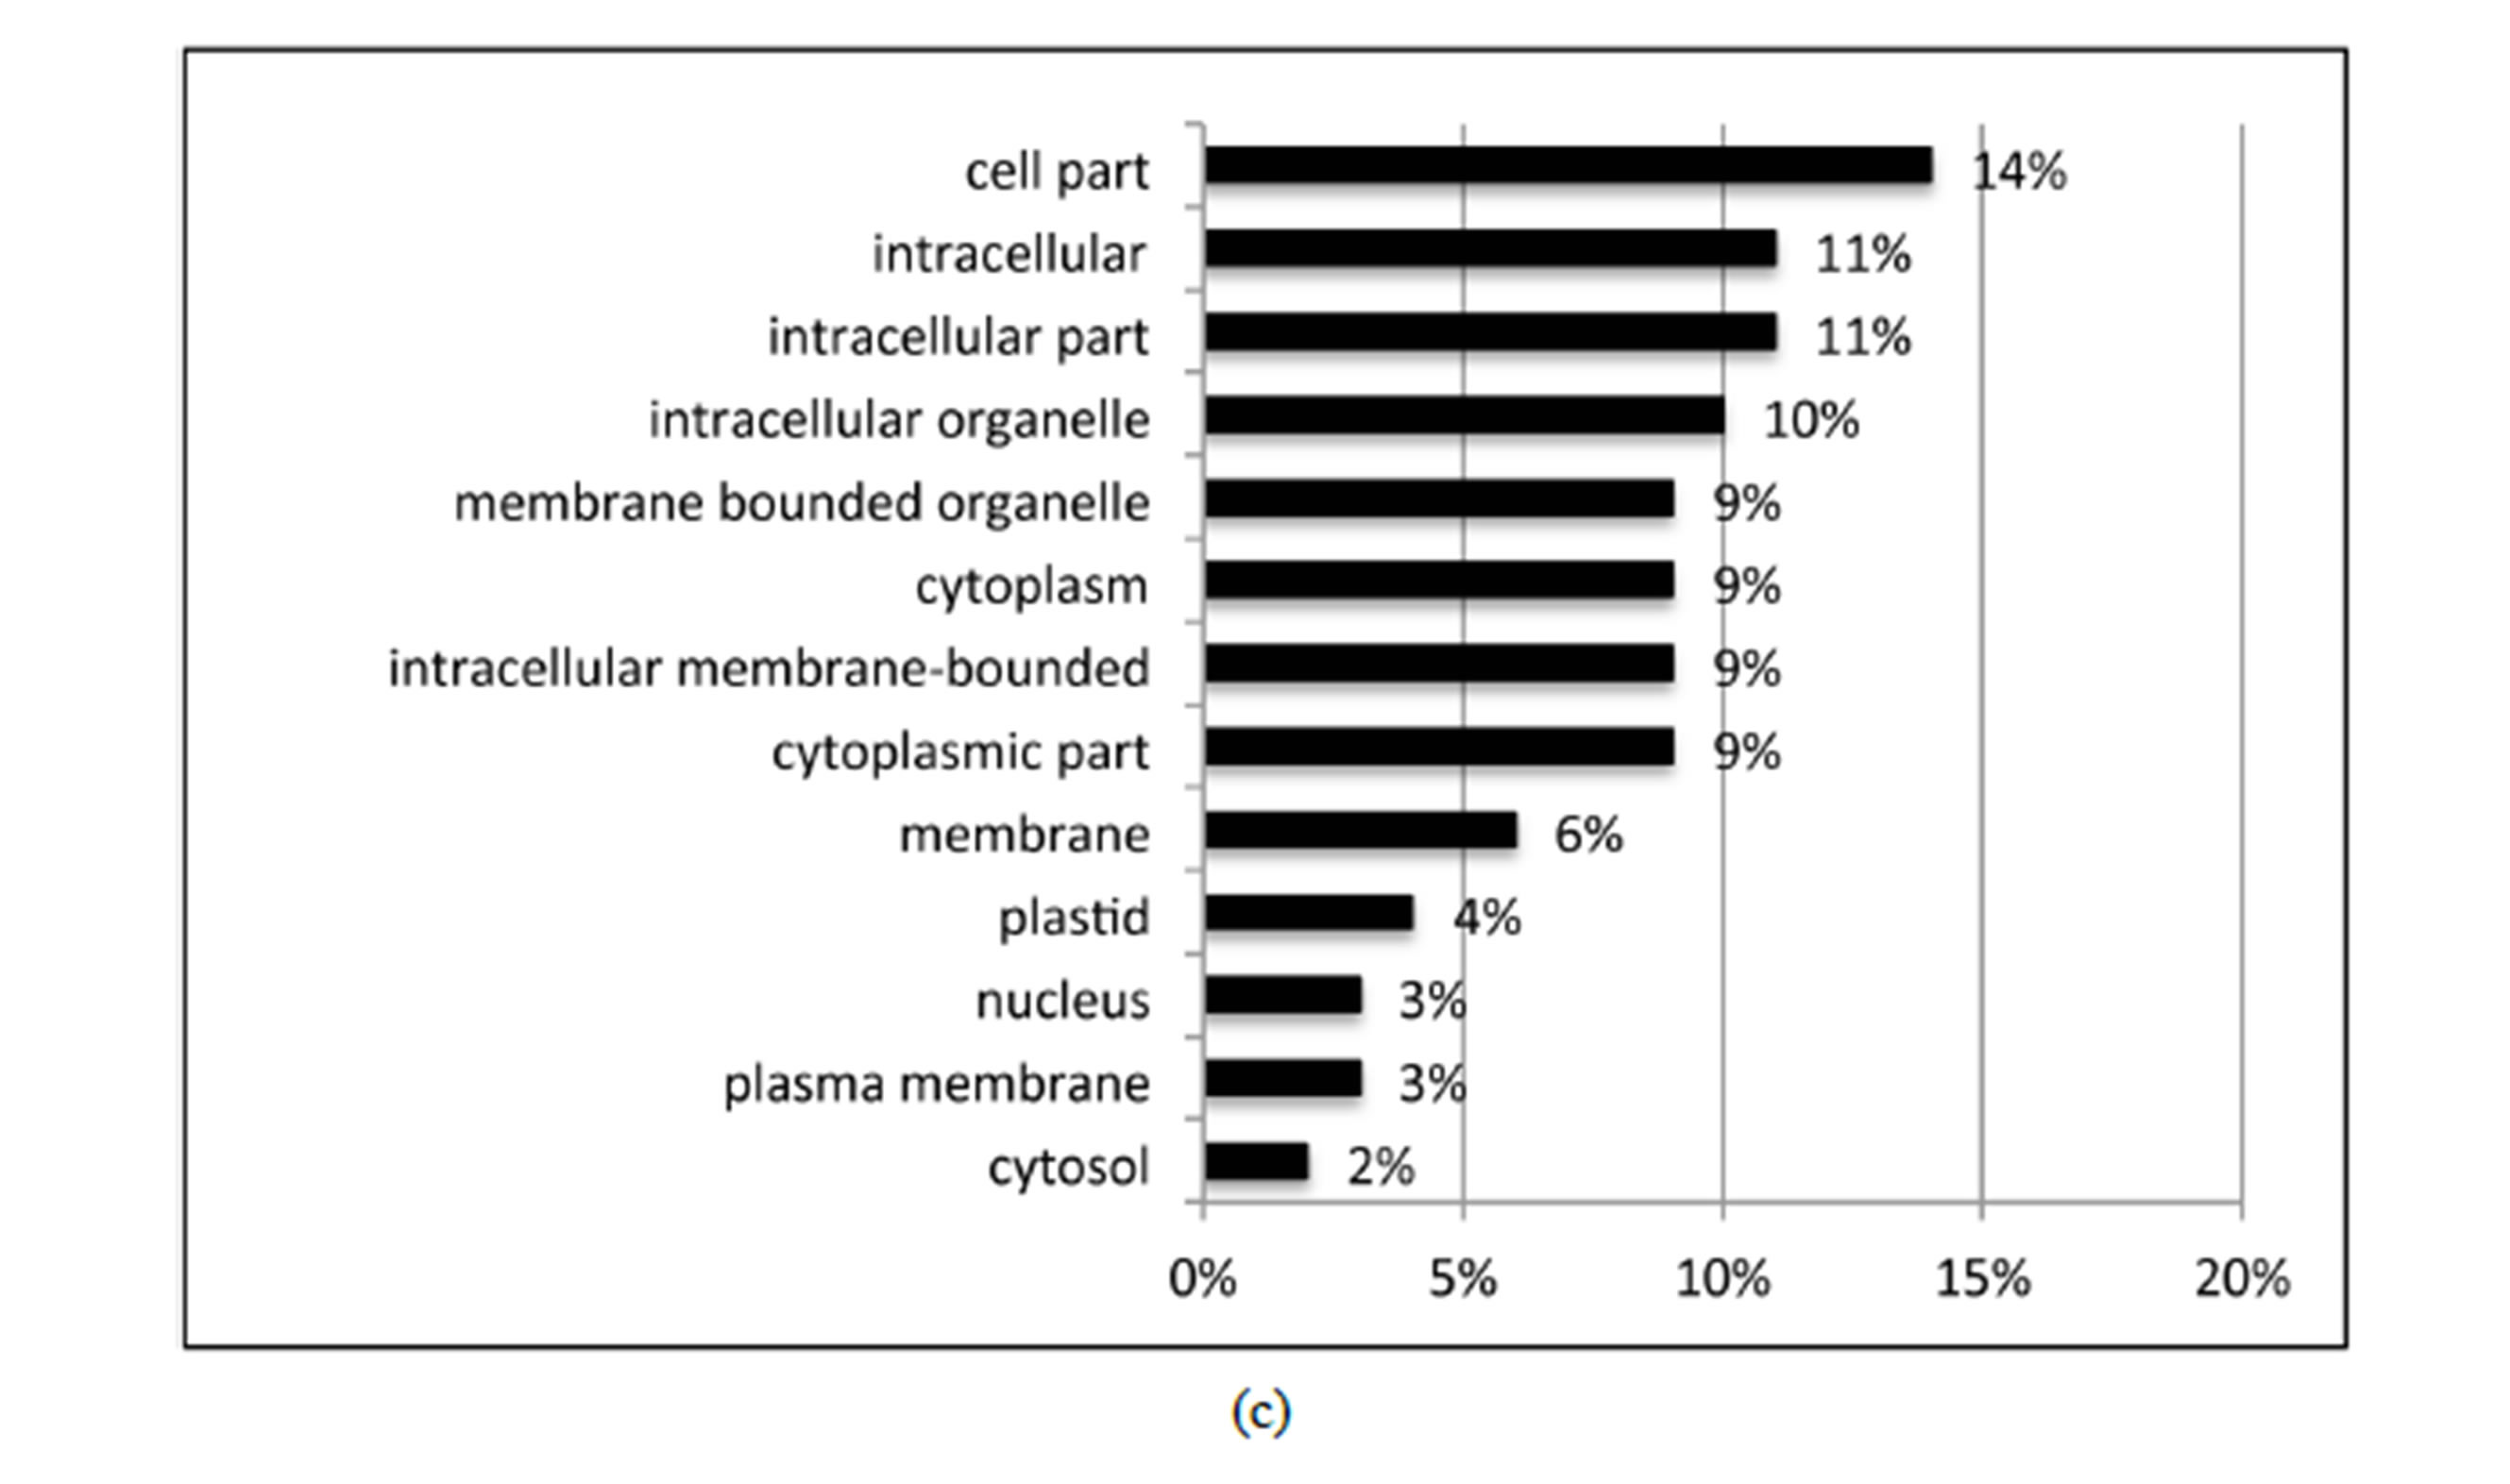
Figure 4. Distribution of the 27 DE genes that were differential expressed based on the variety × treatment interaction in the three main GO categories. a: Biological process (BP); b: Molecular function (MF); c: Cellular component (CC).
functional or regulatory. While regulatory proteins are responsible for signal transduction and response signaling, functional proteins confer cell maintenance, cell protection, and damage repair through proteins such as chaperones, late embryogenesis abundant (LEA) proteins, water channel proteins, etc. [51].
At least two of the 27 interaction DE genes identified in this study can be classified as having regulatory functions, including one whose inferred polypeptide product showed high amino acid sequence homology to Naringenin, 2-oxogluturate 3-dioxygenase (comp42593_c0_seq1) and one which showed high amino acid sequence homology with a receptor-like cytosolic serine threonineprotein kinase rbk1-like protein (comp1839_c0_seq1). The function of Naringenin, 2-oxogluturate 3-dioxygenase is to catalyze the 3-beta-hydroxylation of 2S-flavanones to 2R, 3R-dihydroflavenols which are intermediates in the biosynthesis of flavonoids in plants. Hernández et al. [52] showed that in Cistus clusil and other Mediterranean plants, tolerance to drought-like conditions is in part due to flavonoids contributing to the ntioxidant defense. Similarly, SnRK2.6/OST1 (OPEN STOMATA 1) is a specific serine threonine-protein kinase that has been implicated in drought-tolerance in Arabidopsis thaliana [53]. Contig comp56807_c0_seq1, which was overly expressed in Ollague, is a potential functional protein that has high homology with a putative chaperone-1-like protein that is known to function in response to high light intensity and heat in Zea mays [54]. Other gene products that showed high sequence homology in our BLAST searches were comp44207_c0_seq1 and comp38166_c0_seq1; both of which are associated with secologanin synthase, an enzyme that belongs to the family of oxidoreductases [55]. We also identified signal transducers, such as heat-shock proteins (contig comp 42870_c0_seq1) that appeared in greatest abundance in the high water stress treatment Ollague samples. These heat shock proteins may be related to indirect stress brought about by water deficiencies such as oxidative stress due to accumulation of reactive oxygen species (ROS) [56]. Homologs of both contig comp31939_c0_ seq1, which was expressed at higher levels in Ollague, and contig comp56526_c0_seq1, which was expressed at higher levels in Ingapirca, respond to oxidation stress and showed lower expression levels in the high water stress treatment suggesting a potential role in protecting the plant from the effects of ROS. Finally, a pathogenesisrelated gene protein (contig comp1469_c0_seq1) was overly expressed in Ollague in the severe drought-like treatment. Kitajima and Sato [57] reported that pathogennesis-related proteins are induced by hormones or ROS in response to biotic stress, while more recently Przymusinski et al. [58] showed that an increase of these proteins can be induced as a response to various abiotic stresses.
5. Conclusion
We report the first large transcriptome analysis of water stress in C. quinoa. Our greenhouse results support previous observations that Salares ecotypes display greater tolerance to drought-like stress conditions than the valley ecotypes, as determined by several phenotypic measurements: growth rates, photosynthetic rates, stomatal conductance, and stem water potential. A de novo assembly of the root transcriptome generated across two varieties and four water treatments generated 20,337 unique transcripts. Gene expression analysis of the RNA-seq data identified 462 putative gene products that showed differrential expression based on treatment and 27 differentially expressed putative gene products based on variety × treatment interaction, including significant increases in expression in root tissue in response to increasing water stress. BLAST searches and gene ontology analysis show an overlap with drought tolerance stress and other abiotic stress mechanisms, suggesting an overlap in response to abiotic and biotic stresses.
Acknowledgements
This research was supported by a grant from the McKnight Foundation ((No. 09-1204). We gratefully acknowledge S. St. Clair and V. D. Jolley (Brigham Young University) for their expertise in experimental design and analysis. We thank J. C. Raney and L. Soliai (Brigham Young University) for their help in data collection.
REFERENCES
- H. W. Koyro and S. S. Eisa, “Effect of Salinity on Composition, Viability and Germination of Seeds of Chenopodium Quinoa Willd,” Plant Soil, Vol. 302, No. 1-2, 2008, pp. 79-90. http://dx.doi.org/10.1007/s11104-007-9457-4
- S. E. Jacobsen, “The Worldwide Potential for Quinoa (Che- nopodium Quinoa Willd),” Food Reviews International, Vol. 19, No. 1-2, 2003, pp. 167-177. http://dx.doi.org/10.1081/FRI-120018883
- M. Tapia, H. Gandarillas, S. Alandia, A. Cardozo, A. Mujica, R. Ortiz, et al., “Quinoa y Kañahua: Cultivos Andinos,” CIID-IICA, Bogotá, 1979.
- S. G. Wood, L. D. Lawson, D. J. Fairbanks, L. R. Robison and W. R. Andersen, “Seed Lipid Content and Fatty Acid Composition of Three Quinoa Cultivars,” Journal of Food Composition and Analysis, Vol. 6, No. 1, 1993, pp. 41-44.
- P. M. Ruas, A. Bonifacio, C. F. Ruas, D. J. Fairbanks and W. R. Andersen, “Genetic Relationship among 19 Accessions of Six Species of Chenopodium L., by Random Amplified Polymorphic DNA Fragments (RAPD),” Euphytica, Vol. 105, No. 1999, pp. 25-32.
- J. Ruales and B. M. Nair, “Content of Fat, Vitamins and Minerals in Quinoa (Chenopodium Quinoa, Willd) Seeds,” Food Chemistry, Vol. 48, No. 2, 1993, pp. 131-136.
- United Nations, “The Food and Agriculture Organization: International Year of Quinoa: 2013,” United Nations General Assembly 66th Session, 2011. http://www.un.org/ga/search/view_doc.asp?symbol=A/C.2/66/L.19
- S. A. Valencia-Chamorro, “Quinoa,” In: B. Caballero, Ed., Encyclopedia of Food Science and Nutrition, Academic Press, Waltham, 2003, pp. 4895-4902. http://dx.doi.org/10.1016/B0-12-227055-X/00995-0
- J. J. Vacher, “Responses of Two Main Andean Crops, Quinoa (Chenopodium quinoa Willd.) and Papa Amarga (Solanum juzepczukii Buk.) to Drought on the Bolivian Altiplano: Significance of Local Adaptation,” Agriculture, Ecosystems & Environment, Vol. 68, No. 1-2, 1998, pp. 99-108. http://dx.doi.org/10.1016/S0167-8809(97)00140-0
- F. E. Prado, C. Boero, M. Gallardo and J. A. Gonzalez, “Effect of Nacl on Germination, Growth, and Soluble Sugar Content in Chenopodium quinoa Willd. Seeds,” Botanical Bulletin of Academia Sinica, Vol. 41, No. 1, 2000, pp. 27-34.
- S. E. Jacobsen, C. Monteros, L. J. Corcuera, L. A. Bravo, J. L. Christiansen and A. Mujica, “Frost Resistance Mechanisms in Quinoa (Chenopodium quinoa Willd.),” European Journal of Agronomy, Vol. 26, No. 4, 2007, pp. 471-475. http://dx.doi.org/10.1016/j.eja.2007.01.006
- C. J. Risi and N. W. Galwey, “The Chenopodium Grains of the Andes: Inca Crops for Modern Agriculture,” Advances in Applied Biology, Vol. 10, 1984, pp. 145-216.
- H. Gandarillas, “Quinoa y Kañiwa: Cultivos Andinos. Bo- gotá,” Instituto Interamericano de Ciencias Agrícolas, Colombia, 1979.
- J. S. Boyer, “Plant Productivity and Environment,” Science, Vol. 218, No. 4571, 1982, pp. 443-448. http://dx.doi.org/10.1126/science.218.4571.443
- D. Bartels and D. Nelson, “Approaches to Improve Stress Tolerance Using Molecular Genetics,” Plant, Cell & Environment, Vol. 17, No. 5, 1994, pp. 659-667. http://dx.doi.org/10.1111/j.1365-3040.1994.tb00157.x
- E. R. Cook, R. Seager, M. A. Cane and D. W. Stahle, “North American Drought: Reconstructions, Causes, and Consequences,” Earth-Science Reviews, Vol. 81, No. 1-2, 2007, pp. 93-134. http://dx.doi.org/10.1016/j.earscirev.2006.12.002
- US, “Drought 2012: Farm and Food Impacts,” http://www.ers.usda.gov/newsroom/us-drought-2012-farm-and-food-impacts.aspx
- A. Lowry and R. Nixon, “Severe Drought Seen as Driving Cost of Food up,” New York Times, 2012. http://www.nytimes.com/2012/07/26/business/food-prices-to-rise-in-wake-of-severe-drought.html
- S. E. Jacobsen, “The Worldwide Potential for Quinoa (Chenopodium quinoa Willd.),” Food Reviews International, Vol. 19, No. 1-2, 2003, pp. 167-177.
- B. R. Trognitz, “Prospects of Breeding Quinoa for Tolerance to Abiotic Stress,” Food Reviews International, Vol. 19, No. 1-2, 2003, pp. 129-137.
- J. A. Kreps, Y. Wu, H.-S. Chang, T. Zhu, X. Wang and J. F. Harper, “Transcriptome Changes for Arabidopsis in Response to Salt, Osmotic, and Cold Stress,” Plant Physiology, Vol. 130, No. 4, 2002, pp. 2129-2141. http://dx.doi.org/10.1104/pp.008532
- R. Kawaguchi, T. Girke, E. A. Bray and J. Bailey-Serres, “Differential mRNA Translation Contributes to Gene Regulation under Non-Stress and Dehydration Stress Conditions in Arabidopsis Thaliana,” Plant Journal, Vol. 38, No. 5, 2004, pp. 823-839. http://dx.doi.org/10.1111/j.1365-313X.2004.02090.x
- J. G. Dubouzet, Y. Sakuma, Y. Ito, M. Kasuga, E. G. Dubouzet, S. Miura, et al., “Osdreb Genes in Rice, Oryza sativa L., Encode Transcription Activators That Function in Drought-, High-Saltand Cold-Responsive Gene Expression,” Plant Journal, Vol. 33, No. 4, 2003, pp. 751- 763. http://dx.doi.org/10.1046/j.1365-313X.2003.01661.x
- M. Gorantla, P. R. Babu, V. B. R. Lachagari, F. A. Feltus, A. H. Paterson and A. R. Reddy, “Functional Genomics of Drought Stress Response in Rice: Transcript Mapping of Annotated Unigenes of an Indica Rice (Oryza sativa L. Cv. Nagina 22),” Current Science India, Vol. 89, No. 3, 2005, pp. 496-514.
- C. D. Buchanan, S. Y. Lim, R. A. Salzman, L. Kagiampakis, D. T. Morishige, B. D. Weers, et al., “Sorghum Bicolor’s Transcriptome Response to Dehydration, High Salinity and ABA,” Plant Molecular Biology, Vol. 58, No. 5, 2005, pp. 699-720. http://dx.doi.org/10.1007/s11103-005-7876-2
- P. J. Maughan, T. B. Turner, C. E. Coleman, D. B. Elzinga, E. N. Jellen, J. A. Morales, et al., “Characterization of Salt Overly Sensitive 1 (SOS1) Gene Homoeologs in Quinoa (Chenopodium quinoa Wilid.),” Genome, Vol. 52, No. 7, 2009, pp. 647-657. http://dx.doi.org/10.1139/G09-041
- A. J. Morales, P. Bajgain, Z. Garver, P. J. Maughan and J. A. Udall, “Evaluation of the Physiological Responses of Chenopodium quinoa to Salt Stress,” International Journal of Plant Physiology and Biochemistry, Vol. 3, No. 13, 2011, pp. 219-232.
- S. L. Mason, M. R. Stevens, E. N. Jellen, A. Bonifacio, D. J. Fairbanks, C. E. Coleman, et al., “Development and Use of Microsatellite Markers for Germplasm Characterization in Quinoa (Chenopodium quinoa Willd.),” Crop Science, Vol. 45, No. 4, 2005, pp. 1618-1630. http://dx.doi.org/10.2135/cropsci2004.0295
- M. Nagata and I. Yamashita, “Simple Method for Simultaneous Determination of Chlorophyll and Carotenoids in Tomato Fruit,” Japan Society of Nutrition and Food Science, Vol. 39, No. 10, 1992, pp. 925-928.
- R. Development Core Team, “R: A Language and Environment for Statistical Computing,” Version 2.15.1, 2012.
- H. J. Earl, “A Precise Gravimetric Method for Simulating Drought Stress in Pot Experiments,” Crop Science, Vol. 43, No. 5, 2003, pp. 1868-1873. http://dx.doi.org/10.2135/cropsci2003.1868
- M. G. Grabherr, B. J. Haas, M. Yassour, J. Z. Levin, D. A. Thompson, I. Amit, et al., “Full-Length Transcriptome Assembly from RNA-Seq Data without a Reference Genome,” Nature Biotechnology, Vol. 29, No. 7, 2011, pp. 644-652. http://dx.doi.org/10.1038/nbt.1883
- T. D. Wu and S. Nacu, “Fast and Snp-Tolerant Detection of Complex Variants and Splicing in Short Reads,” Bioinformatics, Vol. 26, No. 7, 2010, pp. 873-881. http://dx.doi.org/10.1093/bioinformatics/btq057
- A. Mortazavi, B. A. Williams, K. Mccue, L. Schaeffer and B. Wold, “Mapping and Quantifying Mammalian Transcriptomes by RNA-Seq,” Nature Methods, Vol. 5, No. 7, 2008, pp. 621-628. http://dx.doi.org/10.1038/nmeth.1226
- M. D. Robinson, D. J. McCarthy and G. K. Smyth, “Edger: A Bioconductor Package for Differential Expression Analysis of Digital Gene Expression Data,” Bioinformatics, Vol. 26, No. 1, 2010, pp. 139-140. http://dx.doi.org/10.1093/bioinformatics/btp616
- Y. Benjamini and Y. Hochberg, “Controlling the False Discovery Rate—A Practical and Powerful Approach to Multiple Testing,” Journals of the Royal Statistical Society, Vol. 57, No. 1, 1995, pp. 289-300.
- S. F. Altschul, T. L. Madden, A. A. Schaffer, J. H. Zhang, Z. Zhang, W. Miller, et al., “Gapped Blast and Psi-Blast: A New Generation of Protein Database Search Programs,” Nucleic Acids Research, Vol. 25, No. 17, 1997, pp. 3389- 3402. http://dx.doi.org/10.1093/nar/25.17.3389
- S. Gotz, J. M. Garcia-Gomez, J. Terol, T. D. Williams, S. H. Nagaraj, M. J. Nueda, et al., “High-Throughput Functional Annotation and Data Mining with the Blast2Go Suite,” Nucleic Acids Research, Vol. 36, No. 10, 2008, pp. 3420-3435. http://dx.doi.org/10.1093/nar/gkn176
- N. Bluthgen, K. Brand, B. Cajavec, M. Swat, H. Herzel and D. Beule, “Biological Profiling of Gene Groups Utilizing Gene Ontology,” Genome Informatics International Conference on Genome Informatics, Vol. 16, No. 1, 2005, pp. 106-115.
- H. Ogata, S. Goto, K. Sato, W. Fujibuchi, H. Bono and M. Kanehisa, “Kegg: Kyoto Encyclopedia of Genes and Genomes,” Nucleic Acids Research, Vol. 27, No. 1, 1999, pp. 29-34. http://dx.doi.org/10.1093/nar/27.1.29
- X. Chone, C. van Leeuwen, D. Dubourdieu and J. P. Gaudillere, “Stem Water Potential Is a Sensitive Indicator of Grapevine Water Status,” Annals of Botany—London, Vol. 87, No. 4, 2001, pp. 477-483. http://dx.doi.org/10.1006/anbo.2000.1361
- D. Reynolds, “Genetic Dissection of Triterpenoid Saponin Production in Chenopodium quinoa Using Microarray Analysis,” M.S. Thesis, Brigham Young University, Provo, 2009.
- S. E. Jacobsen, F. L. Liu and C. R. Jensen, “Does RootSourced Aba Play a Role for Regulation of Stomata under Drought in Quinoa (Chenopodium quinoa Willd.),” Scientia Horticulturae—Amsterdam, Vol. 122, No. 2, 2009, pp. 281-287. http://dx.doi.org/10.1016/j.scienta.2009.05.019
- C. R. Jensen, S. E. Jacobsen, M. N. Andersen, N. Nunez, S. D. Andersen, L. Rasmussen, et al., “Leaf Gas Exchange and Water Relation Characteristics of Field Quinoa (Chenopodium quinoa Willd.) during Soil Drying,” European Journal of Agronomy, Vol. 13, No. 1, 2000, pp. 11-25. http://dx.doi.org/10.1016/S1161-0301(00)00055-1
- J. A. Gonzalez, M. Bruno, M. Valoy and F. E. Prado, “Ge- notypic Variation of Gas Exchange Parameters and Leaf Stable Carbon and Nitrogen Isotopes in Ten Quinoa Cultivars Grown under Drought,” Journal of Agronomy and Crop Science, Vol. 197, No. 2, 2011, pp. 81-93. http://dx.doi.org/10.1111/j.1439-037X.2010.00446.x
- M. E. Tapia, “Origen, Distribución Geográfica y Sistemas de Producción de la Quinua,” In: PISCA-UNTA-IBTAIICA-CIID, Ed., Reunión Sobre Genética Y Fitomejoramiento de la Quinua, Puno, 1980.
- J. C. Vera, C. W. Wheat, H. W. Fescemyer, M. J. Frilander, D. L. Crawford, I. Hanski, et al., “Rapid Transcriptome Characterization for a Nonmodel Organism Using 454 Pyrosequencing,” Molecular Ecology, Vol. 17, No. 7, 2008, pp. 1636-1647. http://dx.doi.org/10.1111/j.1365-294X.2008.03666.x
- R. Ekblom and J. Galindo, “Applications of Next Generation Sequencing in Molecular Ecology of Non-Model Organisms,” Heredity, Vol. 107, No. 1, 2011, pp. 1-15. http://dx.doi.org/10.1038/hdy.2010.152
- M. L. Metzker, “Sequencing Technologies—The Next Generation,” Nature Reviews Genetics, Vol. 11, No. 1, 2010, pp. 31-46. http://dx.doi.org/10.1038/nrg2626
- K. Shinozaki and K. Yamaguchi-Shinozaki, “Gene Networks Involved in Drought Stress Response and Tolerance,” Journal of Experimental Botany, Vol. 58, No. 2, 2007, pp. 221-227. http://dx.doi.org/10.1093/jxb/erl164
- K. Shinozaki, K. Yamaguchi-Shinozaki and M. Seki, “Regulatory Network of Gene Expression in the Drought and Cold Stress Responses,” Current Opinion in Plant Biology, Vol. 6, No. 5, 2003, pp. 410-417. http://dx.doi.org/10.1016/S1369-5266(03)00092-X
- I. Hernandez, L. Alegre and S. Munne-Bosch, “DroughtInduced Changes in Flavonoids and Other Low Molecular Weight Antioxidants in Cistus clusii Grown under Mediterranean Field Conditions,” Tree Physiology, Vol. 24, No. 11, 2004, pp. 1303-1311. http://dx.doi.org/10.1093/treephys/24.11.1303
- C. Yunta, M. Martinez-Ripoll and A. Albert, “Snrk2.6/ Ost1 from Arabidopsis Thaliana: Cloning, Expression, Purification, Crystallization and Preliminary X-Ray Analysis of K50n and D160a Mutants,” Acta Crystallographica Section F, Structural Biology and Crystallization Communications, Vol. 67, No. 3, 2011, pp. 364-368. http://dx.doi.org/10.1107/S1744309110053807
- G. Lopez-Frias, L. M. Martinez, G. Ponce, G. I. Cassab and J. Nieto-Sotelo, “Role of Hsp101 in the Stimulation of Nodal Root Development from the Coleoptilar Node by Light and Temperature in Maize (Zea mays L.) Seedlings,” Journal of Experimental Botany, Vol. 62, No. 13, 2011, pp. 4661-4673. http://dx.doi.org/10.1093/jxb/err186
- H. Yamamoto, N. Katano, A. Ooi and K. Inoue, “Secologanin Synthase Which Catalyzes the Oxidative Cleavage of Loganin into Secologanin Is a Cytochrome P450,” Phytochemistry, Vol. 53, No. 1, 2000, pp. 7-12. http://dx.doi.org/10.1016/S0031-9422(99)00471-9
- J. L. Martindale and N. J. Holbrook, “Cellular Response to Oxidative Stress: Signaling for Suicide and Survival,” Journal of Cellular Physiology, Vol. 192, No. 1, 2002, pp. 1-15. http://dx.doi.org/10.1002/jcp.10119
- S. Kitajima and F. Sato, “Plant Pathogenesis-Related Proteins: Molecular Mechanisms of Gene Expression and Protein Function,” The Journal of Biochemistry—Tokyo, Vol. 125, No. 1, 1999, pp. 1-8. http://dx.doi.org/10.1093/oxfordjournals.jbchem.a022244
- R. Przymusinski, R. Rucinska and E. A. Gwozdz, “Increased Accumulation of Pathogenesis-Related Proteins in Response of Lupine Roots to Various Abiotic Stresses,” Environmental and Experimental Botany, Vol. 52, No. 1, 2004, pp. 53-61. http://dx.doi.org/10.1016/j.envexpbot.2004.01.006
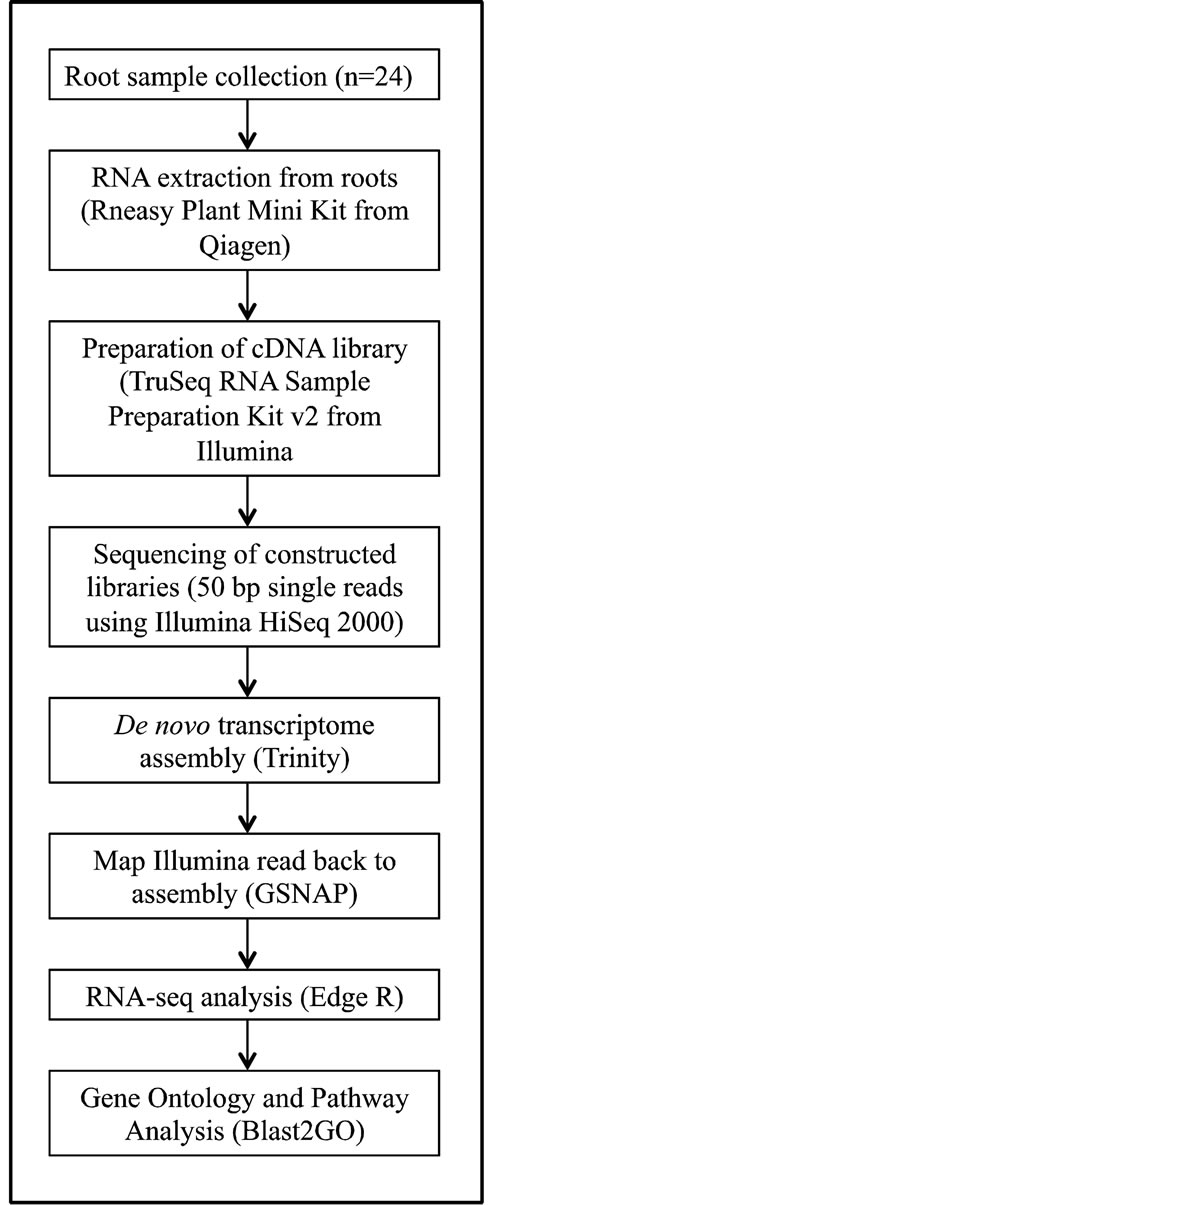
Supplemental Figure 1. Flowchart of cDNA preparation, sequencing and RNA-seq analysis.
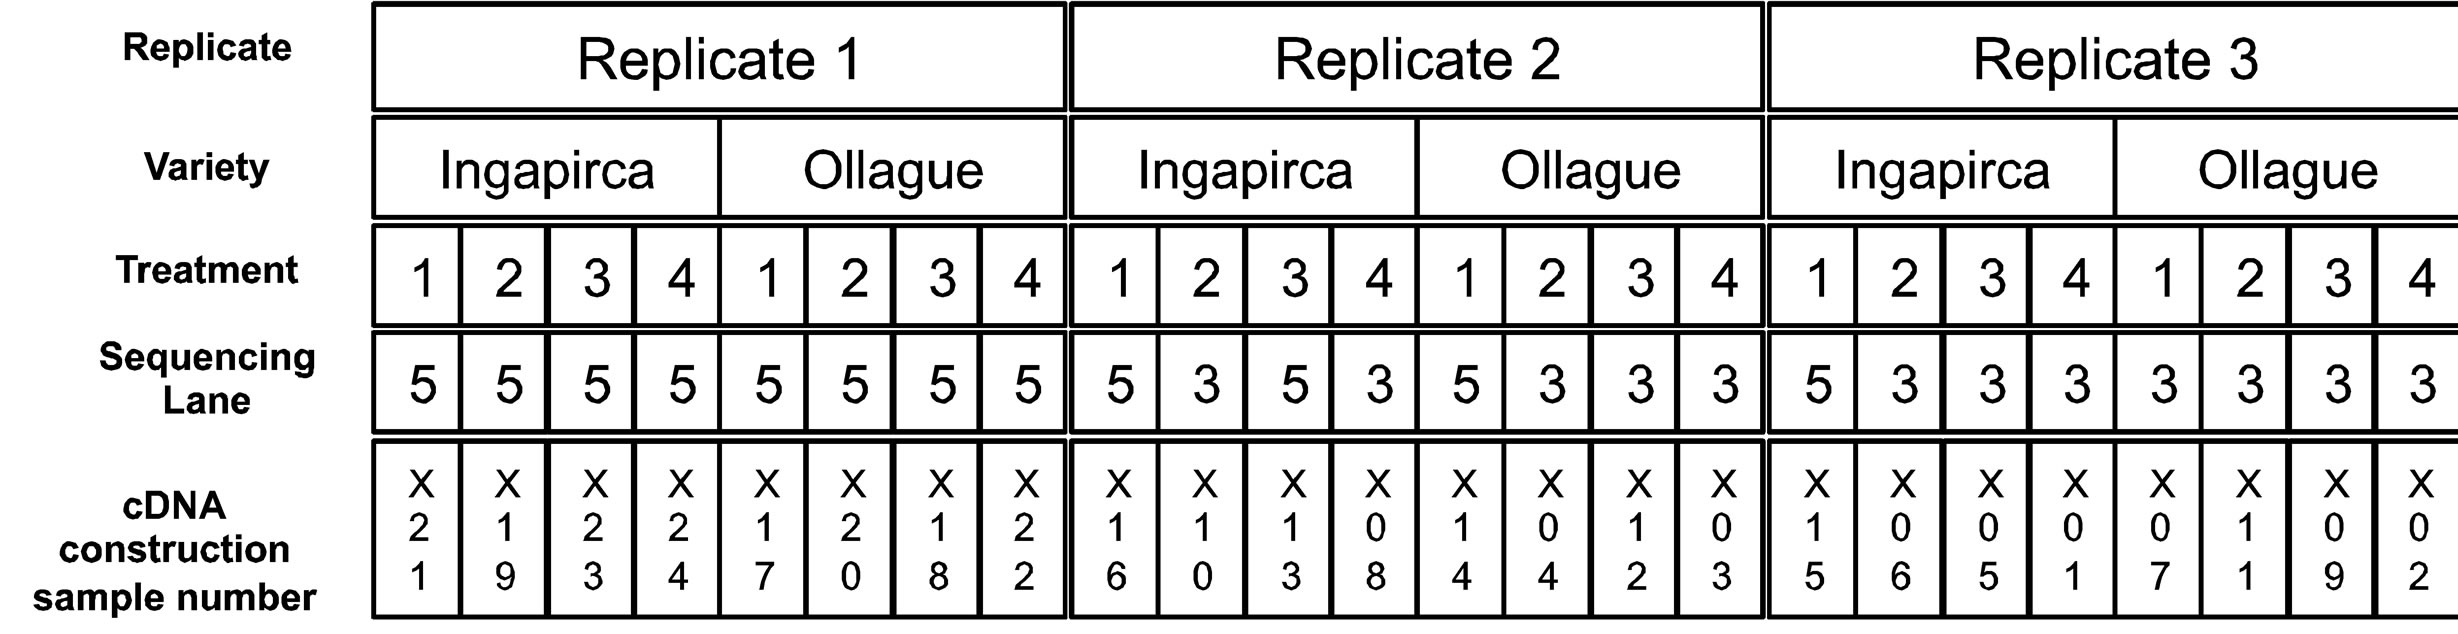
Supplemental Figure 2. Experimental design, cDNA preparation and sequence layout. Each replicate consisted of both Ingapirca and Ollague varieties that were subjected to one of four water stress treatments, including a 100% field capacity (1), 50% field capacity (2); 30% field capacity (3); 10% field capacity (4). RNA was extracted from root tissue and synthesized into cDNA libraries (resulting in 24 total cDNA library samples). A unique adaptor was attached to each cDNA allowing 12 libraries to sequenced on the Illumina HiSeq 2000.The reads have been made publically available through NCBI’s Sequence Read Archive (GenBank SRA #SRR799899 and SRR799901).
- Supplemental Table 1. Sequences of the 27 differentially expressed genes based on variety × treatment interaction that were identified via edgeR. >comp1018_c0_seq1 TGACAACTTACCTTCAATTGTTTTTTGTGTTGCTTCCTTTGTAAGTGTTGGCTGATTTAGGATACTCTCAGTAACTGAGTGTACTACCTTACTAATATCAGCATCAACACCCTAGTTTTTAGCATCTTTCTCTCCCTGATTATCAGCATCAACATTCTGATTATCAGCATCTTTCTCTCCTTTCTCTTCATTCTTCTCTTCTTTCTTTTTATTATTCTTTTTTTGCTCCACCTTCTTTAGTTTTTTTTTATAATACAAAGTAATATTATTTATTCATCAACCCGGAACAAATATTGTACACAGTACACATGCTCACACCCTCAAGGCCTCAATTATTCTCTATAGAAAAAGTGTGAAACCCTCACAAATTAAAAAATTAAATAATTAAACAAATAAAAGAAAGGAATGAAGCTAAAATTAGACTTTTGATACAAACAAACTTAAAAATTACACAAGAATTTATTCATGTCTACGAGTACAATACAAGTATGCAACACAGTATTTTAATTATCTTTGATTTTGAATTAATTCAATAAATGCTTATCAGATCAGCTTATCGCGTCATGCCTCCTGCCATTGATGGAGGTACCATCCCCTGGTTTTTCCTCTCCTCATTACCTTGCCATCCGAGGGCAAGATCATAGCCACGATGTTGAAGTTCACGGTACTCTTGGCACAAGGCACAAGCTTCACACCAAAAGTGAGTACAACAATCTCCACAACTATTCTCTGGCATTCCAAGTTGAGCCTTCAACTTTGAACGATAAGTGCATGAATATATCCATTGACATCCAGTCAATACCAAAAGTAGTGAATACAATGCTCCACTTACACCACATGATGATGAACCTTTGTCAACAATCTCTGCTATACGTCCAAAAGTGATGCATGGGCACCAACATGTCATACAACAAAGAGAACAATCAGAGAAACAATCACAAAGACCACTAGAGAACTCTCCAGCAATTGCAACTGATTGATTTGGTGGAGCTGAAATTGGAACACCAATTGCATGTTGATGATCTTGCTTCATGTTTTTATTATCTAGAAATAATAATTGTACACGAAAAATAAATGTAACGTTTATTAAGTTTCTACTTTGTAAAAAAATG >comp1469_c0_seq1 GGAGTACCACATATATAAAATTAAGTGAATTTCACTAAAAAAAGATCTAGTGAGCTTATTCCAATTCACTCTTTATTATAACAACATGAAGTTAAAGGAAAGGTTTAAAAGAGATACATATATATCATATTGATCATATATTATTATTATTATTATTCCAAGGTTGTTCTCAGTTTATTGAGAATTAGTCGTTAATTTTATCAAAACATTTAGTAAGGTTTCTGGCCAACCCAATTGCCTGGAGGATCATAGTTACATGTAACGAAATAACCTCCATTGTTACATTGAACCCTAGCACATCCTAGACGAACCGAGTTACGCCAAACCACTTGAGTATAA >comp1792_c0_seq1 TTTAGTTTAGGGTAAGGGGAAAGTTACAAAAAAAAAGGAAAAGGGTAAAAGTTAAAAAGCCAAAAAGAAGAAAGGAACAACGCTTCTGACCTTGCTGTCATCGCGAAATCTTTCTTCTGAAATGAAGCAGGCCGAGGTTGAGAAAATAAAAACCACACAAATTTGATTCAACAATGGATATAAAAGGCTTCTTCAATCCAATCATATGATTGATTCGACAATGGATATGTGAGGGTTTAATCAAATCATATTGTGACAATGTGTAAAAAATGTACACTTGCCGGTGAGCTGTAGATAAGTGGTTCAATCAGGTAAAGGTGACTTAATGGATCAATGCTGCTATAATTGTAGGTAAATCTAATGGAAGGAAAACCAAAAATAGGACAATAAAAAAATAAAATACAAAAAAAGGGAAACTTGGACTCTTTTCTTATGAACAGAGTTGTAACTAAGGGCTAGCATTGGCGACCCCTGCGGCAGGAGAGAGGGCCTGCACTTGCTGTGATGGTTCCGACCATGGAAGAGGACTTAGCTCCCAAGCTTGAGGCTCTTGCGTAACTAGCTGAGGCTCCAGCTCCGGATGGGGTGAAGTATGCACCGTTCAGCAGTAGATCTCCCTCAGACCTCCAGTTCCAACCCTTCCATTTG >comp1839_c0_seq1 ATCCATTGCAGATAAGAGAGCTCTTAGAATTTCGATACCGGAACCCGTAACTCTTCCCCATAATGACCGTCTCAGCGGATGAAATTCATAAAACCCAACAAAACCCAGAAACAGAATTAGAAGATGCATTCAAAAATCTGGGAATCAAAACAAGCGAAGCATCTCCAAGTGGAGTGCTGGATATTCCAATTTCAGATGGTTCCTCTGTTTCTGACAGCCCAAAAAGCAGCAGTAGCAGCAGCAGCAGCAGTCCCTCAGAAAAACCTTATACCCCTCAAAAGGACAGACGAAGGCGAAAGCGAAAGCGAAAGCAGAGGCGGAGGAGGAGGTGGAGGTGGAGGCAAAGGAGGAGGAGCAACAATATTCAATCCATTGACTTATGGGATTCAATTCAAGGGATTTTTTGACATAATGAAGAGGAAATCAGGGGTTAGAAGATTGTCCACTACTACTATAAATTTGCTTAGTAACTATGATCTCTCTGCGAAGAGCCTGCGCAAGAAATTGGCTAGGATTCGCAGCGCCGAGGATAGTTTCGATTGCGGTCTTCTATCGGCAGCTAAGCCTTCTTGGAGGAACTTTAAGTATTCAGAGCTTGCTGTTGCTACAGACCATTTTAGTCCTGGGAGGTTGCTAGGGAAAGGGG >comp2075_c0_seq1 GCTTCGTATAAAATTAACTCAAAGTTGATTTTTGCCCAATTTATCTTGAAATTTCATTACATCATCCACTCTAGATTCAATTACCAATAGTTGAAATCCGAATAACGTACATGATCAAATTATTCCACATTCAAAGATTAATTAAAGTTTGCAAACACTTGAGTAAAACAAAATTTTAACTAACAACAATCAAACTAAAAAACAAAGGACTAATTAGTGTTGAACATAAACATCATATTCAACAACACTAGCACCACTTTTATCCAACATTGTAATAGTTTTAGCTTGTGCATACCCTGTTGCAAACCTAAACACACCACTTCCACCAACAACACCCATTTCTCGTACTTTATTCATCACTTGATTTCTTCCTAACACACTTAGAGTACTTCCATTAAATTCACCCTCTATAAACACCAAGTTCATTACCATCAATAGCCCCGGTTGCTTTTGGTCCGCAAACCCGTACATTCCTTGCGCGTACCCCACGATTTTCGAGTCTTTTTCGGGCCCTTCGGTCAAAGGATCATCGATCATAACAAGCGCGCCAAAACCACTTGAGGTTTTGTCCGTGTTAGGGGCTTGGGCAATACGTAGCGCAGTCTGGTTAGACCCTTGGACGTAGTCATGGAAGTAAAAGTGTAGATGGGTTAAGTTTGTTGTTGTTTAAGACCCTATTTCTTCTTTTGTTATTGGATTTTGAGAATGCATGATTTGTGGATGAAGAACTCAAGATTAGTAAGAAAGAAAGAAGGAAA >comp3355_c0_seq1 AAAAACACAAATCAAAGTAAAGTGTATTTTTCGCGATATCTAGCTTAACTAACTAGCAAAGGCTGAAGAAATGGCTAAGTCTACTTACTTCGTTAGCCTCCTTGCACTTTCTCTCATTTTCATGCTTGTAGTGAACACTGAAATTCAAATGGCGGAAGCAAAAACTTGTGGATGGTTGTACAAAGCTTGGTGGACAGATAACTGCTCCTACAAGTGCAAGAACGTCTGGGATGCCTACTATGGAAAGAAAGAGTGGTACCAAGGAAAATGGGCTTGCTTCTGTTACTATGGACCTTGTTAAGATAC >comp4060_c0_seq1 GTCGATTCGTAAGAACGGAGGAATCATCTCTTTAAAAACACGAAATTACAAGTGCATACATTGCAATTTTGCTAGCAAAGTTACAAGGAGTATGTCGTGGAGTGCTATCCACATGGCCACAAATGCACGAGTCTTTTTTTAACGTACCACAACCACATTTTGCAATAACAAGAACGTACAACTAACAACATATATTAAGACGAGATCTTAACAATTTCCCTTGAAATGGGATAAATTTAAAAATGATCAATCACTTGAAGAGACCTTTAGCCTTGTCCATCAAACTCTCCTCTGGTGGTGGAGGAGCGGGTTTAACAAAATCCCCGGCCTTGTTAAGAGCATCTCCAACGGTGTTCTTGATGTTTTCAGCCATTTCTCCGGCAGATTTGGAAATTTGAGCCGTGTCAATCTTGTCAGTCTGTTGGGTGACGGTTGTTTTCACTGTCTCCCCAGCATTCTTGGCACCATCTACTATGTTAGTCATGGTTGTTTTCTCAGCCATTGCTTAGTATGAGAATATTTGGCTAAGGTTTTACGGGTGTG >comp4773_c0_seq1 GACCAAAAACATGAAAGTTGGTCATGTGCTATTATTCATGGTTGCCATTGTTGTGGTAGGCACCGTGACACAGCCAACTTTGGCAGTGCGTCGAACTCCGCTCACCGCAAACACCATACAACAGAATCCCCTCTCAAACATCATGCTCGAAACGGTCAACAATGGAGCTGCTGGTTGGTGCCAGCAAAGGAACGAAATCTGCAATGCTTACTTTAAGTGTTGTCCAGACCTTGTATGCTACACTCGTGGAACTTGTGGAGATCTGGTCTAACAACTTTGCACTGCGGTCGGCATCGAGATACTTAAGTAATTATAGAATGTATGCTGTTTAAGAATAATATACGATGTATAAGTTAATATGAAGCTTTGGGTATACCATGCTTGTCAAGTTGTCAATAATGCATGTAACGAAACGAATAAGG >comp4911_c0_seq1 GCATTTTATAGCTTTTCTTACCATAATTAGCCTTACTTCGCAAATTAGCTCAATTTTAGCAATCCATCGTCCAATATACACAGATTTTCTTAAAAGATCATGCAAGTCAACACTTTATCCTGAACTTTGCTACAACTCCCTTTCAACCTATGCAAGTGACATCCAAAAAAATCCTCACATGCTTGCAAATGCCGCCCTCTTGGTGACCTTAGCCACCACCAGGACCACAACCGCGATGATATCTAGGATGTCGAATGGCCCGGGAATACGGCCAAGGGAGGCAGGAGCTATGAAGGACTGTTTGGAAGAACTAAATGATGCAGTAAGTGAGCTTACAAAAATCCATCAAGGAGATGAATCATATTAAGGATAGTAAGAGAGTAGGGCTTATGATGAATGATATACAAACTTGGGTGAGTGCTGCATTGACCGATGCGGACACGTGTACGGCTGGATTTGATGGAAAGGTCATGGATGGAAAGTTGAAGAGTGTTGTGAGAGGGAAAATTGTGAC >comp5517_c0_seq1 AAAAAAGCTTCGCACTTTTCCATAAAAATGGCGAGTTGGGTACTCTCAGAATGTGGTTTAAGGCCTCTTCCTAAAACCTACCCTAAACCCAGAACAGGGTTTTCCTCAACTTTCAATAACAATCCCTTAAAAATCAAAACTTCCCCTGTTTTTCCCCCTGTTTTATCAGATCTGAAATCAATTTCTTGTTGTTCTAATTCTAGAGAAAAAAAGTGGGAGGTTAATGTTAGTGCCCCATTAAGGGTATCTAACCCACCTCCAATTGAAGAAGATAATGATGAAAATGATAATAAAGTTATTGATGAATTTAATCCTGGTGCACCACCTCCATTCAAATTGGCTGATATTAAGAATGCAATTCCTAAACATTGCTGGGTTAAAAATCCTTGGAAATCAATGAGTTATGTTTTTAGGGATATTGCTGTTGTTTTTGGATTAGCTGCTACTGCTGCTTATTTCAACAAATGGATTGTTTGGCCTCTTTATTGGATTGCTCAGGGTACCATGTTCTGGGCTCTCTTTGTTCTTGGTCATGACTGTGGTCATGGAAGCTTTTCTAATAATCCAAAGCTTAATAGTGTTGTGGGCCACTTGCTTCACTCTTCAATCCTAGTTCCTTATCATGGATGGAGAATTAGTCATAGGACTCATCATCAAAACCATGGGCATGTTGAGAATGATGAATCATGGCATCCAATGTCTGAAAAACTAAACAATGGTATGGACTATTTGTCAAAGAAGTTAAGGTTCACCTTTCCATTTCCCTTGCTTGCATACCCTATATACCTGTGGGTACGGAGTCCTGGAAAATCAGGTTCTCATTATCATCCGGATAGTGATTTGTTCACTCCAA >comp25853_c0_seq1 GTTGAAATTGATAGTGATATTGCCAGCCATTGGATCAACAGTACAAGTGTGTTCGACGAATCTGGAAGTGTAATAATTGATACCAATATAATCAAAGGCGCCTTTGATTAGTTGCTTTTCAGCTTTTGTGAATTCTGGTAGCCCCTTCACATTCTTTTTCATTGTTTCTGGGTAGTCCCCACGAATAAGTGGGTCCATGTACCATCCCAAGGTGAAATCCAACTGCATTTTTGAAGCAGCAAAGTCTTTAGGATCAGTTGAATGTGGCATAAACCATTTACATGGGAGCGAAATTCCGATTTTCCCTTTTGTGATTTCTGGTATTTATCTTTGTAGAGTTTCGCGGCAGAAGCATGAGCTAAGATGATATGGTGGGTGGCAATGAATGAACCTCTTGGATCTTCTGAAGATCGCTAGGCAATCCATCTGTACCCATACGCCCAAATACATAA >comp31939_c0_seq1 GTCTGTTGAGTTCTGGTCAAGTAGAAGTTGTCTTGTTCCCATCTACCATTGACTGGGCGACAAGCTCTGCAGCTGTGATACTAGGCTAGTGTCCATGGTGCTGTCTGGAGCTCCGGTATTAGAAAAATTGAACAACCTTGAACTAAAAGTAGCACATCTTGCCAATCCTATTGTATGAGCACCTTGTAAGGCCACAACGTCAGTTAAGTTGAGGCCTTGATCACCAAACTTAGAAATGACGCTGTCTAGGGGATCAAACGGAGATGGAAGGTTTGAGTTTGCTCCGGTCTGGTTGGCCACCATTCCATCTCTCCTTCCTAGCAATACTCTATATGAATGCCCTCCACTCTGCAACATTAAATTATTAGTCAAGTACATACGTAACCAAGACTAATGAATTGCGGGCACCTAGTCACCTACTGCTATTTTGTCCTTTTCATCTGTGATTTTTCTAGATGCACGACAATATGACATACCAATGCTATTGAATCGCGGGCAGCTATTGCTAGTATATCAGCACAGGACACAACTCCACTGCATGAACTCTCCACTGCACTTTTGATCTTGTCCACAACGTCAAACCCTCTTAGAGAATTCTGGTTAGGAAGAGCGAGCTTTTCACTGTCGCTTCCATCCAGAAGAACAGACCCATCACAACCCTATTCACAAAACCATAAGATATTGTTGTTAGAGACGAAAATCTG >comp35446_c0_seq1 ACGTTTTCATCTTCCTTAGACTCTTTGTTCGAGTTCTCCAAACTCGAATACTTGATCGAATCAGTAGCACTAGCCGTAGAGTTATGCTGAATCTTACGATAATCTAGACCTAGCTCTAACCCTCCGGCTTCTACCTTTCTCTTTTATTCAAAGAATCATCACTTTCTTGTTTCTTATTGTTGTTATCATGACTATGTTTCTTGTTAGAGCTCCAACTACCAAGAGTTAGAGAAACCATCTCAGGCTCTTGGTTTTGATCATCATCTTCATTGTTGTTGTTGCTCGATGACTTCGTTTCTATTGATTGTTTAGATTGATCCATCGACGAAATTTGCTTCTCTAGAGATTGATATTCCTTCACAATTTTCG >comp38166_c0_seq1 GAGAACAAAGCCTTGGTATACATACGTGTGTGGTATGTACAATATGAAAATAGACCAAAATAATCCTATTGAAATGAAATAATAAAATACCTGGATCCAGGAATATAAACTGACTGCATGGCTTGTACAGTAATAGAAGTATGCTCTCTTAAAAGTTCAAACACTCTCCTTCCTTCTTCAAAACTACTTCCAAATGCAGCTCGAGAGATTACATCTGCTGACAGATTGTGTAAAAATGACCACATTTCTACCTCTTGAGATCCCGTTTCGGGTGTCGTCTTCTCCCACTCTTGGATCATCTCATTGCAACTCGCATGAAATGCTGGTAGCATAAGCTTAATTTTCTCCATATGGAAGGCAGGATTAAGCAATTTCCTTTCTTGGGCCCACTTATGGCCTTCGAGTCTAACCAAACCATTAGTAAGCCTCTTCAAAAGTGGAGTCGATATTTTGGAAAATCATAAATC >comp38447_c0_seq1 GGTTTACAAAATTTCCTACAGTATAAACACAGGGATCTGTTCATAACAGGAGAAAGTTATGCAGGCCACTATATTCCTCAACTTGCAAATCTGATGGTCCAATTCAACAAAAAGGAGAAAGTGTTTAACTTGAAAGGAGTTGCGCTTGGAAACCCGGTTTTGGAGTTTGCTACAGATTTCAACTCGAGGGCAGAGTATTTCTGGTCACATGGATTAATATCGGATTCAACCTACAAAATTTTTACCAAAGCCTGCAATTATTCAAGATATGTGAGTGAGTATTATCGAGGATATGTTTCACCAGTATGTTCCAAGGTGATGAGGCAAGTTGGTATGGAAACAAGCAAATTTGTGGACAAGTATGATGTTACCCTCGACGTTTGTATATCTTCTGTGCTATCTCAATCTAAGATCATTAGTCCTCAGGAGTCAAACGGTGAGAGCATAGATGTCTGTATTGAGGATGAGACCGTGAGCTACTTGAACCGGAAAGATGTTCAAAAGGCTCTTCATGCCCGACTAGTTAATGTTCGTCAATGGACTGTGTGCAGCAACATATTGGATTATCAGCTCCTTGATGTAGAGATACCCACAATAACCATTGTAGGATCACTTGTCAAGAATGGAATCCCTGTCTTAGTTTACAGCGGGATCAAGATTCAGTTATTCCACTAACTGGAAGCCGCACACTTGTGCATCAACTAGCTAGGGAAACTACGGCTGAACACAACCACT >comp42488_c0_seq1 ATTTTGTTACCCTCCTCTCTCTTTATTTTTCTTGGTAATTAATCTACGGAGTAGTAGGTTTTCATGCAGATCCATAAGGATCAGATAGCTTTTATGCTGCCTGCCATGAAATGTCCAAGGAAGAAGAAAAGGAGGAGTTTTATGCTCTAGCATATATCATATTGCATCTGCAATTCACCAAAGTGGCCTATGTCGAAGAGAAGGATTGGATTTGTCGATGCCATCAGCATCATGGCCATGGACTCAAGAACAAGTATTGATTGGGCATTAAGAGACAAAATTAGTACCAGATGTTGTAATCTTTATTACAACACAAACTGGGAAAATGATGCCTTGACATGTTTGTCTGATTCTCATAGTCTTCACGAGACGGTTGGTGCAGGCTCATGTCATTGGTGGTGGTATTGATATGGCTGGGCTTTGGACCGACCAATTCGGAAGGCTTGGGGATGTGTCCTCATGTTTTGGGTGGTATCGATCTCCTTTCGCTATCAATACGATTCACGGTAATAGGCCTGATCTTTTTGACTTGGCCATGTCAGGCATTTGTCGAAGAAATCATCATCTTGAATGCCCTACAATTTTACCTTGTATCTCAAGTAGTCG >comp42593_c0_seq1 GGCGAGACTACTCAAGATGGCCTAGCAAACCTGAGCAATGGAAGGCCATGGTTGAAGCCTACGGCGAAAATATGATGAACTTGTCCTGCAAGATGTTCGAGCTCTTGTCCGAGGGTTTGGGGTTAGACAAAGATGCCTATGCAAAGTCAATGGGTGATATTAGCCAGCATTTGGTGGTTAACCATTACCCTAAGTGCCCACAACCCGAGCTAGCTGTCGGTCTTAAGCGACACACCGATCCAAGCTCCATTACCTTGCTCCTCCAAGACCATGTTGGTGGGTTACAAGCTACAAAAGATGGTAGGCAAAACTTGGGTCACCGTTCGACCTATCAAAAATGCTTTGGTCCTTAACCTTGGTGATCATGCCTATTTCATGAGCAATGGAAGATTCAAGAGTGCCGATCATCAAGCAATCGTGAACTCGATCGAGACACGAACGTCGATAGCAGTATTCATGAATCCAGCACAAGATGCAAAGGTTTATCCGCTCAACGTAAAAGAGGGAGAGAAGGCAGTGTTGGAAGAGCCTATCACGTATGCTGAGATGAATAACAGGCACAAGAATAGGTATCTCGAAATCGTTCAACTAAAGAAATTGGCTAAGGAAGAAAATTGGTCACAAGAAGAGCTTGATCTCAAGCTTAGCCAGCTTAATTAAATCGATTTAGCCAGCATCTAAT >comp42870_c0_seq1
- GAAGGATGTGGCTAAACGTCTTGCTGAGAGGGGTATTGCCTTGGCTGTTACAGATGGTGCTCTAGATTACGTCTTAGCAGAGAGTTACGATCCAGTATATGGTGCAAGGCCTATTAGGAGGTGGTTAGAAAAGAAAGTTGTCACAGAATTATCGAAAATGCTCATCAAGGAGGAAATTGATGAGAATTCAACCGTCTTCATTGATGCTGGGATGGATGGACTTGCGTACCGCGTGGAGCAAACTGGTGGGATGGTTAATGCTGCAACTGGGCAGAGGGCTGAGGTCCTGATTCAAGTCCCTAATGGACCACGAAGTAACGCCACACAAGCTGCAAAGAAGTTAAAGATCGAGGAACTTGATGATGAGGATGATGAGATGATGGACTGAAGAGCTCAAGTATATGATGATGAAAGCTTTCCTTTTTATGGGCTTTTTACCTAATTTCATGGATTAGCAAATTTTCTTTATAAAAAGGCTTATGTAATGTTGTTCAATCTGTTAATGAGTGTTGTTCAAATTTTC >comp43304_c0_seq1 CTATTCGAGGTGGTGGTGGTTCGAGTTTTTGTGTCATCCTTTCCTATAAAATAAAATTGGTTAAAGTACCTAAAAAGGTCACTGTTTTAGGGTTTCAAGGACACTAGACCAAACCTAACTGATATTGTTGATCAATACCAACATGTTGCTCCAAATTTGGACCGTGATGCCTTCATTAGGCTTACCCTAGGTGTTACAAACTCGACCAAAACTGGCCTTTTGACAAACCAAGCAACATATAGATGCTTGTTTTTAGGTGACACCCAATCCCTCCTATCCCTAGTACACGAGAATTTTCCCTTGTTAGGCCTAGAAAAGTCGGATTGCCTTGAGATGAGTTGGATTGAATCTGTCCTTTTCTATTATGACTTTGCTATGGAAACTCCACTTTCGACTTTGTTAGATAGGCACCCTTCAAGTTTAACTTCCCTCAAAAGAAAGTCCGATTATTTGAAGAAG >comp43968_c0_seq1 GAAAGCATACTTCTTTTCTGAATCTCTCTGCAGCGAGAAACTGATCAGACATCAGCTTGAAGACCAAAAAGATGAAGTTACTAACTTGGATGCATCGCAAGTTTCGGCAAGGTAATGGCGAAACACCGAAGGAATTTCCCCTAGGGCAGCAATTCCTGGACGACCCTCACTTCTATCAGAAGCAAAACCAAGGGAAACAACGAAGAGCATCATTTACAAGTGTGGAGACAAGAATTTTGCTGAATACGAAAGAAAGCATCGTCAGCTGATGAGTTTCCTGAGTACTTCGAAGGATTTTCTAGCAATCGGCACTTTTGGGGTAGCAGATGCAGTCATCCCAGAGCCAGAGACACCAACCTTTGAGTGTCATTTGATAAGCTTGCAGAAGGAGAGGCTGAAGTGACAGAAAATGAATTGAGGCTCATCAATGATGAGTTAGAGAGGGTGCTTGCTTCTGAAGCTAAAGATGATGGTTGGACTGATTCTTCAGGGAGAAACAGTCATGTTAGCAATGGAAGAATCAGTCATGCAAGCACCATCACTCTGAGTGGGAAGCCACTGGAAATTCCAGAAAGCACAGGAGGCACAGGAAGTAATTTGATGTACTGTCCACTACAAGAATATCTGTTAGGCTCAGCTGTAGAAGTGCCAGAGAAAGCAACAGTGCCGAAAAAGGAGAACAGGACATCATTGGGAGAACTATTCGAGAGGCACAAGGCAGAAGAAACCTCGGATGTCAAGTGCAAACGTGGG >comp44207_c0_seq1 GTGGCCTTCAAAATTCCTTGTGAAAATCTCTCTGGGTTAAATTCCTTTGCATCAGTACCCCATAATTTTTCACTATGATGAATAAAAATAGTTGGCAAATTAACATGTACACCCGCCGGTAGAACCATATCGCCTACTCTCATTTCGTGGCTAACCTTTCGATTTAGGGAAAACACCGGCGAATATAGTCGTAGAACCTCATGAAGTATCATGTTCACCTTTTTGAGTTGGATTAAGCCATCAACATGAGGTGTATTGTGACCGAACATGGCGAAAATCTCTTCTCGAGCTTGTTCTTGCCAATTTGTATGTTTGCTTAGCAAAACAAGAGTCCATACCAACAACGACGAAGTGGTGTCTTGTCCGGCAACATAGAACATTTTGCACTCTTCAATAACCTCTTTCATACTCATCTTAAATTGTTGTTGTTTGTTATCATTTCCATGTAATAATTGATGATCTTGTACTCCTTCTAAGTTCGATTTTAGCAATAACCCTAACAAGTCATCTTTTAGCTGCTTCACCATTCTCCATGTTTTTTGCCTCTTTTTGAATCATATCTTTTAACAATGATTCCATTTCATTGACGATTTTCGCCTCCCTCTTGTTTGTTTTAGTAGGAAGAAACCTGGATCCAGGAATATAAACTG >comp49229_c0_seq1 GTTGAATTGCAGGTAACACAGAAGCGCCATAGCATCAGTTTTGCTGCTGTTCAGAAGCTGATGCTATGGGAGATCTGTAGGAGAATATTTTTTAGGAAAATTACAAACGGAATCGTTTCCACCGTTAAGAGAATTTTTTTTAAGTAGCAGTGATAACTTATGTTGAGTATGCTATCATATGATTATTTTTCTACGGAATATTATCCTATGAAAATGGAGACATGTACGGAAAATGTCTTCCACAAAAATAAACGGAGCCGCCTCCACTGTAAAGAGAGCTTTTTAAGCAGCAGTGGTAATTTATGTGATTATATGCCAATTATGCCACCAGCCCACCACCCACATTAGCCATGTGGATGTACCATAATTATAAAATGCTCCAGGATAGAGACCCGACTTCTTAATGAGCAAGTAGTTTGAGGTGGAACCTACATGACTGACCTGGCCACAAAATCAGTTTAAGGTGGGCTCACCGGGATACAGAATCAGTTTGAGGTGGAACCAATATGGCTGACCAACCTGGCCACAGAATCAGTTTAAG >comp55875_c0_seq1 ATGTTCTTATCATTCCATCTTTTTGAATCTACAAACATCATATCCATGATAGATTACATACATTTTATACCAAGCTACCAAAGCATGAACAATATAACAAATTACACTTTCGTTTAGGACACAAATAATTGACATCAGACTATCCCGGTACATTTAATCATCGGATCTAGACCCTGGTGCACGAGGGCATCTCAGGTACGTTTTGCACCTATCAATTGACCCGCCTCCACATAAGCAGTTCCCATAACTATTATTTGCAGTCTTACAGTATGGGCTCAGGCCATTAGTTTTATCGATGCAATTATCGGCAACGACAAGGTTGGTGCTCAAACTGAAAACTAGTAGGATCAACAGAAGAGTTGAAGGGGAGAAACAAGGACGACGAACGAACAGAATGTTACTCTTACTCATGGTGTTTACCTCTCTCGTATGATCGATTTAATTTCTTATAAAAATGGAAAAAAT >comp56526_c0_seq1 TAGAGTTTGATCAACACTTATGGCTACAAAAATGCACCTAGTGTTTTTGGCTTCCTTTCATTGATACCGCCTTTTATGGTTGCTCAAGCAGACCCGGGTTATAGCTATGGGTACGGCTTTGGATGGGGTAGTGGTGGTGGGAACGACTATAGCTCGTTGTCTCCGTACTTCTATGACTTCTCTTGCCCTCAAGCTAACAACATTATTGCTTCGGTCTTAGAGAATGCTGTTGCACAAGACCCTCGGATGGCTGCTTCTTTGCTTAGGCTTCATTTTCATGACTGCTTTGTTCAGGGGTGTGATGCTTCTATACTGCTAGATGATAGCGCGACATTTGTAAGTGAGAAAAGGCTAAACCAAATCTTAATTCCTTGAGAGGTTTACTGTCATTGATGAAATTAAAGCCAGGTTAGAAGAAGCATGCCCTGAAACTGTCTCTTGTGCTGATATCTTGGCCTTGGTAGCTCGCGCCGCCAGTGTCTTGAGTGGAGGACCTAATTGGGAAGTCCCATTAGGAAGAAGGGACTCAAAAGCAGCAAATATGCTACTTGCAAATG >comp56807_c0_seq1 TGAGGCATGTGCAAACGTACAGAGTTCAGCTAGACAGCCAGCCAGAGGAGATAGATAATTTGGAGAGGAAGAGAATGCAGTTAGAAATTGAGCTACATGCTCTTGAGAAGGAGAAAGATAAAGCTAGCAAAGCACGGTTAGTGGAGGTTACTAAGGAGCTTGAGGACTTGAGGGATAAACTTCAGCCTCTAAAGATGAAATATATGAAGGAGAAGGAGAGGATTGATGAGCTCCGTAGACTGAAGCAAAAAGAGAAGAGCTCATTATTTCTGCACAAGAGGCTGAAAGAAGATATGATCTTGCAAGGGCTGCTGATTTGAGGTATGGAGCAATCCAGGAAGTCGAGGCAGCTATTGCTAGATTGGAATCTAATGCTACCGATGTTGAATTGTTGACTGAAACTGTTGGGCCAGAGCAGATTGCAGAAGTGGTGAGCCGATGGACTGGTATTCCAGTCACCAGACTGGG >comp79264_c0_seq1 GGGATGTTAAATTTCAGAATGAAGATGATTTACTCTTTAGCAATAACACAGAAGCTATAGACAGAGGGGATGAAAAGAAAATTTATACACTGAATCTCAACAAGAACAAGAAAATCAAAAGATTGAACTTTCAAAAGAAGAGAGCTTTCCCAAAGATCAAGCCTCTGAAGTAAATAAAACCAAAGAATTCACACATTCCGAAGTGAACTCTGATGAAGACATGAAAAAAATGGTGCTGACTTTACAACAAGTGTAACTAAAGAAGAAATGATGCAAGAGTTTATGGAGTCTGATCCAGAAAAAAGACTAGAGGTGACAAAATGAGAAGGAATCAAACAG >comp82670_c0_seq1 TAAAATTCCAGATTCTATCAAACCCAGAATTTTTAGCTGAAGGAACTGCAATCCAAGACTTTTTTAACCCAGACAGAGTTCTCATAGGAGGAAGAGAAACCCCTGGAGGCCAAAAGGCTGTACAAGAACTCAAAAACGTGTACGCGCAATGGGTGCCTGAGGACCGGATCCTAACCACTAATCTGTGGTCAGCCGAGCTGTCTAAGCTCGCGGCTAATGCATTTTTAGCCCAAAGAATTTCATCTGTAAATGCTATGTCCGCCCTGTGTGAGGCCACGGGTGCTAATGTGTCACAAGTCGCCCATGCTGTTGTAGGACACAAGAATTGGACCAAAATTTTTGAATGCTAGTGTTGGTTTGGAGGGTCATGTTTCCAAAATGATATACTTAACTTAGTGTACATCTGTGATGTAATGGCTTACATGAGGTCGCGAATTATTGGAAGCAAGTGATTAAGATTAATGATTACCAAAAG
NOTES
*Corresponding author.