Neuroscience & Medicine
Vol.2 No.3(2011), Article ID:7422,7 pages DOI:10.4236/nm.2011.23037
Insomnia Symptoms and Sleep Duration Are Associated with Impaired Cardiac Autonomic Modulation in Children*
![]()
1Department of Public Health Sciences, College of Medicine, Penn State University, Hershey, USA; 2Sleep Research & Treatment Center, Department of Psychiatry, Penn State Milton S. Hershey Medical Center, College of Medicine, Penn State University, Hershey, USA.
Email: #dliao@psu.edu
Received June 10th, 2011; revised July15th, 2011; accepted July 30th, 2011.
Keywords: Insomnia Symptoms, Sleep Duration, Cardiac Autonomic Modulation, Heart Rate Variability, Population-Based Study
ABSTRACT
Limited population-based data from children are available to investigate the associations between insomnia and sleep duration in relationship to impaired cardiac autonomic modulation (CAM). Therefore, the objective of this study is to examine the cross-sectional associations between insomnia symptoms, sleep duration, and CAM in a population-based sample of children. All 616 children were randomly selected from Central Pennsylvania to participate in a one-night polysomnography (PSG) study in a sleep laboratory. The Pediatric Behavior Scale was used to assess parent-reported insomnia. Sleep duration was assessed objectively by PSG. CAM was measured by heart rate variability (HRV) analysis of 9-hour-beat-to-beat RR intervals. Multivariate linear regression models were used to assess the association between insomnia, sleep duration and HRV. The mean (SD) age was 9.2 (1.7) years, with 25.5% non-white and 48.9% male. After adjusting for age, race, gender, BMI percentile, % REM sleep, apnea-hypopnea-index, sleep latency, and sleep efficiency, the means(SE) of HRV indices were lower in children with insomnia than in children without: 6.56 (0.07) vs. 6.78 (0.04) m2 on logHF, respectively; and 6.47 (0.06) vs. 6.61 (0.03) m2 on logLF, respectively (all P < 0.05). There is a trend towards a significant lower time domain HRV indices, faster HR, and higher LF/HF ratio in children with insomnia symptoms. There is a similar pattern of association between shorter objective sleep duration and HRV. Insomnia symptoms and shorter objective sleep duration are associated with lower HRV and higher HR and LF/HF ratio, indicative of disturbance of CAM towards more sympathetic and lower parasympathetic modulation. These data provide supporting evidence of physiological activation associated with insomnia and short sleep duration even in very young children.
1. Introduction
Insomnia, short sleep duration, and other sleep problems are affecting approximately 10% - 30% of the elementary school children and adolescents in the United States [1,2]. Insomnia is the most common sleep disorder in both adults and children [3,4]. In children and adults lack of sleep quantity and quality have been related to anxiety, [5] depression, [6] attention problems, conduct problems, and aggression [7]. In addition, insufficient sleep duration and insomnia symptoms are associated with increased cardiovascular disease (CVD) mortality and morbidity in adult populations [8]. Impaired cardiac autonomic modulation (CAM), measured by heart rate variability (HRV) indices, is associated with insomnia [9,10]. However, limited population-based data from children are available to investigate the associations between insomnia and sleep duration in relationship to impaired CAM [11]. Therefore, we carried out this study to investigate whether insomnia symptoms and short sleep duration are associated with imbalance of CAM in a population-based sample of children.
2. Materials and Methods
2.1. Study Population
We used the data from the Penn State Children Cohort (PSCC) for this study. PSCC is a population-based study of the prevalence and correlates of sleep-disordered breathing (SDB) in children. Recruitment methods for this study have been published elsewhere [11-13]. The study protocol was approved by Penn State University College of Medicine Institutional Review Board. In brief, the study sample was selected through a two-phase sampling process, with Phase I consisting of the collection of parent-reported child’s sleep and behavioral patterns. Phase II of the study consisted of the collection of more detailed data from a one night sleep study in our General Clinical Research Center (GCRC). In Phase I, a selfadministered questionnaire was sent home to be completed by the parents of all elementary school (grade K-5) children in three school districts in Dauphin county, central Pennsylvania. Seven thousand three hundred twelve questionnaires were sent and 5,740 were returned, with a response rate of 79%. In Phase II of sampling, each year we randomly selected 200 children from those who returned the questionnaires in Phase I to participate in our GCRC sleep study. The Phase II examination was performed between 2002 and 2006. We stratified this sampling based on the severity of risk for SDB as reported by parents in the Phase I questionnaire, and by grade and gender. One thousand children were selected to participate in the Phase II sleep laboratory evaluation, and 700 children agreed to participate, with a response rate of 70% [13] . During Phase II, parents completed a set of standardized questionnaires and each child underwent a standardized physical examination, including measurement of height, weight, waist and neck circumferences, and blood pressure; a visual evaluation of the nose and throat by an ear, nose, and throat (ENT) specialist; and an evaluation of the respiratory function by a pediatric pulmonologist. After the physical examination, each child received a 9-hour fixed protocol nighttime polysomnogram (PSG).
2.2. Sleep Duration
Sleep duration was objectively assessed from one-night PSG. Briefly, each child received a 9-hour fixed protocol nighttime PSG. During the PSG sleep evaluation, each child, in the presence of a parent, spent a night in a soundattenuated, temperature-and-light-controlled room located in our GCRC. The child’s sleep was continuously monitored for nine hours, including electroencephalogram (EEG), electrooculogram (EOG), electromyogram (EMG), respiration (nasal pressure and thermocouple, thoracic and abdominal strain gauges), hemoglobin oxygen saturation, and objective snoring [13] .
2.3. Other Sleep Related Variables
From the one night polysomnography, apnea was defined as a cessation of airflow with a minimum duration of five seconds and an out of phase strain gauge movement. A hypopnea was defined as a reduction of airflow of approximately 50% with an associated decrease in SaO2 of at least 3% or an associated arousal. We then combined the total number of apnea and hypopnea episodes and divided it by the total duration of sleep to form the Apnea Hypopnea Index (AHI, [(apneas+hypopneas)/hours of sleep [14,15]. For the purpose of this study we excluded children with moderate SDB defined as AHI ≥ 5. Percent of sleep in Repaid Eye Movement (REM) stage is defined as the percentage of total sleep time that is in the REM stage sleep. Sleep latency was defined as the time (minutes) it takes from the lights out to fall into sleep. Sleep efficiency is the percentage of time that the child is in sleep stages.
2.4. Classification of Insomnia Status
Parent-reported insomnia symptoms was defined by using the Pediatric Behavior Scale [16], which included two items relevant to insomnia symptoms during the past two months.
2.5. Cardiac Autonomic Modulation (CAM) Measures
During the one night PSG, one PSG channel was used to record ECG voltage at a 100 Hz sampling rate. After converting the 1 channel ECG voltage data into a beat-tobeat ECG waveform file, the peak of each QRS complex as the R wave point was identified. The beat-to-beat RR intervals from the entire ECG recording were calculated after applying an artifacts identification and removal algorithm if a RR interval was less than 375 ms, longer than 1200 ms, or if the RR interval ratio from two adjacent RR intervals was less than 0.8 or greater than 1.2. The HRV Analysis Softwar [17] was used to apply HRV analysis to the above described “artifact free” RR interval files if the total length of the “artifact free” RR interval file was more than 6.5 hours (corresponding to approximately 75% of the total recording time) [11]. The detailed HRV analysis procedure has been published elsewhere [11,12,16-18]. For frequency domain HRV analysis, we used Fast Fourier Transformation (FFT) method to analyze the “artifact free” RR interval data. The adjacent RR interval were first interpolated using a piecewise cubic spline interpolation approach, with a 2 Hz sampling rate. The FFT was performed on the equidistantly interpolated RR time series. We used 2nd order polynomial model to remove theslow nonstationary trends of the RR signals. As the results of FFT, we calculated the following frequency domain HRV indices: high frequency power (HF, 0.15 - 0.40 Hz), which represents parasympathetic modulation; low frequency power (LF, 0.04 - 0.15 Hz), which represents a mixture of sympathetic and parasympathetic modulation; and LF/HF ratio, which represents the balance of sympathetic and parasympathetic modulation. Also, we calculated the following time domain HRV indices: SDNN, the standard deviation of all RR intervals (ms); RMSSD, the square root of the mean of the sum of the squares of differences between adjacent RR intervals (ms); and HR, mean heart rate (beat per minute, BPM). These time domain HRV variables were used to measure the total variability of RR intervals with a lower value indicating imbalance between parasympathetic and sympathetic effects.
2.6. Other Covariables
At Phase II, demographic and physical variables were collected from participants conforming to the standardized clinical examination. The following covariables were included in this study: age, gender, race, and body mass index percentile (BMI).
2.7. Statistical Analysis
Mean (standard deviation, SD) and proportions of the demographic characteristics were calculated for the entire population, as well as stratified according to the insomnia symptoms. Analysis of covariance (ANCOVA) of three different models (Model 1, univariate; Model 2, adjusted for age, race, gender, BMI percentile; Model 3, same as Model 2 plus %REM, AHI, sleep latency, and sleep efficiency) were used to calculate adjusted means and standard errors of HRV variables according insomnia status. We used multivariate linear regression models to assess the relationship between objective sleep duration (continuous) and HRV indices, with similar covariable adjustment as specified above. Following the convention of HRV analysis [19], LF and HF were log-transformed for the statistical analyses. We accounted for the sampling weights in all statistical models to make inference back to the general population from which this study sample was obtained. SAS 9.1 software (SAS Institute, Inc., Cary, NC) was used for all statistical analyses.
3. Results
3.1. Demographic Characteristics
From the 700 children in Phase II of the PSCC study, we excluded 84 individuals who did not have sufficient ECG data for HRV analysis (persons with less than 6.5 hours of normal RR interval data), and 7 individuals that had moderate SDB (AHI ≥ 5). Thus, the final sample size utilized for the insomnia and objective sleep duration analysis was 609 children (87% of the original 700 children). When analyzing the subjective parent-reported sleep duration, only 456 children with parent-reported sleep duration were included (75% of the 609 children). The main characteristics of the study population, overall and stratified by insomnia symptoms status, are shown in Table 1. Out of the 609 children in the entire cohort, 149 had insomnia symptoms, with a sampling weight adjusted prevalence of 19%. The prevalence of insomnia for white boys, white girls, non-white (Black, Hispanic, and Asian) boys, and non-white girls, was 19%, 21%, 14%, and 21%, respectively. The mean (SD) age of the entire cohort was 111 (21) months (or 9.2 (1.7) years), with 49% male and 75% white. In addition, the mean (SD) BMI percentile was 61 (29). When stratified by insomnia complaint status, individuals with insomnia symptoms have a worse sleep profile than individuals without such complaint: the difference in parent-reported sleep duration reached statistical significance (P = 0.05), and %REM sleep and sleep latency were marginally significant (P < 0.10), while objective sleep duration, AHI, and sleep efficiency were not statistically significant. In these univariate comparisons, all HRV and HR variables showed a less healthy CAM profile in children with insomnia symptoms than those without.
3.2. Multivariate Adjusted HRV Indices by Insomnia Symptoms Status
Three multivariate adjusted models associating insomnia complaint with HRV variables were analyzed, with each progressively adjusted for more potential confounders. These results, presented in Table 2, indicate a relationship between insomnia and CAM, in the direction of insomnia being significantly (P < 0.05) associated with lower levels of Log HF and Log LF in all three models, and other CAM variables showed a consistent pattern with a trend toward statistically significant (P values ranged from 0.07 to 0.17).
3.3. Multivariate Adjusted Association between Sleep Duration and HRV
The multivariate adjusted regression coefficients of HRV indices from the above mentioned three sets of models in relationship to one-hour shorter objective sleep duration These results, presented in Table 2, indicate a relationship between insomnia and CAM, in the direction of insomnia being significantly (P < 0.05) associated with lower levels of Log HF and Log LF in all three models, and other CAM variables showed a consistent pattern
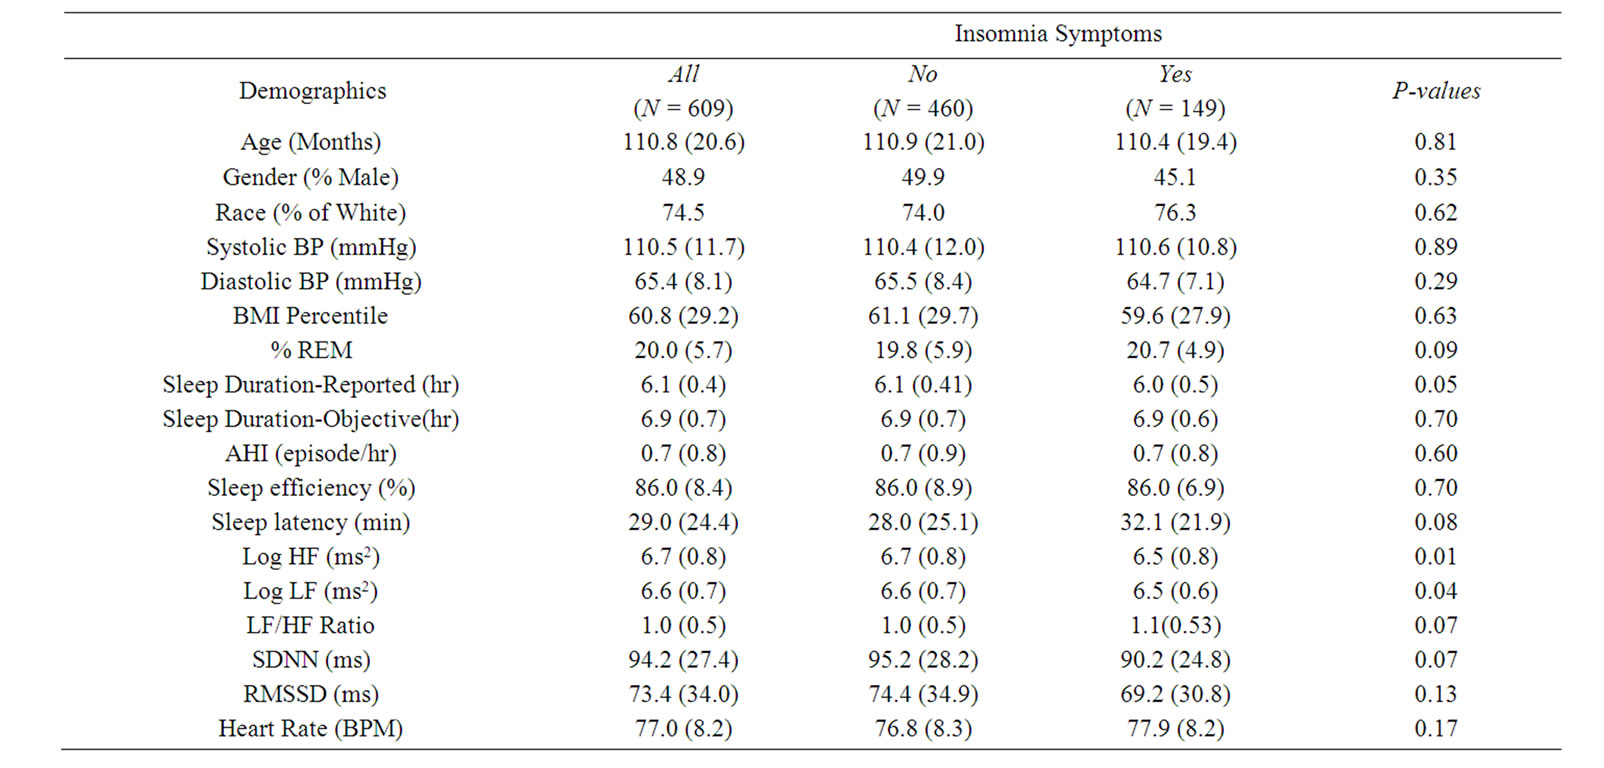
Table 1. The study population demographic characteristics and summaries of HRV indices. Abbreviations: HRV, heart rate variability; BP, blood pressure; BMI, body mass index; REM, rapid eye movement; AHI, apnea hypopnea index; Log, logarithm; HF, high frequency power; LF, low frequency power; SDNN, standard deviation of all RR intervals; RMSSD, square root of the mean of the sum of the squares of differences between adjacent RR intervals; BPM, beats per minute. Data are expressed as mean (SD) for continuous variables and percentage for categorical variables.
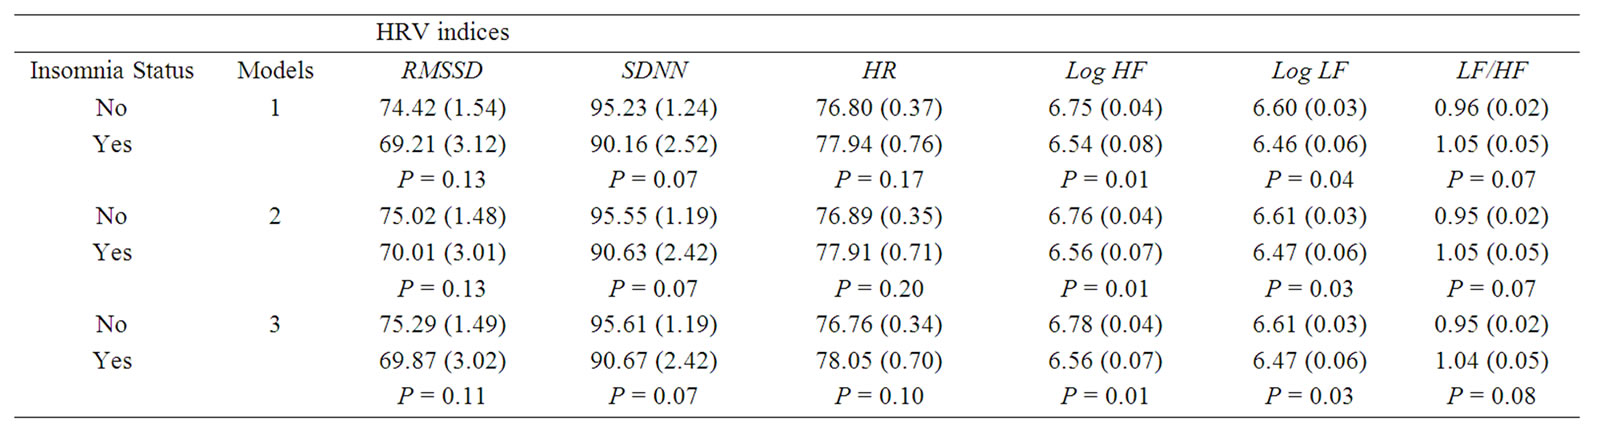
Table 2. Adjusted mean (standard error, SE) levels of HRV indices according to Insomnia status. Abbreviations: HRV, heart rate variability; PSG, polysomnography; HF, high frequency power; LF, low frequency power; Log, logarithm; RMSSD, square root of the mean of the sum of the squares of differences between adjacent RR intervals; SDNN, standard deviation of all RR intervals; HR, heart rate. Model 1, sampling weight; Model 2; adjusting for Age, race, gender, BMI percentile, and sampling weight; Model 3, same as Model 2 plus %REM, AHI, sleep latency, and sleep efficiency.
with a trend toward statistically significant (P values ranged from 0.07 to 0.17).
3.4. Multivariate Adjusted Association between Sleep Duration and HRV
The multivariate adjusted regression coefficients of HRV indices from the above mentioned three sets of models in relationship to one-hour shorter objective sleep duration are presented in Table 3. Shorter sleep duration was associated with lower HRV indices, and higher HR and LF/ HF ratio, with HR and LF/HF reaching statistical significance at P < 0.01. We tested the interaction between insomnia symptoms and sleep duration in relationship to HRV indices, and the interaction terms were not statistically significant.
4. Discussion
The health and physiological impact of chronic insomnia has been understudied, although recently we have reported significant associations between insomnia and short sleep duration and type 2 diabetes [20], hypertension [13,21,22], and all-cause mortality in a population
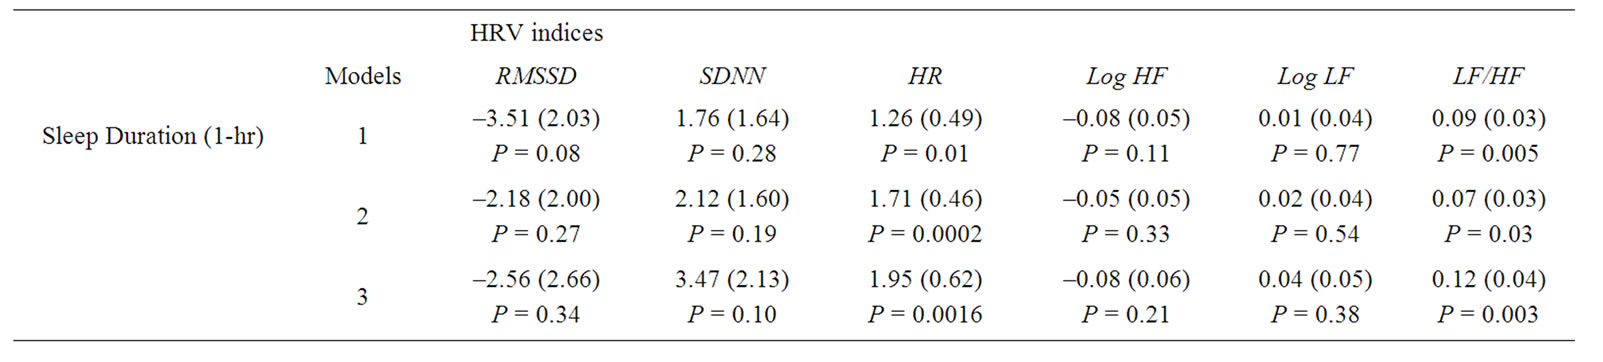
Table 3. Regression coefficient (SE) of HRV indices associated with sleep duration. Abbreviations: HRV, heart rate variability; PSG, polysomnography; HF, high frequency power; LF, low frequency power; Log, logarithm; RMSSD, square root of the mean of the sum of the squares of differences between adjacent RR intervals; SDNN, standard deviation of all RR intervals; HR, heart rate. Model was adjusted for age, race, gender, body mass index percentile, sleep disorder breathing, snore status, percentage of rapid eye movement, and sampling weight. Model 1, sampling weight; Model 2; adjusting for Age, race, gender, BMI percentile, and sampling weight; Model 3, same as Model 2 plus %REM, AHI, sleep latency and insomnia symptoms.
based sample of adults. On the subclinical impact of insomnia, Bonnet et al. reported that adults (aged 18 - 50 years) with insomnia had an increased heart rate, a significantly increased LF, and a decreased HF when compared to normal subjects [9]. On the other hand, Fang et al. demonstrated that adults with insomnia have lower HF, but neither the LF nor the LF/HF were significantly different from the normal group [10]. Walter et al. showed that children (aged 7 - 12 years) with periodic leg movements in sleep (PLMS) have a significantly increased LF/HF ratio when compared to those without PLMS [23] . We recently reported the associations between SDB and HRV, as well as SDB and elevated blood pressure association, in children [11,13,18,21,22]. All of these studies indicated that sleep related chronic conditions, such as insomnia and SDB, have an adverse impact on human physiological and health profiles.
Lack of sleep in children has been related to sleep-related difficulties in performing routine daily activities [5- 7,24,25]. Fredricksen et al. found that during a period of three years of middle school (23 participating schools), children (n = 2259) showed a decline in sleep pattern causing a decrease in self-esteem, and a rise in depressive symptoms [6]. Also, Nixon et al. found in a longitudinal study of seven-year-old children (n = 519) short sleep duration is an independent risk factor for obesity/ overweight [24].
A study by El-Sheikh et al. on children (aged 8 - 9 years) showed that those with vagal tone were at increased risk of social problems, depression symptoms, and higher BMI associated with increased sleep disruption [25]. In addition, the lack of sleep in children has been related to development of physician-diagnosed sleep disorders (e.g. insomnia, sleep apnea, and restless legs syndrome (RLS)) [3]. Despite these findings presented above, to our knowledge there is no evidence of any epidemiological studies in the literature investigating the association between insomnia symptoms and sleep duration in relationship to all HRV measures in a large population of children.
In this study of the cross-sectional association between insomnia symptoms, objective sleep duration and CAM in a population-based sample of children, we highlight two major findings. First, parent-reported insomnia symptoms in children are consistently associated with lower HRV measures and higher HR and LF/HF ratio, all indicative of a CAM disturbance towards sympathetic over activation and reduced parasympathetic modulation. Second, shorter objective sleep duration is consistently associated with lower HRV and higher HR and LF/HF ratio, with LF/HF ratio and HR reaching statistical significance, also indicative of a CAM disturbance in the same direction as the insomnia symptoms. Considering the literature summarized previously, our two major findings suggest that insomnia symptoms and short objective sleep duration in children have already had an adverse impact on the CAM of the heart. Thus, it implies that improving sleep quality and duration may result in a healthier CAM.
The high prevalence (19%) of parent-reported insomnia symptoms found in this population-based sample of children may be attributable to the fact that the insomnia symptoms were identified by parent-reported insomnia symptoms (“Has trouble falling asleep” or “Wakes up often in the night”), which often can lead to over reporting. The parent rated their child into one of the following four mutually exclusive categories—almost never or not at all; sometimes or just a little; often or pretty much; very often or very much. If any one of these two insomnia symptom items was rated as “often or pretty much” or “very often or very much”, the child was classified as having insomnia symptoms. Therefore, the “cases” of insomnia symptoms may be different from clinically diagnosed chronic insomnia. These criteria were used because currently there is no well accepted diagnostic criterion for insomnia in children. However, our data on the differences in sleep profile variables between children with and without insomnia symptoms (presented in Table 1) are suggestive of the internal validity of using parent-reported insomnia complaint. It can be argued that the small magnitude of differences between insomnia and non-insomnia groups in sleep profile variables as well as in HRV indices may also indicate a very early stage and a short duration of insomnia symptoms. One can also argue that there is no evidence in the literature to suggest that the misclassification of insomnia symptoms would be dependent on the objectively measured sleep profiles or the HRV variables. Thus, it is possible that the associations between insomnia symptoms and sleep profile variables and HRV variables in this study may have been underestimated, and the true magnitude of the association may be even higher.
There are a few other limitations of this study. First, some degree of random misclassification of the R wave is possible when collecting beat-to-beat ECG data at a sampling rate of 100 Hz from one-ECG channel. However, based on previous experience in the Atherosclerosis Risk in Communities study [26,27], which also used 100 Hz sampling frequency, and the current recommendations [28], we appropriately applied interpolations and equal distance samplings, and analyzed long-term recordings (entire night ECG), an initial sampling frequency of 100 Hz is considered sufficient, which is supported by others [29]. Second, because we collected the ECG data from one channel only, if an artifact occurred, there was no adjudication that we could have done using other ECG channels. To resolve this problem, we utilized a set of statistical criteria for the identification and removal of those RR intervals (RR interval <375 ms, >1200 ms, or RR interval ratio from two adjacent RR intervals <0.8 or >1.2), which in some cases shortened total available data for the HRV analysis. Third, the ECG data was collected at nighttime during sleep. In humans, the parasympathetic and sympathetic modulation balance changes according to sleep stage [30]. Thus, the evening/nighttime HRV collected during sleep may not be representative of daytime HRV. However, the associations between insomnia symptoms and HRV variables were not meaningfully changed when we control for sleep profile variables including percent of REM sleep, sleep latency, and sleep efficiency. Thus, we do not believe the associations we observed in these data are attributable to the differences in sleep stage and other sleep quality profile variables. Fourth, we had to rely on onenight PSG recording to assess objective sleep duration and other sleep profile variables. As a result, these measures may not be representative of “habitual” profiles, due to the “first night” effect. On the other hand, there are also several strengths of this study that should be recognized: 1) It is the largest population-based sample of children to investigate the association between insomnia and sleep duration with CAM; 2) We successfully acquired HRV analysis on 87% of the original PSCC sample (609 out of 700) for the insomnia and objective sleep duration analysis; and 3) Long duration of continuous ECG recording (at least 6.5 hours of normal RR interval data).
In conclusion, in young children, insomnia symptoms and shorter objective sleep duration are associated with lower HRV, higher HR, and higher LF/HF ratio, indicative of a CAM disturbance in the direction of sympathetic activation and lower parasympathetic modulation. Further longitudinal studies in children are needed to determine the impact of sleep and sleep related problems on cardiovascular health and the long-term risk of CVD.
5. Acknowledgements
The authors wish to thank the participants of the Penn State Children Cohort.
REFERENCES
- O. Saarenpaa-Heikkila, P. Laippala and M. Koivikko, “Subjective Daytime Sleepiness in Schoolchildren,” Family Practice, Vol. 17, No. 2, 2000, pp. 129-133. doi:10.1093/fampra/17.2.129
- M. M. Ohayon, “Epidemiology of Insomnia: What We Know and What We Still Need to Learn,” Sleep Medicine Reviews, Vol. 6, No. 2, 2002, pp. 97-111. doi:10.1053/smrv.2002.0186
- M. Partinen and C. Hublin, “Epidemiology of Sleep Disorders. Principles and Practice of Sleep Medicine,” 3rd Edition, Saunders WC, Philadelphia, 2000.
- J. Lipton, R. E. Becker and S. V. Kothare, “Insomnia of Childhood,” Current Opinion in Pediatrics, Vol. 20, No. 6, 2008, pp. 641-649. doi:10.1097/MOP.0b013e32831897cb
- A. Sadeh, C. Acebo, R. Seifer, S. Aytur and M. Carskadon, “Activity-Based Assessment of Sleep-Wake Patterns during the 1st Year of Life,” Infant Behavior and Development, Vol. 18, No. 3, 1995, pp. 329-337. doi:10.1016/0163-6383(95)90021-7
- K. Fredricksen, “Sleepless in Chicago: Tracking the Effects of Adolescent Sleep Loss during the Middle School Years,” Child Development, Vol. 75, No. 1, 2004, pp. 84-95. doi:10.1111/j.1467-8624.2004.00655.x
- J. Paavonen, “Sleep Disturbances and Psychiatric Symptoms in Schoolaged Children,” Ph.D. Thesis, University of Helsinki, Helsinki, 2004.
- P. Johansson, K. Arestedt, U. Alehagen, E. Svanborg, U. Dahlström and A Broström, “Sleep Disordered Breathing, Insomnia, and Health Related Quality of Life—A Comparison between Age and Gender Matched Elderly with Heart Failure or without Cardiovascular Disease,” European Journal of Cardiovascular Nursing, Vol. 9, No. 2, 2010, pp. 108-117. doi:10.1016/j.ejcnurse.2009.11.005
- M. H. Bonnet and D. L. Arand, “Heart Rate Variability in Insomniacs and Matched Normal Sleepers,” Psychosomatic Medicine, Vol. 60, No. 5, 1998, pp. 610-615.
- S. Fang, C. Huang, T. Yang and P Tsai, “Heart Rate Variability and Daytime Functioning in Insomniacs and Normal Sleepers: Preliminary Results,” Journal of Psychosomatic Research, Vol. 65, No. 1, 2008, pp. 23-30. doi:10.1016/j.jpsychores.2008.02.003
- D. Liao, X. Li, S. M. Rodríguez-Colón, J. Liu, A. N. Vgontzas, S. Calhoun and E. O. Bixler, “Sleep-Disordered Breathing and Cardiac Autonomic Modulation in Children,” Sleep Medicine, Vol. 11, No. 5, 2010, pp. 484-488. doi:10.1016/j.sleep.2009.11.012
- S. M. Rodríguez-Colón, E. O. Bixler, X. Li, A. N. Vgontzas and D. Liao, “Obesity is Associated with Impaired Cardiac Autonomic Modulation in Children,” International Journal of Pediatric Obesity, Vol. 6, No. 2, 2010, pp.128-134.
- E. O. Bixler, A. N. Vgontzas, H. M. Lin, D. Liao, S. Calhoun, F. Fedok, V. Vlasic and G. Graff, “Blood Pressure Associated with Sleep-Disordered Breathing in a Population Sample of Children,” Hypertension, Vol. 58, 2008, pp. 841-846.
- American Academy of Pediatrics, “Clinical Practice Guideline: Diagnosis and Management of Childhood Obstructive Sleep Apnea Syndrome,” Pediatrics, Vol. 109, No. 4, 2002, pp. 704-712.
- American Thoracic Society, “Standards and Indications for Cardiopulmonary Sleep Studies in Children,” American Journal of Respiratory and Critical Care Medicine, Vol. 153, No. 2, 1996, pp. 866-878.
- S. D. Lindgren and G. K. Koeppl, “Assessing Child Behavior Problems in a Medical Setting: Development of the Pediatric Behavior Scale,” In: R. Prinz, Ed., Advances in Behavioral Assessment of Children and Families, JAI Press, Greenwich, Vol. 3, 1987, pp. 57-90.
- J. P. Niskanen, M. P. Tarvainen, P. O. Ranta-Aho and P. A. Karjalainen, “Software for Advanced HRV Analysis,” Computer Methods and Programs in Biomedicine, Vol. 76, No. 1, 2004, pp. 73-81. doi:10.1016/j.cmpb.2004.03.004
- D. Liao, X. Li, A. N. Vgontzas, J. Liu, S. M. RodríguezColón, S. Calhoun and E. O. Bixler, “Sleep-Disordered Breathing in Children Is Associated with Impairment of Sleep Stage-Specific Shift of Cardiac Autonomic Modulation,” Journal of Sleep Research, Vol. 19, No. 2, 2010, pp. 358-365. doi:10.1111/j.1365-2869.2009.00807.x
- S. Vaishnav, R. Stevenson, B. Marchant, K. Lagi , K. Ranjadayalan and A. D. Timmis, “Relation between Heart Rate Variability Early after Acute Myocardial Infarction and Long-Term Mortality,” The American Journal of Cardiology, Vol. 73, No. 9, 1994, pp. 653-657. doi:10.1016/0002-9149(94)90928-8
- A. N. Vgontzas, D.Liao, S. Pejovic, S Calhoun, M Karataraki and E. O. Bixler, “Insomnia with Objective Short Sleep Duration Is Associated with Type 2 Diabetes: A Population-Based Study,” Diabetes Care, Vol. 32, No. 11, 2009, pp. 1980-1985. doi:10.2337/dc09-0284
- A. N. Vgontzas, D.Liao, and E. O. Bixler, “Insomnia and Hypertension,” Sleep, Vol. 32, No. 12, 2009, p. 1547.
- A. N. Vgontzas, D.Liao, and E. O. Bixler, G. P. Chrousos and A. Vela-Bueno, “Insomnia with Objective Short Sleep Duration is Associated with a High Risk for Hypertension,” Sleep, Vol. 32, No. 4, 2009, pp. 491-497.
- L. M. Walter, A. M. Foster, R. R. Patterson, V. Anderson, M. J. Davey, G. M. Nixon, J.Trinder, A. M. Walker and R. S. Horne, “Cardiovascular Variability during Periodic Leg Movements in Sleep in Children,” Sleep, Vol. 32, No. 8, 2009, pp. 1093-1099.
- G. M. Nixon, J. M. D. Thompson, D. Y. Han, D. M. Becroft, P. M. Clark, E. Robinson, K. E. Waldie, C. J. Wild, P. N. Black and E. A. Mitchell, “Short Sleep Duration in Middle Childhood: Risk Factors and Consequences,” Sleep, Vol. 31, No. 1, 2008, pp. 71-78.
- M. El-Sheikh, S. A. Erath, and P. S. Keller, “Children’s Sleep and Adjustment: The Moderating Role of Vagal Regulation,” Journal of Sleep Research, Vol. 16, No. 4, 2007, pp. 396-405.doi:10.1111/j.1365-2869.2007.00618.x
- J. M. Dekker, R. S. Crow, A. R. Folsom, P. J. Hannan, D. Liao, C. A. Swenne and E. G. Schouten, “Low Heart Rate Variability in a 2-Minute Rhythm Strip Predicts Risk of Coronary Heart Disease and Mortality from Several Causes: The ARIC Study. Atherosclerosis Risk in Communities,” Circulation, Vol. 102, No. 11, 2000, pp. 1239- 1244.
- E. B. Schroeder, L. E. Chambless, D. Liao, R. J. Prineas, G. W. Evans, W. D. Rosamond, G. Heiss and Atherosclerosis Risk in Communities (ARIC) Study, “Diabetes, Glucose, Insulin, and Heart Rate Variability: The Atherosclerosis Risk in Communities (ARIC) Study,” Diabetes Care, Vol. 28. No. 3, 2005, pp. 668-674. doi:10.2337/diacare.28.3.668
- Task Force of the European Society of Cardiology and the North American Society of Pacing and Electrophysiology, “Heart Rate Variability: Standards of Measurement, Physiological Interpretation and Clinical Use,” Circulation, Vol. 93, 1996, pp. 1043-1065.
- A. M. Bianchi, L. T. Mainardi, E. Petrucci, M. G. Signorini, M. Mainardi and S. Cerutti, “Time-Variant Power Spectrum Analysis for the Detection of Transient Episodes in HRV Signal,” IEEE Transactions on Biomedical Engineering, Vol. 40, No. 2, 1993, pp. 136-144. doi:10.1109/10.212067
- Emdin, M., Gastaldelli, A., Muscelli, E. A. Macerata, A.Natali, S. Camastra and E. Ferrannini, “Hyperinsulinemia and Autonomic Nervous System Dysfunction in Obesity: Effects of Weight Loss,” Circulation, Vol. 103, No. 4, 2001, pp. 513-519.
NOTES
*This study was funded by NIH grants: R21 HL087858-01, R01 HL63772, M01RR010732, C06RR016499.