Open Journal of Preventive Medicine
Vol.2 No.3(2012), Article ID:21554,5 pages DOI:10.4236/ojpm.2012.23052
Body size, physical activity, and exposure to television in preschoolers
![]()
1Centre for Physical Activity and Nutrition, National Institute for Public Health and Mental Health Research, Auckland University of Technology, Auckland, New Zealand; *Corresponding Author: melody.oliver@aut.ac.nz
2Department of Public Health & General Practice, University of Otago, Christchurch, New Zealand
3School of Nursing and Midwifery, The University of Queensland, Brisbane, Australia
Received 2 March 2012; revised 21 April 2012; accepted 18 May 2012
Keywords: Child; Accelerometer; Measurement; Obesity; Media; Social Environment
ABSTRACT
Objective: To investigate relationships between preschool-aged children’s body size and physiccal activity, exposure to television (TV), and parental body size. Design and Subjects: Crosssectional study of 80 children (age: 2 - 5 y, 29% overweight or obese), 73 mothers (37% overweight or obese), and 22 fathers (72% overweight or obese), residing in Auckland, New Zealand, between October 2006 and July 2007. Measurements: Body size was determined using waist circumference and body mass index (BMI). Child exposure to TV was assessed by questionnaire (number of household TV sets, presence of TV in the child’s bedroom, mean TV/ movie watching hours on weekdays and weekend days), and physical activity by 7 days of accelerometry. Results: Compared with children of normal weight/underweight mothers (classified by BMI status), the age-adjusted odds of a child being overweight/obese if their mother was overweight/obese/otherwise was 2.46 (95% CI 1.11, 5.48, P = 0.03). No other associates of child body size were identified. Conclusion: Contributors to overweight and obesity in preschool aged children are complex and likely to exist in multiple facets of young children’s lives. More detailed measurement of TV watching and other sedentary behaviours is needed. An ecological approach to identifying risk factors for increased body size in preschoolers is required.
1. INTRODUCTION
Growing obesity prevalence in preschool-aged children in developed and developing countries represents a substantial health burden [1,2]. Physical activity (PA) is fundamental to obesity prevention and treatment in preschoolers, and is essential for physical and psychological health and development [3-7]. Conversely, inactivity, often classified using sedentary behaviours such as television (TV) watching time, has been linked with increased body size in young children [8-12].
Understanding the relationships between body size, inactivity, and PA is necessary to inform effective intervention development. As part of a larger project to develop a protocol for accelerometer data reduction with preschoolers [13], we also assessed the number of household TV sets, presence of TV in the child’s bedroom, and average child TV/movie watching hours on weekdays and weekend days. Body size was determined using waist circumference (WC) and body mass index (BMI). Relationships between child body size, PA, and TV exposure were estimated using generalised estimating equation (GEE) methods.
2. METHODS
2.1. Participants
Families of children aged 2 - 5 years were invited to participate via letters from early childhood education settings and networks in Auckland, NZ, between October 2006 and July 2007. Participating families were visited at their home to gather consent and administer study measures. Children were required to be able to walk to be eligible. Ethical approval was gained from the host institution ethics committee. We certify that all applicable institutional and governmental regulations concerning the ethical use of human volunteers were followed during this research.
2.2. Body Size
Children’s and participating parents’ height was assessed to the nearest 0.1 cm using a Portable Height Scale (Mentone Educational Centre, Victoria, Australia) and weight to the nearest 0.1 kg using Seca 770 scales (Protec Solutions Ltd., Wellington, NZ). International Obesity Task Force criteria [14] was used to classify BMI status for children. For adults, thresholds of 25 and 30 kg/m2 were used to classify overweight and obesity, respectively. WC was measured to the nearest 0.1 cm using a Lufkin W606PM tape (Cooper Tools, Apex, NC, USA) and Taylor et al. [15] thresholds applied for children. Thresholds of 80 and 94 cm were used for high trunk mass in mothers and fathers, respectively [16].
2.3. Physical Activity
Participants were provided with an Actical accelerometer (Mini-Mitter Co., Inc., Bend, OR) on an elastic belt, set to collect data in 15-second epochs. Parents were asked to place the belt with the accelerometer above the child’s right iliac crest at the start of every day and to remove it prior to the child going to bed in the evening, for seven consecutive days. A questionnaire was used to gather information on child demographics, sedentary behaviours, and the child’s home environment. Families were re-visited seven days later for accelerometer collection.
Raw accelerometer data were downloaded using Actical® Version 2.04 (Mini-Mitter Co., Inc., Bend, OR, USA), and data pertaining to wear-time only were extracted. Raw data were reduced to daily average activity rates per second for individuals derived from negative binomial GEE methods with autoregressive first-order correlation structures. The activity rates are considered exchangeable repeated measures from an underlying normal distribution for each individual. The mean of these daily average rates was calculated to provide a PA measure that approximated the underlying PA characteristic for each individual.
2.4. Data Treatment
Due to small participant numbers, binary classifications of child BMI and WC were derived. Predictors of BMI and WC were simultaneously investigated in a single binomial GEE model using an exchangeable correlation structure between BMI and WC, and the robust Huber-White sandwich estimator specified. Factors with p ≤ 0.10 from unvariable analyses were added to a multivariable GEE model to predict child body size. Backward elimination of non-significant factors was conducted until the most parsimonious multivariable model was found. Residual values of the final model were tested for normal distribution using the Shapiro-Wilk test for normality and visual analysis of residuals plotted against the predicted means, associated lowess curves, and histographs.
Associations between PA and TV watching were assessed using simple linear regression. Statistical significance was set at α = 0.05 and analyses were undertaken using Stata SE version 9.2 (StataCorp, TX, USA) and SAS version 9.1 (SAS Institute Inc., Cary, NC, US).
3. RESULTS
Of the 688 families that received invitation letters, 93 registered with the study, and 80 children, 73 mothers, and 22 fathers completed the body size measurement protocol. Participant body size characteristics are provided in Table 1. Children were aged 2 - 5 years (median 4 years), and predominantly NZ European (84%, Maori 6%, Chinese 4%, other 6%). No significant differences were found between boys and girls in age, ethnicity, BMI status, or trunk mass status (all Fisher’s exact tests p > 0.05). Child BMI status and child WC status were associated (Φ = 0.20).
Two children had a TV in their bedroom; the small numbers in this category meant that bedroom TV presence could not be considered in analyses. All households owned at least one TV. Of the 67 children with complete questionnaire data, a majority watched less than 2 hours of TV/movies during weekdays (n = 52, 78%) and weekend days (n = 42, 62%). Fair agreement (κ = 0.39) was found between average daily TV/movie watching on weekdays and weekend days; no significant asymmetry was found for this relationship (p = 0.08).
Three children withdrew from the study, and PA data for 12 children was lost due to accelerometer failure. In total, PA data was gathered for 78 children, over a median of 7 days (range 1 - 9 days) for 11.1 (range 2.4 - 17.8) hours per day. Accelerometer counts were highly overdispersed with a median dispersion parameter of 9.95 (4.17, 20.18). GEE modelling of the data revealed a positive serial correlation between successive epochs (median 0.58, range 0.29, 0.76).
Means of estimated daily average rates per second (on the natural logarithmic scale) ranged from 0.81 to 2.39
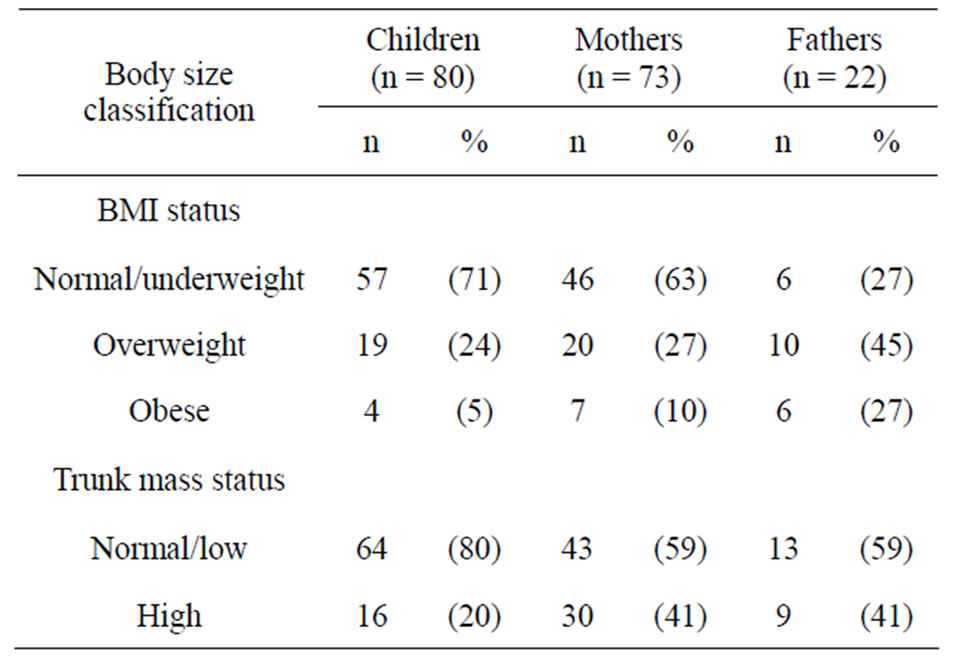
Table 1. Participant body size characteristics.
(median 1.72), meaning the median estimated average accelerometer counts per minute is exp(1.72) × 60 = 335.1. Variation in estimated average activity rates was greater between children than within children (0.62 vs. 0.11). The Shapiro-Wilk’s test of the regression’s residuals revealed no evidence for non-normality, and no pattern or heterogeneity in plots of residuals by predicted values was found. Average rate was not associated with any of the TV measures.
Table 2 shows the GEE results for body size measures and potential associates. Due to low paternal participation, paternal body size measures could not be considered. Only maternal BMI status remained significantly associated with child body size in the multivariable model.
4. DISCUSSION
This is the first study to investigate associations between body size, TV exposure, and objectively-assessed PA in preschool-aged children, accounting for both a child’s WC and BMI, and using a novel approach to accelerometer data reduction. After accounting for child age, maternal overweight/obesity was associated with an increased risk of being overweight or obese in preschoolers, and no other significant associations were found.
The null findings for TV exposure and body size were unexpected. Earlier studies have demonstrated a positive relationship between TV watching and BMI and/or body fatness [8-12,17-19]. In their meta-analysis of PA, media exposure, and body fatness in preschoolers, Marshall
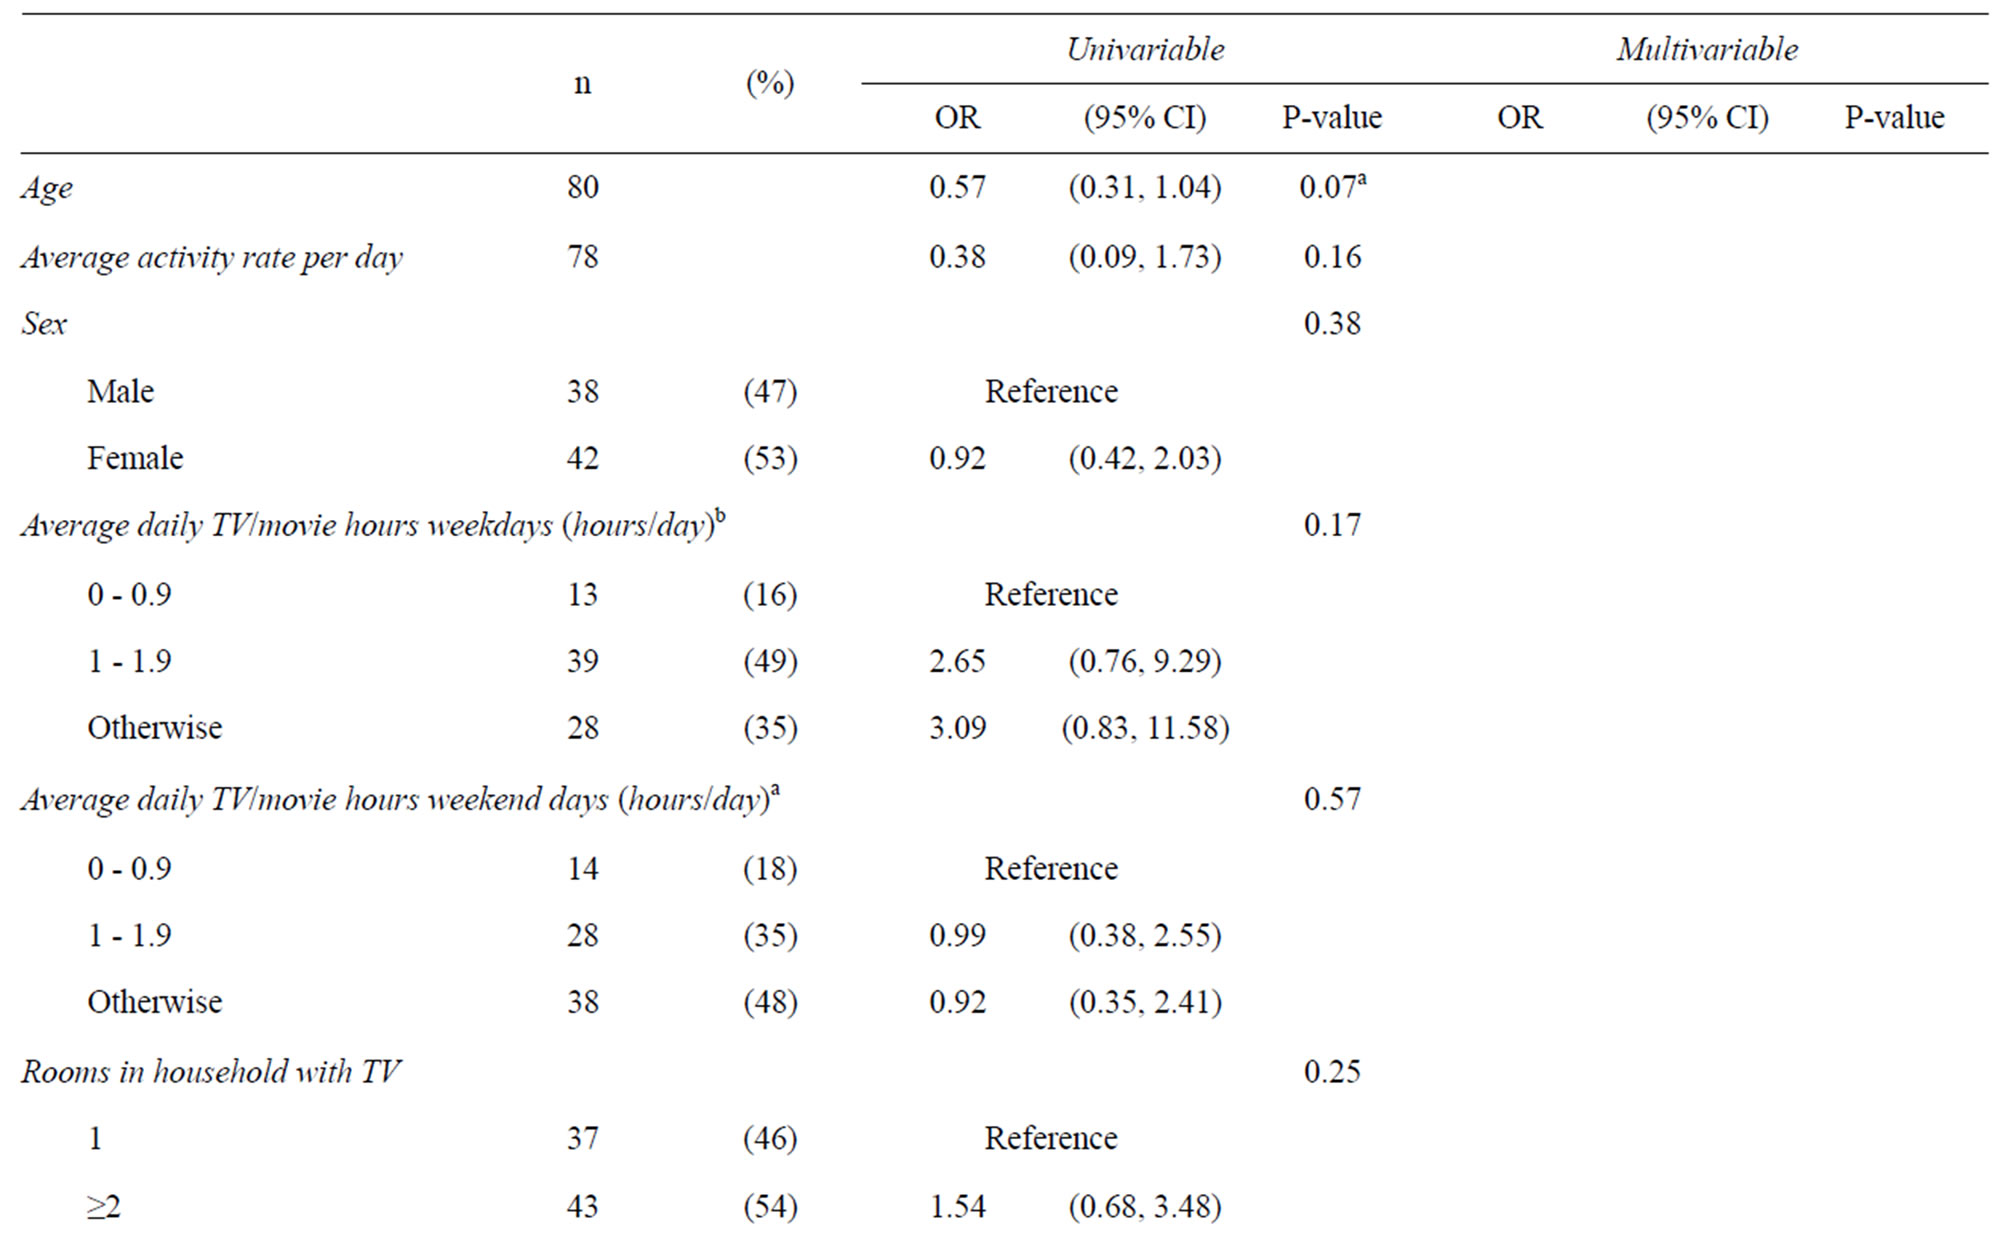
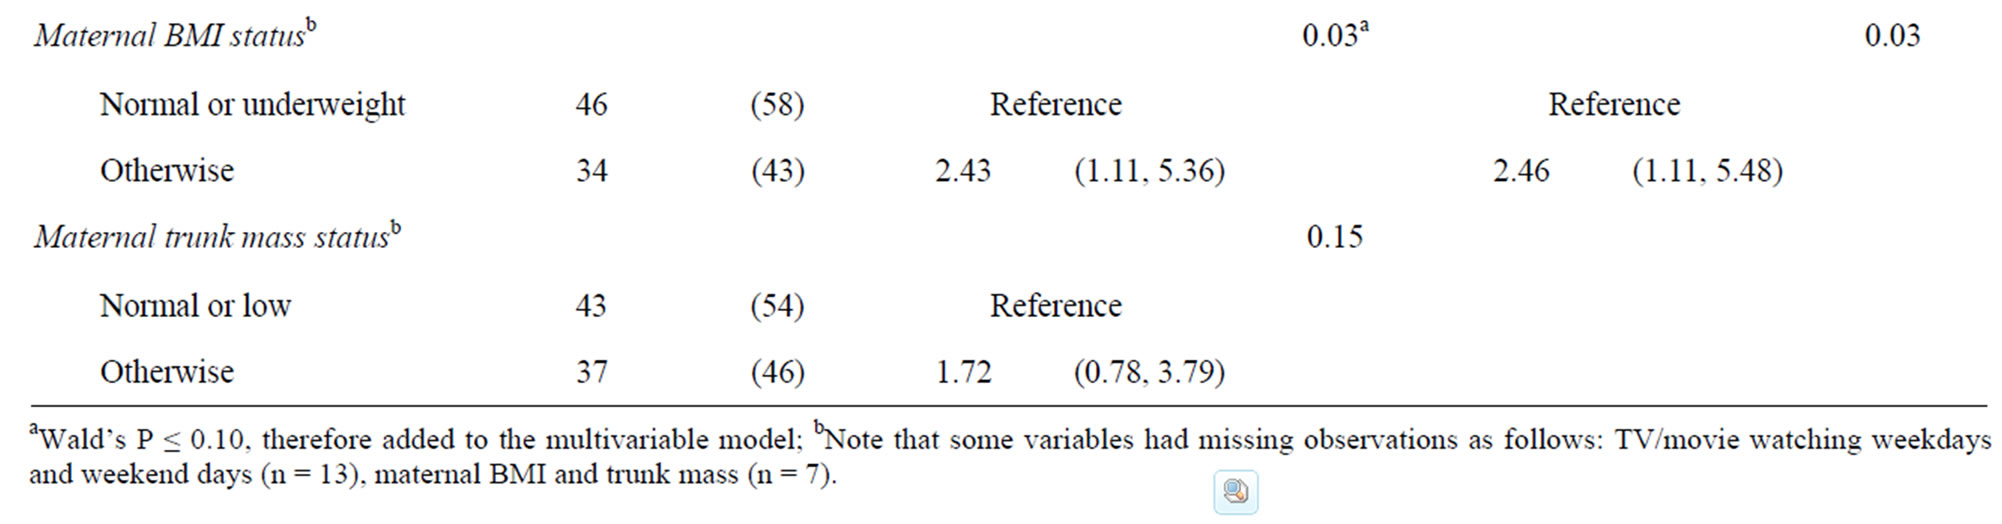
Table 2. Number of subjects (n), univariable and multivariable odds ratios (OR) and associated 95% confidence intervals (95% CI) of coefficient estimates from GEE analyses of relating various explanatory variables to children’s body size (BMI and waist circumference).
et al. [20] found only small relationships between body fatness and TV hours (r = 0.08; 95% CI 0.06, 0.08; P < 0.01) or video/computer time (r = 0.13; 95% CI 0.05, 0.19; P < 0.01), indicating that although important, these variables are only one component of explaining preschooler weight status. The use of proxy report and limited variability in TV watching found in this study was also unlikely to be sufficiently sensitive to detect between-individual differences in relationships. More detailed, objective, and sensitive information on TV watching patterns and other indicators of sedentary behaviours is required.
TV and movie watching on weekend days was not associated with PA in our sample of preschoolers. Previous studies have shown contrasting results, with accelerometer-determined PA and hours of TV watching having either no association or a positive relationship with PA [18,19], while a meta-analysis of PA in children aged 3 - 18 years reported small negative relationships with TV time (r = −0.13; 95%CI 0.08, 0.11; P < 0.01) and video/ computer time (r = −0.14; 95% CI 0.08, 0.13; P < 0.01) [20]. Utilisation of differing measurement approaches impede better understanding this relationship, however, it is also likely that individual differences in TV and PA profiles further obscure any associations. It is likely that individual differences in activity profiles exist, whereby preschoolers exhibit various dimensions of PA and TV watching, and that health outcomes differ for each [9]. Categorisation of activity dimensions (e.g., high PA/low TV, high PA/high TV, low PA/low TV, low PA/high TV) would likely provide a more comprehensive understanding of preschoolers’ activity behaviours and their relationships with body size. The innovative approach taken to accelerometer data reduction in this study eliminated issues with data treatment including calculating intensity thresholds and defining a “day”, and allowed for all data to be included in analyses. Stringent tests were employed to ensure the analytical approaches and data distribution assumptions made were appropriate. Although largely compliant, the small number of participants was the main study limitation. A larger number of study participants would have provided better opportunities to identify and elucidate relationships between activity dimensions and body size in young children.
5. CONCLUSION
Contributors to overweight and obesity in preschool aged children are complex and likely to exist in multiple facets of young children’s lives. More detailed measurement of TV watching and other sedentary behaviours is needed. An ecological approach to identifying risk factors for increased body size in preschoolers is required. Encouraging families (especially fathers) of preschool-aged children to participate in studies of this nature may pose considerable challenges for PA researchers.
6. ACKNOWLEDGEMENTS
This research was supported by funding from Sport and Recreation New Zealand and also through a National Heart Foundation of New Zealand Postdoctoral Fellowship for the primary author.
REFERENCES
- Kim, J., Peterson, K.E., Scanlon, K.S., Fitzmaurice, G.M., Must, A., Oken, E., et al. (2006) Trends in overweight from 1980 through 2001 among preschool-aged children enrolled in a health maintenance organization. Obesity, 14, 1107-1112. doi:10.1038/oby.2006.126
- World Health Organization (2004) Obesity: Preventing and managing the global epidemic: Report of a WHO consultation. WHO, Geneva.
- Trost, S.G., Sirard, J.R., Dowda, M., Pfeiffer, K.A. and Pate, R.R. (2003) Physical activity in overweight and nonoverweight preschool children. International Journal of Obesity, 27, 834-839. doi:10.1038/sj.ijo.0802311
- Vásquez, F., Salazar, G., Andrade, M., Vásquez, L. and Diaz, E. (2006) Energy balance and physical activity in obese children attending day-care centres. European Journal of Clinical Nutrition, 60, 1115-1121. doi:10.1038/sj.ejcn.1602426
- Barlow, S.E. and the Expert Committee (2007) Expert Committee recommendations regarding the prevention, assessment, and treatment of child and adolescent overweight and obesity: Summary report. Pediatrics, 120, S164-S192. doi:10.1542/peds.2007-2329C
- Council on Sports Medicine and Fitness and Council on School Health (2006) Active healthy living: Prevention of childhood obesity through increased physical activity. Pediatrics, 117, 1834-1842. doi:10.1542/peds.2006-0472
- Timmons, B.W., Naylor, P. and Pfeiffer, K.A. (2007) Physical activity for preschool children—how much and how? Canadian Journal of Public Health, 98, S122- S134.
- Mendoza, J.A., Zimmerman, F.J. and Christakis, D.A. (2007) Television viewing, computer use, obesity, and adiposity in US preschool children. International Journal of Behavioral Nutrition and Physical Activity, 4, 44. doi:10.1186/1479-5868-4-44
- Proctor, M.H., Moore, L.L., Gao, D., Cupples, L.A., Bradlee, M.L., Hood, M.Y., et al. (2003) Television viewing and change in body fat from preschool to early adolescence: The Framingham Children’s Study. International Journal of Obesity and Related Metabolic Disorders, 27, 827-833. doi:10.1038/sj.ijo.0802294
- Janz, K.F., Levy, S.M., Burns, T.L., Torner, J.C., Willing, M.C. and Warren, J.J. (2002) Fatness, physical activity, and television viewing in children during the adiposity rebound period: The Iowa bone development study. Preventive Medicine, 35, 563-571. doi:10.1006/pmed.2002.1113
- Reilly, J.J., Armstrong, J., Dorosty, A.R., Emmett, P.M., Ness, A., Rogers, I., et al. (2005) Early life risk factors for obesity in childhood: Cohort study. British Medical Journal, 330, 1357. doi:10.1136/bmj.38470.670903.E0
- Dennison, B.A., Erb, T.A. and Jenkins, P.L. (2002) Television viewing and television in bedroom associated with overweight risk among low-income preschool children. Pediatrics, 109, 1028-1035. doi:10.1542/peds.109.6.1028
- Oliver, M., Schluter, P.J. and Schofield, G.M. (in submission) objectively assessed physical activity in preschoolers and their parents. Journal of Science and Medicine in Sport.
- Cole, T.J., Bellizzi, M.C., Flegal, K.M. and Dietz, W.H. (2000) Establishing a standard definition for child overweight and obesity worldwide: International survey. British Medical Journal, 320, 1240-1245. doi:10.1136/bmj.320.7244.1240
- Taylor, R.W., Jones, I.E., Williams, S.M. and Goulding, A. (2000) Evaluation of waist circumference, waist-to-hip ratio, and the conicity index as screening tools for high trunk fat mass, as measured by dual-energy X-ray absorptiometry, in children aged 3-19 y. American Journal of Clinical Nutrition, 72, 490-495.
- Lean, M.E., Han, T.S. and Morrison, C.E. (1995) Waist circumference as a measure for indicating need for weight management. British Medical Journal, 311, 158-161. doi:10.1136/bmj.311.6998.158
- Hancox, R.J., Milne, B.J. and Poulton, R. (2004) Association between child and adolescent television viewing and adult health: A longitudinal birth cohort study. The Lancet, 364, 257-262. doi:10.1016/S0140-6736(04)16675-0
- Roemmich, J.N., Epstein, L.H., Raja, S., Yin, L., Robinson, J. and Winiewicz, D. (2006) Association of access to parks and recreational facilities with the physical activity of young children. Preventive Medicine, 43, 437-441. doi:10.1016/j.ypmed.2006.07.007
- Heelan, K.A. and Eisenmann, J.C. (2006) Physical activity, media time, and body composition in young children. Journal of Physical Activity and Health, 3, 200-209.
- Marshall, S.J., Biddle, S.J.H., Gorely, T., Cameron, N. and Murdey, I. (2004) Relationships between media use, body fatness and physical activity in children and youth: A meta-analysis. International Journal of Obesity, 28, 1238-1246. doi:10.1038/sj.ijo.0802706