Open Journal of Statistics
Vol. 2 No. 1 (2012) , Article ID: 16879 , 10 pages DOI:10.4236/ojs.2012.21015
Efficiency in the Further Education Sector in England
Department of Economics, Lancaster University Management School, Lancaster University, Lancaster, UK
Email: j.johnes@lancaster.ac.uk
Received September 23, 2011; revised October 28, 2011; accepted November 7, 2011
Keywords: Data Envelopment Analysis; Efficiency; Further Education Sector; Classical Median Problem
ABSTRACT
Further education in England is a diverse sector which typically provides education for the 16 - 19 age group. This study investigates efficiency levels by subject of study within further education (FE) colleges. Mean overall technical efficiency is found to vary from 75% to 86% in the worstand best-performing subject areas, respectively. Statistical analysis of efficiency reveals that, while student and teacher composition and regional characteristics affect efficiency in each subject, the strength of these effects can vary by subject. This has the clear policy implication that strategies to improve efficiency in English FE must be devised and operated at subject rather than provider level.
1. Introduction
The system of education in the UK is organised into four broad sectors: primary schooling, which terminates at age 11; secondary education, completed at around the age of 16; further education which typically serves students between the ages of 16 - 19 and is pre-degree level; higher education which serves the 18/19+ age group and is degree and post-degree level. While the quality of provision in the primary, secondary and higher education sectors in England has been the subject of scrutiny for some considerable time, the quality of education in the further education (FE) sector in England has been largely ignored. The Foster Report [1] highlights the need for assessing the quality of FE provision, and this has been reiterated in a White Paper [2], which calls for the construction of performance indicators to allow clear and meaningful comparisons between FE providers, and to create incentives for the providers to focus on the achievement and progression of their students. It is envisaged that these incentives might ultimately be strengthened by linking the distribution of funds to performance indicators [2].
Performance in the FE sector has, in fact, improved in recent years [1]. The proportion of students achieving a qualification, known as the “learner success rate”, has risen from 59 percent in 2000/01 to 72 percent in 2003/04, whereas the retention rate, which is another key performance indicator, has remained reasonably stable at around 84 percent. Of concern, however, are the wide variations in learner success rates and retention rates between providers of further education. Thus, despite the increase nationally in the learner success rate over a 6-year period, the gap between best and worst performer has not changed [1], and this therefore suggests that there are considerable variations in the efficiency with which the outputs of FE are provided. This should be of great concern: any government policy to raise the school leaving age will have a huge impact on this sector of education.
There is little literature on efficiency in the FE sector. An exception is a study which uses data envelopment analysis (DEA) to derive efficiency scores for a sample of nearly 200 FE colleges over the period 1998/99 to 2002/03, and which found that the efficiency in the sector as a whole was around 85% over the five-year period, but this varied between colleges from under 40% to 100% [3]. This previous study, however, ignores the considerable differences between subjects within and between providers, in terms of both inputs, such as staff turnover, and outputs, such as learner success rates and retention rates [2].
This paper therefore addresses two issues. First, we calculate efficiency scores in English FE at the subject level using the learner success rate and retention rate as outputs. This part of the analysis adds to the existing literature which attempts to do the same for the secondary and higher education sectors [4-6]. Second, we investigate the determinants of efficiency at the subject level, adding to the much smaller literature which focuses on the higher education sector [5,6]. Our analysis uses previously unused data obtained from the Learning and Skills Council (LSC) for the period 2002 and 2003. Our hypothesis is that policies to improve the efficiency of FE providers might be better developed at the subject, rather than the provider, level.
2. The FE Sector and the Data
2.1. The FE Sector
The largest group of FE providers in England is made up of General FE and Tertiary colleges, which are large institutions offering a broad range of vocational and academic subjects at various levels, and are attended by both young people (16 - 19 year olds) and adults. Sixth Form colleges are another substantial group and have traditionally catered for 16 - 19 year olds taking academic Advanced level courses. More recently, however, they have broadened both their course offering and their student profile. Specialist Colleges concentrate on specific areas of the curriculum such as art and design, dance and drama or land based subjects. They often have well developed links with employers and industry because of the specialist nature of the subjects taught. Finally, Specialist Designated institutions cater mainly for adults, as do External Institutions. The latter, however, also cater to the needs of educationally disadvantaged students. For the purposes of this study, these two groups are amalgamated into “External and specialist institutions”.
Most colleges derive the majority (78 percent) of their income centrally from public sources, which is distributed by the LSC since it was set up in 2001. Funding is allocated on the basis of a formula which has five components. These are: a national base rate, reflecting the length and cost of the provision of various programmes; a weighting for more costly programmes or courses; a weighting for learners achieving the programme; an uplift applied for colleges taking learners from specified disadvantaged backgrounds; and finally an additional amount paid to colleges in geographical areas where provision is more costly (e.g. London). Funding in the FE sector is therefore partly based on inputs and partly tied to outputs.
2.2. The Data
The data used in this analysis were obtained from the administrative records of the LSC and refer to the period 2001/02 and 2002/03. There are around 600 FE providers in England, and a record is kept, by each FE college, of every qualification studied by each student. Each qualification is assigned by the LSC to one of 14 areas of learning (AOLs) on the basis of the subject. The current definitions of AOLs were introduced in 2001/02 and are shown in Table 1 along with the broad subject areas used in the later analysis. There are around 12,500 observations in total in the study period, but when we link these observations to data on student and staff numbers and characteristics, the sample falls to just under 5000 observations (across nearly 350 providers).
Measures of student success by AOL and FE college are defined as follows: the achievement rate—the proportion of all aimed-for qualifications1 (within an AOL) which are actually achieved; the retention rate—the proportion of students (within an AOL) who are retained from one year to the next. Since the achievement rate is based on the achievement of individual modules and the retention rate is based on students, some of whom can successfully pass some modules (i.e. achieve some quailfication) before dropping out, these two measures are distinct.
Mean achievement (Ach) and retention (Ret) rates are displayed by broad subject area in Table 2. Mean values
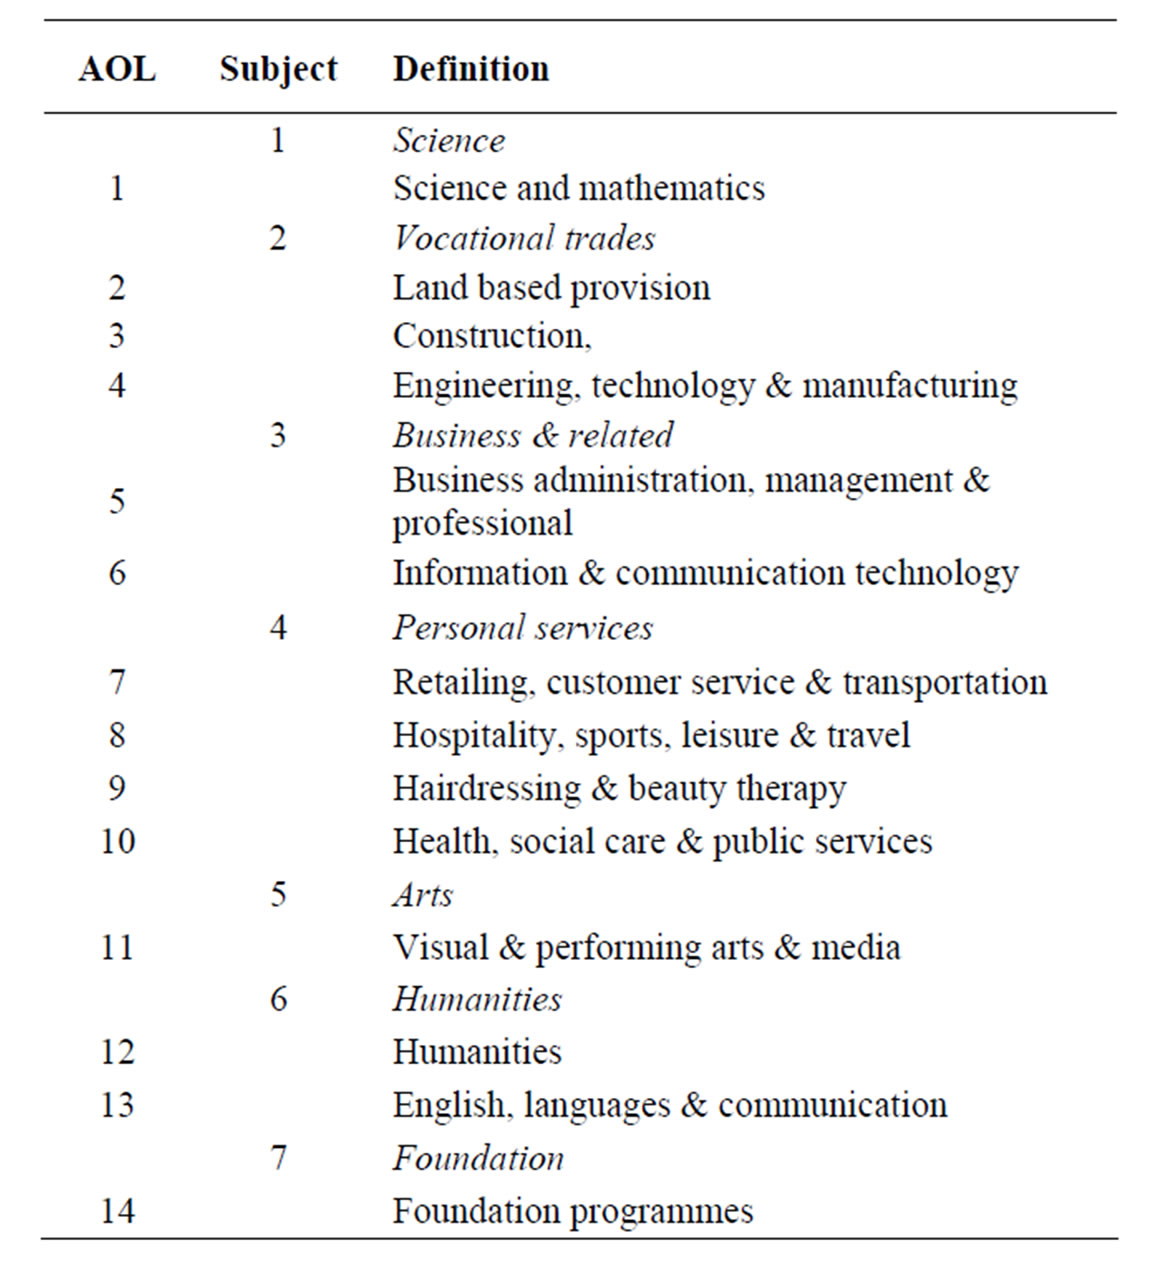
Table 1. Definitions of AOLs and broad subject areas.
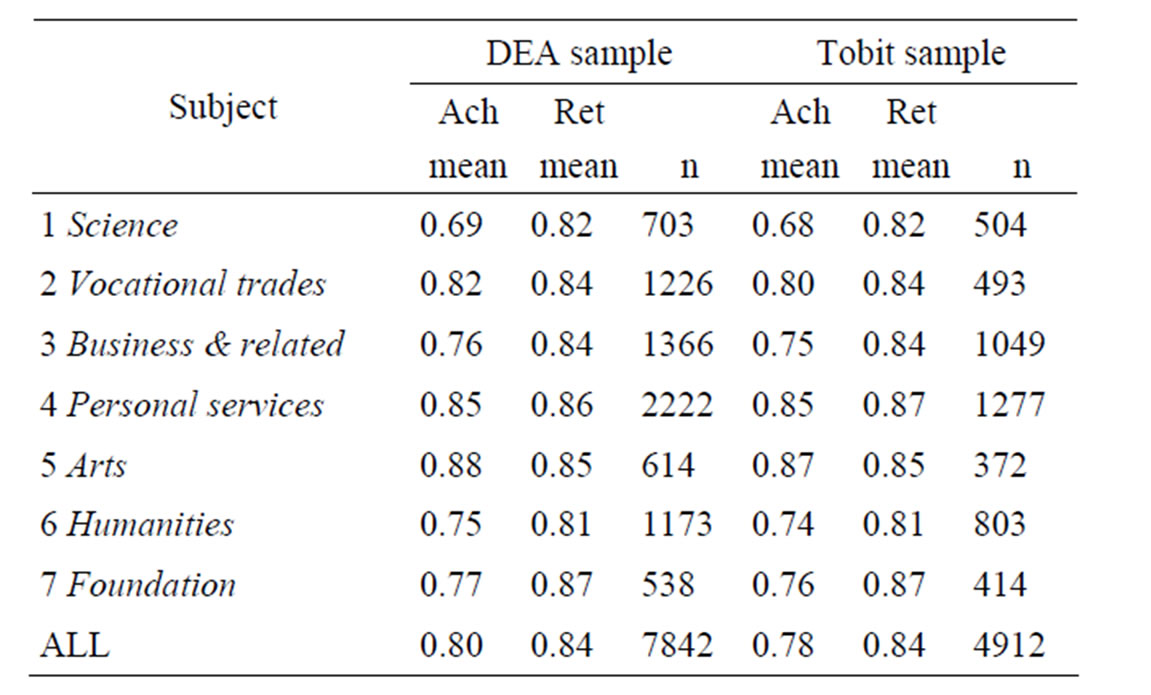
Table 2. Mean achievement and retention rates for the DEA and Tobit samples.
are presented for two samples of data used in the subsequent analysis—the DEA and the tobit analysis. It should be noted that these broadly reflect the population values (not shown). “Science”, where 70% of the qualifications aimed for in these courses are actually achieved, is the subject area with the lowest achievement rate. “Arts” experiences the highest achievement rate at around 85%. These compare with an average across all subjects of 80%. The range of performance on student retention is narrower, varying from around 80% in “Humanities” to 87% on “Foundation” programmes, both compared to mean performance of 84%.
Achievement and retention rates also vary by type of college (not shown). General/Tertiary FE colleges are actually the worst performers on the achievement rate relative to Sixth Form and Specialist colleges in all but 2 broad subject areas (“Humanities” and “Foundation” programmes), where they are the second best performers. General/Tertiary FE colleges are also the worst performers on the retention rate in all but one subject area (“Foundation” programmes). Specialist colleges, in contrast, perform best on the retention rate in 6 of the 7 broad subject areas.
3. Methodology and Models
3.1. The Measurement of Technical Efficiency
Distance functions offer a methodological approach to measuring efficiency which is particularly useful in the context of further education because it allows for both multiple inputs and multiple outputs; it requires no knowledge of either input or output prices; and there are no underlying optimisation assumptions such as cost minimisation or profit maximisation. Let us define the production technology of a decision making unit (DMU), in this case an AOL with a FE provider, as P, which represents the transformation of the inputs x into the outputs y, i.e. : x can produce y). The output distance function
 measures technical efficiency and is defined elsewhere [7,8]. It is noted that a DMU which has a value of
 equal to 1 is deemed 100% technically efficient, while one which has
  is below 1 is deemed inefficient.
The estimation of the distance function can be performed using parametric or non-parametric techniques. A parametric estimating method requires the specification of a functional form for the distance function, and assumptions regarding the statistical distributions of the stochastic errors and efficiencies. Any one (or all) of these assumptions, if incorrect, could introduce bias into the results. In addition, while it is possible to incorporate both multiple inputs and multiple outputs into the parametric model it is not particularly straightforward to do so. For these reasons we prefer to take a non-parametric approach by using DEA [9,10] to estimate the technical efficiency of AOLs within FE providers. DEA resolves the disadvantages of the parametric approach, and it has an additional advantage, namely that it allows each unit to choose its own input and output weights to show it at its best. In the context of FE, where there is considerable diversity and difference in priorities across departments in FE institutions, this is an attractive feature. It should be noted, however, that DEA is a deterministic technique which makes no allowance for stochastic errors (these are incorporated into the measure of efficiency), and this may well be a serious drawback in the context of education. For the precise linear programming equations required to derive the DEA efficiencies see [11].
A two-stage approach, whereby some variables are held back from the DEA and used in a second stage statistical analysis as possible explanatory variables of the efficiency scores, is commonly used in studies of efficiency in the education context [12-15]. Standard practice is to specify in the DEA those inputs which are largely under the control of the DMU, while factors which are beyond their control are reserved for a second stage analysis of the efficiency scores (see Section 3.2).
Our DEA is conducted at the level of the AOL, and so each AOL (within an FE college) can be thought of as a DMU. Generally speaking, FE providers take raw materials (students) and convert these (using teachers) into qualified students. We therefore specify a simple DEA model as follows:
Inputs:
TEACHij the total number of teaching staff in each FE college i, AOL
STUDij the total number of students in each FE college i, AOL
Outputs:
RETNUMijthe number of retained students in FE college i, AOL
ACHVij the number of aimed-for qualifications which are actually achieved in FE college i, AOL .
.
The inputs to the FE production process therefore reflect quantity, while the quality of the inputs is ignored. Variables reflecting student and teacher quality are therefore considered for inclusion in the second stage analysis of the efficiencies.
3.2. Multivariate Analysis of the Factors Affecting Efficiency
The DEA technique produces efficiency scores which are bounded by 0 and 100 (although the left hand boundary is not observed). Thus we use a tobit model for investigating the determinants of efficiency [3].
The socio-demographic composition of the student population can be expected to affect the efficiency of FE colleges and their constituent departments. For example, the educational attainment of girls is higher than that for boys in FE, particularly in academic subjects [15], and boys are more likely to drop out [16]2. Subject variations are likely, however, insofar as boys tend to choose, and do relatively better in, mathematics-based subjects, whereas girls do better in English, humanities and languages [15]. In addition, students from ethnic minority backgrounds tend to stay on in FE to close the so-called “qualification gap” and prefer to do so through academic rather than vocational courses [18], and are less likely to drop out. Student age is also a determinant of both achievement and retention: evidence based on higher education students within a further education context suggests that older students are more likely to complete a course and to achieve higher grades than their younger counterparts [19]. Socio-economic background is also known to affect student achievement [15,16,18], although less so at the post-compulsory schooling stage. The percentage of students in each AOL who do not qualify for widening participation uplift factor is included as a measure of socioeconomic background.
The environmental or socio-demographic characteristics of the locality in which the FE provider is located can also be expected to affect its efficiency. The local unemployment rate is included because it may increase the FE provider’s efficiency score via its effects on student attainment and particularly student retention. A high rate of unemployment may encourage students to stay on, rather than drop out, because opportunities in the labour market are scarce (a discouraged worker effect), and it may lead to higher attainment insofar as students work harder to secure a job once they complete FE. These effects may be particularly strong for students on courses, such as Vocational trades through to Personal services, since they have a more explicit focus on preparing students for entry to the labour market after their course has been completed. The percentage of the local population with no qualifications is also included to capture the effect of family background. This is crude but it is expected that localities with a high proportion of unqualified adults will have students from low income families. Students from these backgrounds are more likely to drop out and have lower educational attainment [16,18].
The size of department (measured here by the number of students in each AOL and its square) may affect overall efficiency within the subject area. Subject areas with more teachers are more likely to specialize in teaching particular aspects of the curriculum, which feeds through to higher attainment and retention rates. In addition, the size of the FE provider within which the AOL is located may affect efficiency, insofar as larger providers are more able to offer support services, library and computing facilities since funding per student tends to be higher. Thus the size of the college and its square are also included.
We also construct a number of variables relating to the quality of the staff in the colleges, such as their average age and experience; more experienced staff should be better teachers and hence raise attainment, whereas older teachers may be less attuned to the needs of their students which have the consequence of reducing retention rates. The “fit” between the background of staff and those of students is also explored by including the ratio of teachers from a particular ethnic background to the student equivalents. There is evidence to suggest that when teachers and pupils have the same ethnic background, teachers have increased subjective perceptions of those students and their performance [20]. Thus a higher ratio might be expected to feed through into better exam results and increased retention.
It is possible that there may be temporal variations in efficiency that are not controlled for by the time varying covariates described above, therefore we also include a year dummy in our second stage models. Similarly, there be broad institutional differences in efficiency that are unaccounted for by the staff and student composition variables, hence the type of FE provider is also included in our models.
4. Results
4.1. Subject Variations in Technical Efficiency
The results of applying an output-oriented DEA with constant returns to scale (CRS), using the software package PIM DEAsoft V2, to the sample data for 2002 and 2003 (respectively) are summarised in Table 3. The gap between the worstand best-performing AOLs is around 13 percentage points, on average. “Health” is the AOL with the lowest mean efficiency at almost 72%. The broad subject area “Personal services” of which “Health” is a part has a generally low average efficiency at 75%. This result is unexpected insofar as student achievement and retention in the “Personal services” subject area generally are very high (see Table 2). In contrast, the best-performing broad subject area (in terms of DEA efficiency) is the “Arts”. We also computed equivalent efficiencies for the tobit sample (not shown) which were almost identical to those reported in Table 3.
There is evidence of a significant difference in the performance of the different types of FE provider [3]. Table 4 shows that, on average, and for all subject areas combined, Sixth Form colleges are around 8 percentage points more technically efficient than General and Tertiary FE colleges, and around 11 percentage points more efficient than Specialist colleges. Moreover, Table 4 offers evidence that differences in the performance of specific groups of colleges persist even at broad subject area level. Sixth Form colleges are top performers in all but two subject areas, the exceptions are “Humanities” and “Foundation”. In these two subject areas, Specialist colleges are the best performers. General and Tertiary FE colleges are therefore consistently poor performers in all subject areas.
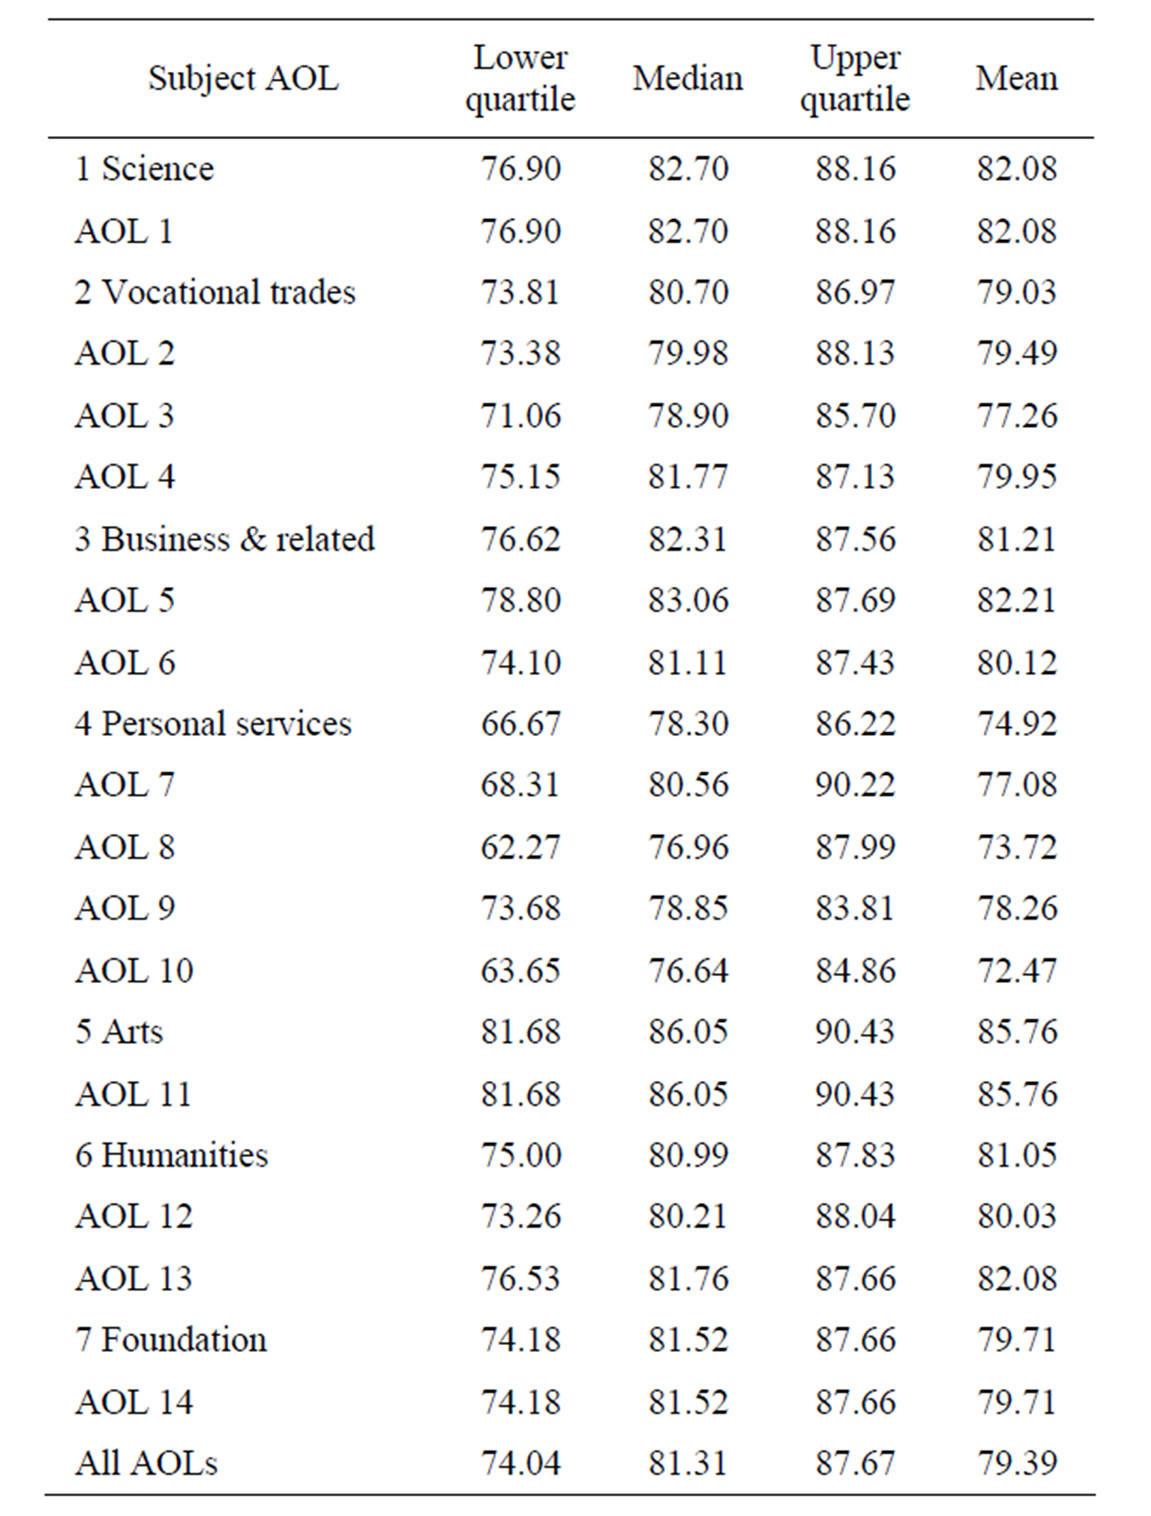
Table 3. Summary of overall (CRS) technical efficiencies by AOL and by broad subject area.
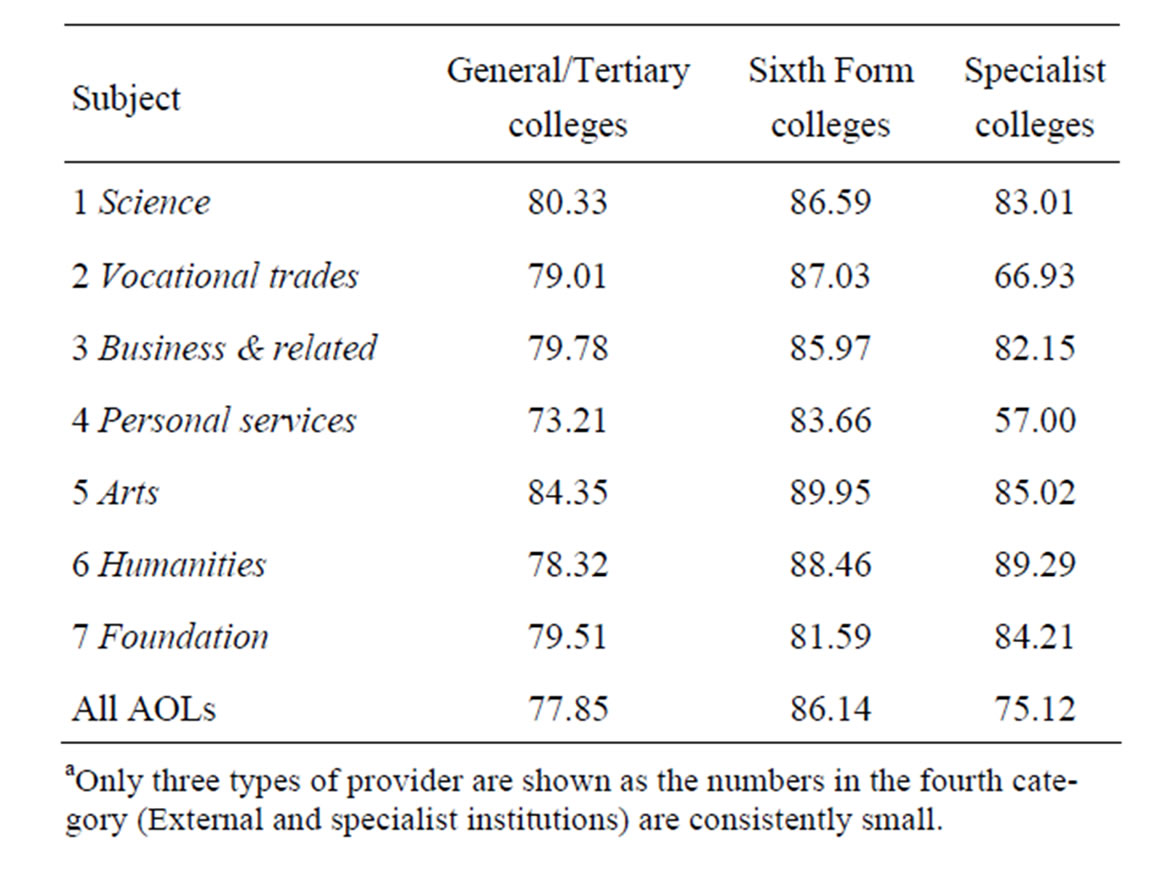
Table 4. Mean overall (CRS) technical efficiencies by broad subject area and type of FE providera.
4.2. The Determinants of Technical Efficiency: Evidence from a Pooled Model
The variation in efficiency by AOL and by type of FE provider requires further investigation using tobit analysis, and the results of this are displayed in Table 5. With regard to student gender, a 10 point increase in the percentage of female students increases overall technical efficiency by 1.8 percentage points. The ethnic background of students is also a significant determinant of overall technical efficiency: the larger the percentage of students from an Indian background the higher the technical efficiency of the FE provider. Students from a minority ethnic background, and especially the Indian group, may work harder at college to close the achievement gap between themselves and their white counterparts to offset expected discrimination once they enter the labour market. Insofar as this greater effort leads to a lower drop-out rate and higher achievement rate amongst these groups (and there is evidence from secondary schools [21] that ethnic minority pupils make better progress (on average) in terms of their attainment than their white counterparts), the outcome is greater efficiency. Socio-economic status also has a positive effect on efficiency: an increase in the percentage of students from more prosperous home backgrounds, reflected by the percentage of students ineligible for the widening participation funding, increases technical efficiency. In contrast, a higher percentage of mature students (aged 19 or over) reduces the technical efficiency of the FE provider. This effect (which contrasts with the findings of [19]) may arise because mature students face greater financial constraints, which means that maintaining a presence at college is more difficult to achieve.
Turning now to environmental variables which reflect the geographical location of the college, the unemployment rate, as expected, has a positive effect on efficiency, as does the education level of the adult of the local area, which acts as a proxy for the socio-economic composition of the catchment area of the college.
There is little evidence that scale matters insofar as the coefficient estimates for AOL size and College provider size are small. Provider type, however, is highly significantly related to efficiency. Sixth Form colleges have higher technical efficiency scores by around 4 percentage points when compared to General/Tertiary colleges. This is a little smaller than the gap in raw efficiency scores observed in Table 4, reflecting the effect of differences in student, teacher and environmental characteristics. Specialist colleges, on the other hand, have overall efficiency levels which are on average around 6 percentage points lower than General and Tertiary FE colleges. This is much larger than the gap observed in the raw efficiency levels (Table 4).
The focus of this paper is upon variations in efficiency scores by subject area. What is clear from Table 5 is that, even after taking into account a host of variables which vary at the subject level, additional effects are picked up by the subject area dummy variables. Furthermore, these variables are very important determinants of provider efficiency in terms of statistical significance and magnitude. In the cases of 3 subject areas (“Personal services”, the “Arts” and the “Humanities”) the difference in efficiency scores relative to “Science”, the base case, is largely the same as that observed in Table 4. For the remaining 3 subject areas, this is not the case. Controlling for other factors the efficiency scores of “Vocational trades”, “Business & related” and “Foundation” programmes are now higher than for “Science” courses (see Table 4). In the case of “Vocational trades”, efficiency is 8.5 percentage points higher than in “Science” subjects once both studentand teacher-related variables are taken into account. Why these subject level variations occur requires a disaggregated analysis for each broad subject area, which we turn to in the following section.
The most statistically significant teacher-related variable affecting technical efficiency is the ratio of students to teachers which has a non-linear effect. The result suggests that increasing class size has a positive effect within the range of student to staff ratios observed in the sample data. Moreover, this result remains even when AOL and provider size are dropped from the equation, suggesting that the result is not simply caused by correlation between the various size variables: class, AOL and provider size. This counter-intuitive result is not out of line with previous evidence [22], and may be because an institution which is popular (possibly because it is known to be effective) may consequently have a higher class size—hence a positive relationship between the pupil to staff ratio and efficiency as is found here.
The average age of teachers is negatively related to technical efficiency up to an age of 39 years, after which efficiency rises with age. In contrast, the experience variables are statistically insignificant. Possible multicollinearity between age and experience was investigated by dropping the experience variables, but the result remained unchanged. Many of the other teaching variables are statistically insignificant.
4.3. A Disaggregated Analysis by AOL
The limitation of the results in the previous section is that we assume that the nature of the production process in each subject area is identical, except for a shift given by the broad subject dummy variables. In this section we present the results of performing the analysis separately for each broad subject area and these are displayed in Table 6. Several interesting findings emerge. The degree
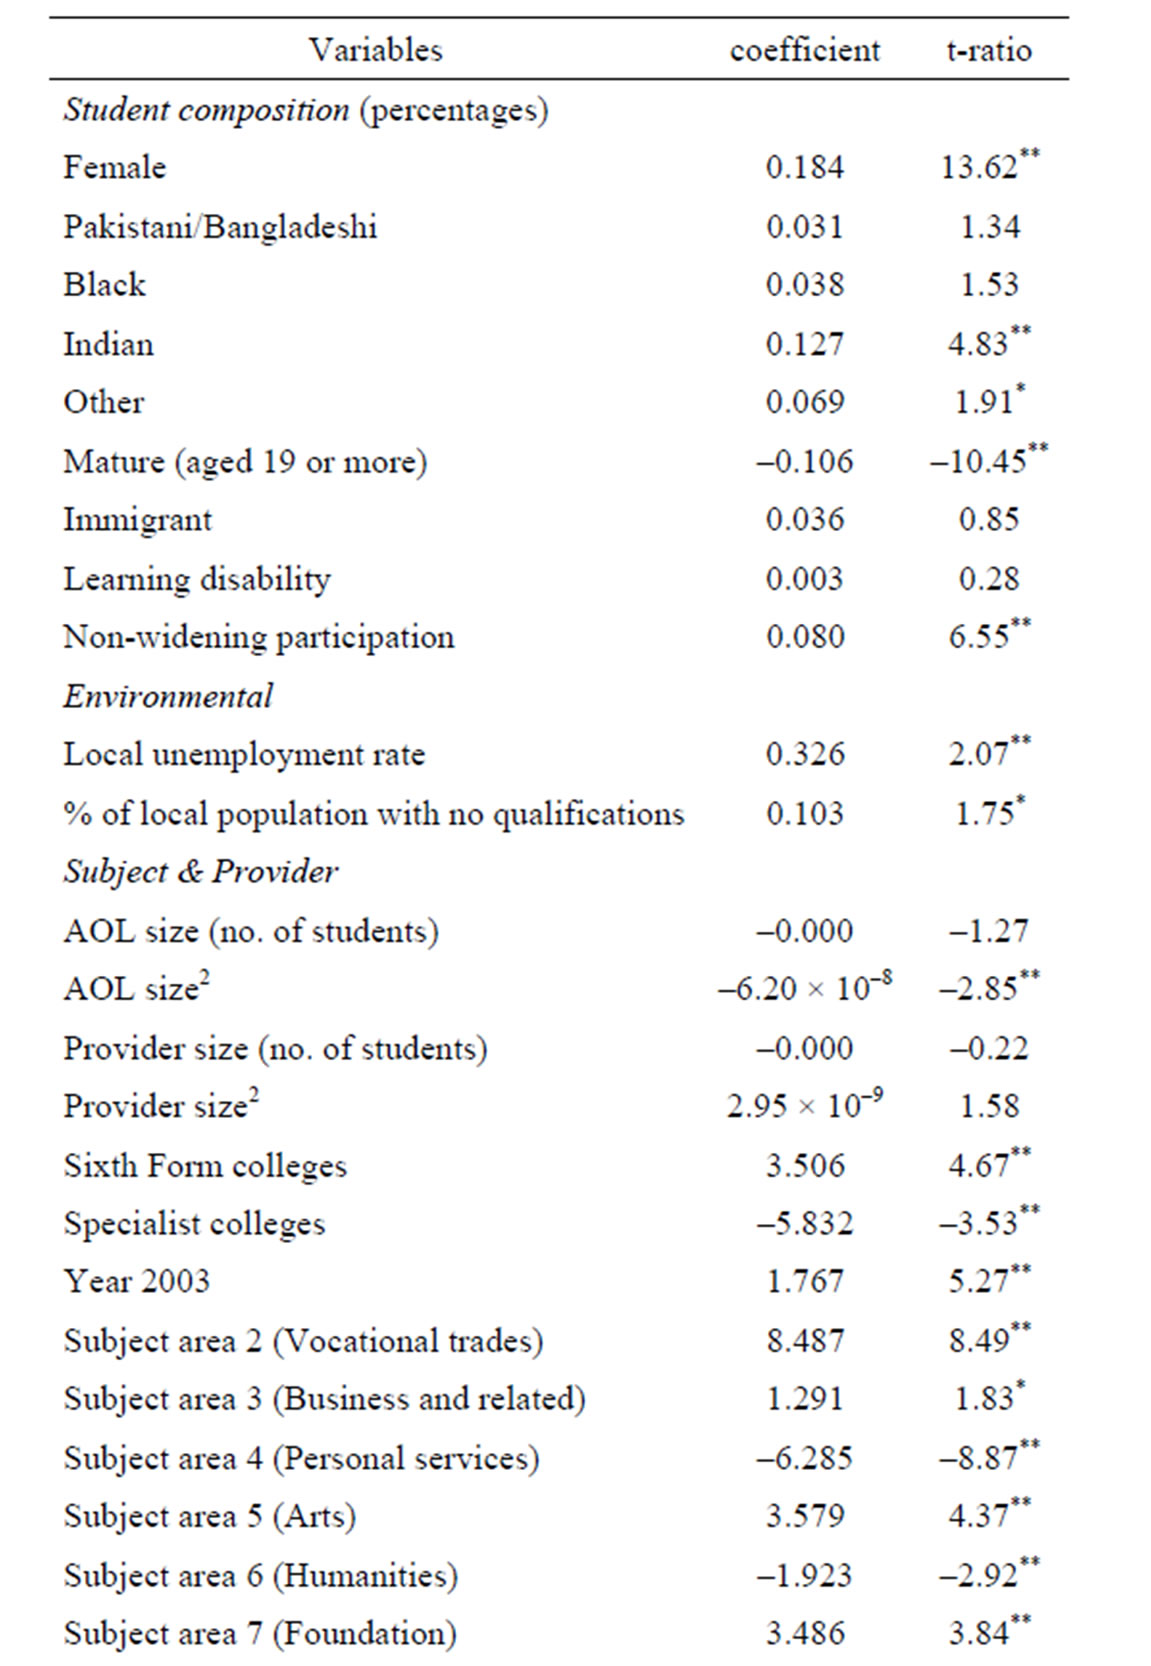
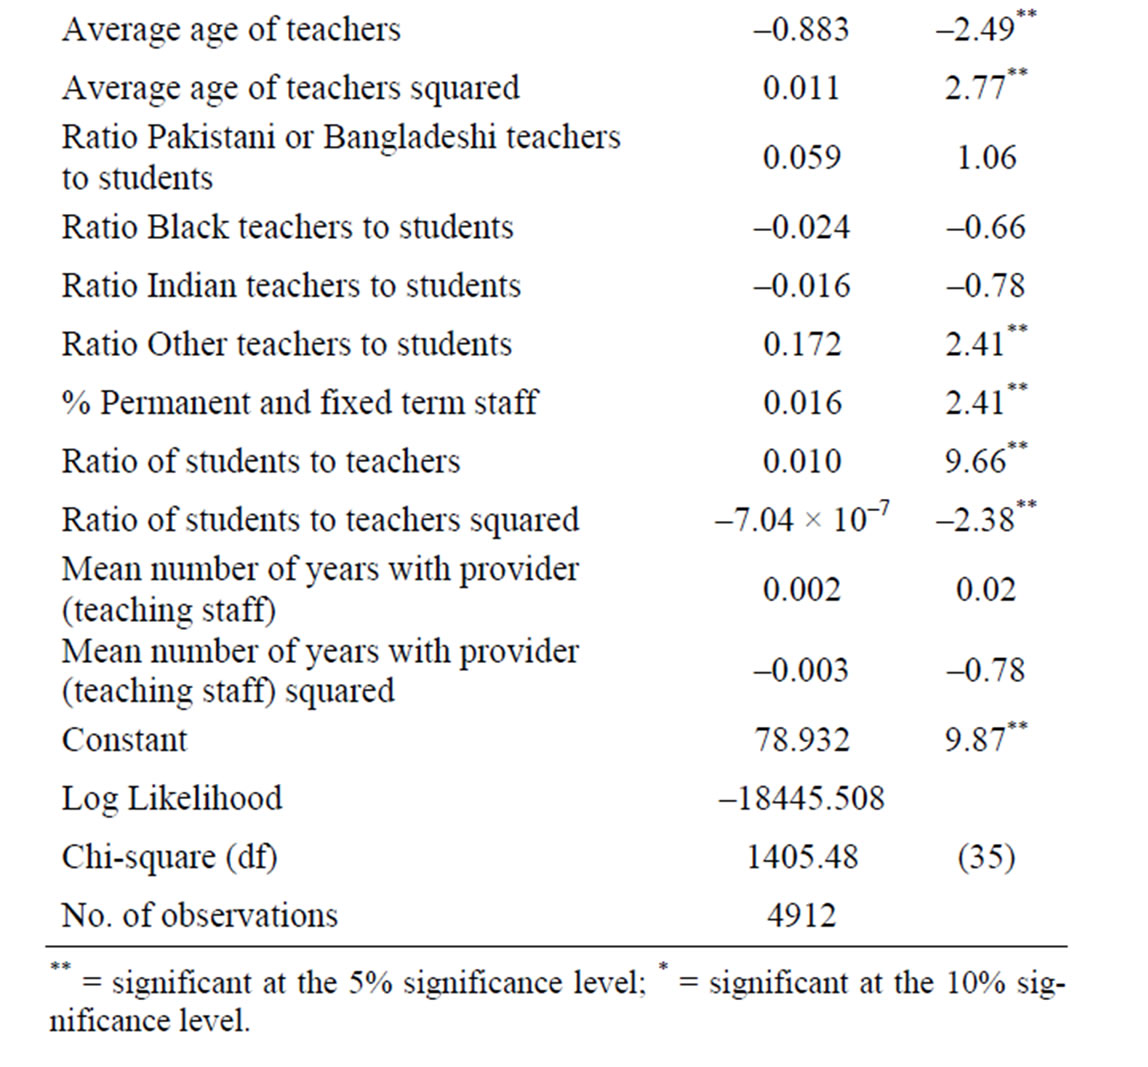
Table 5. The determinants of overall (CRS) technical efficiency: pooled tobit modela.
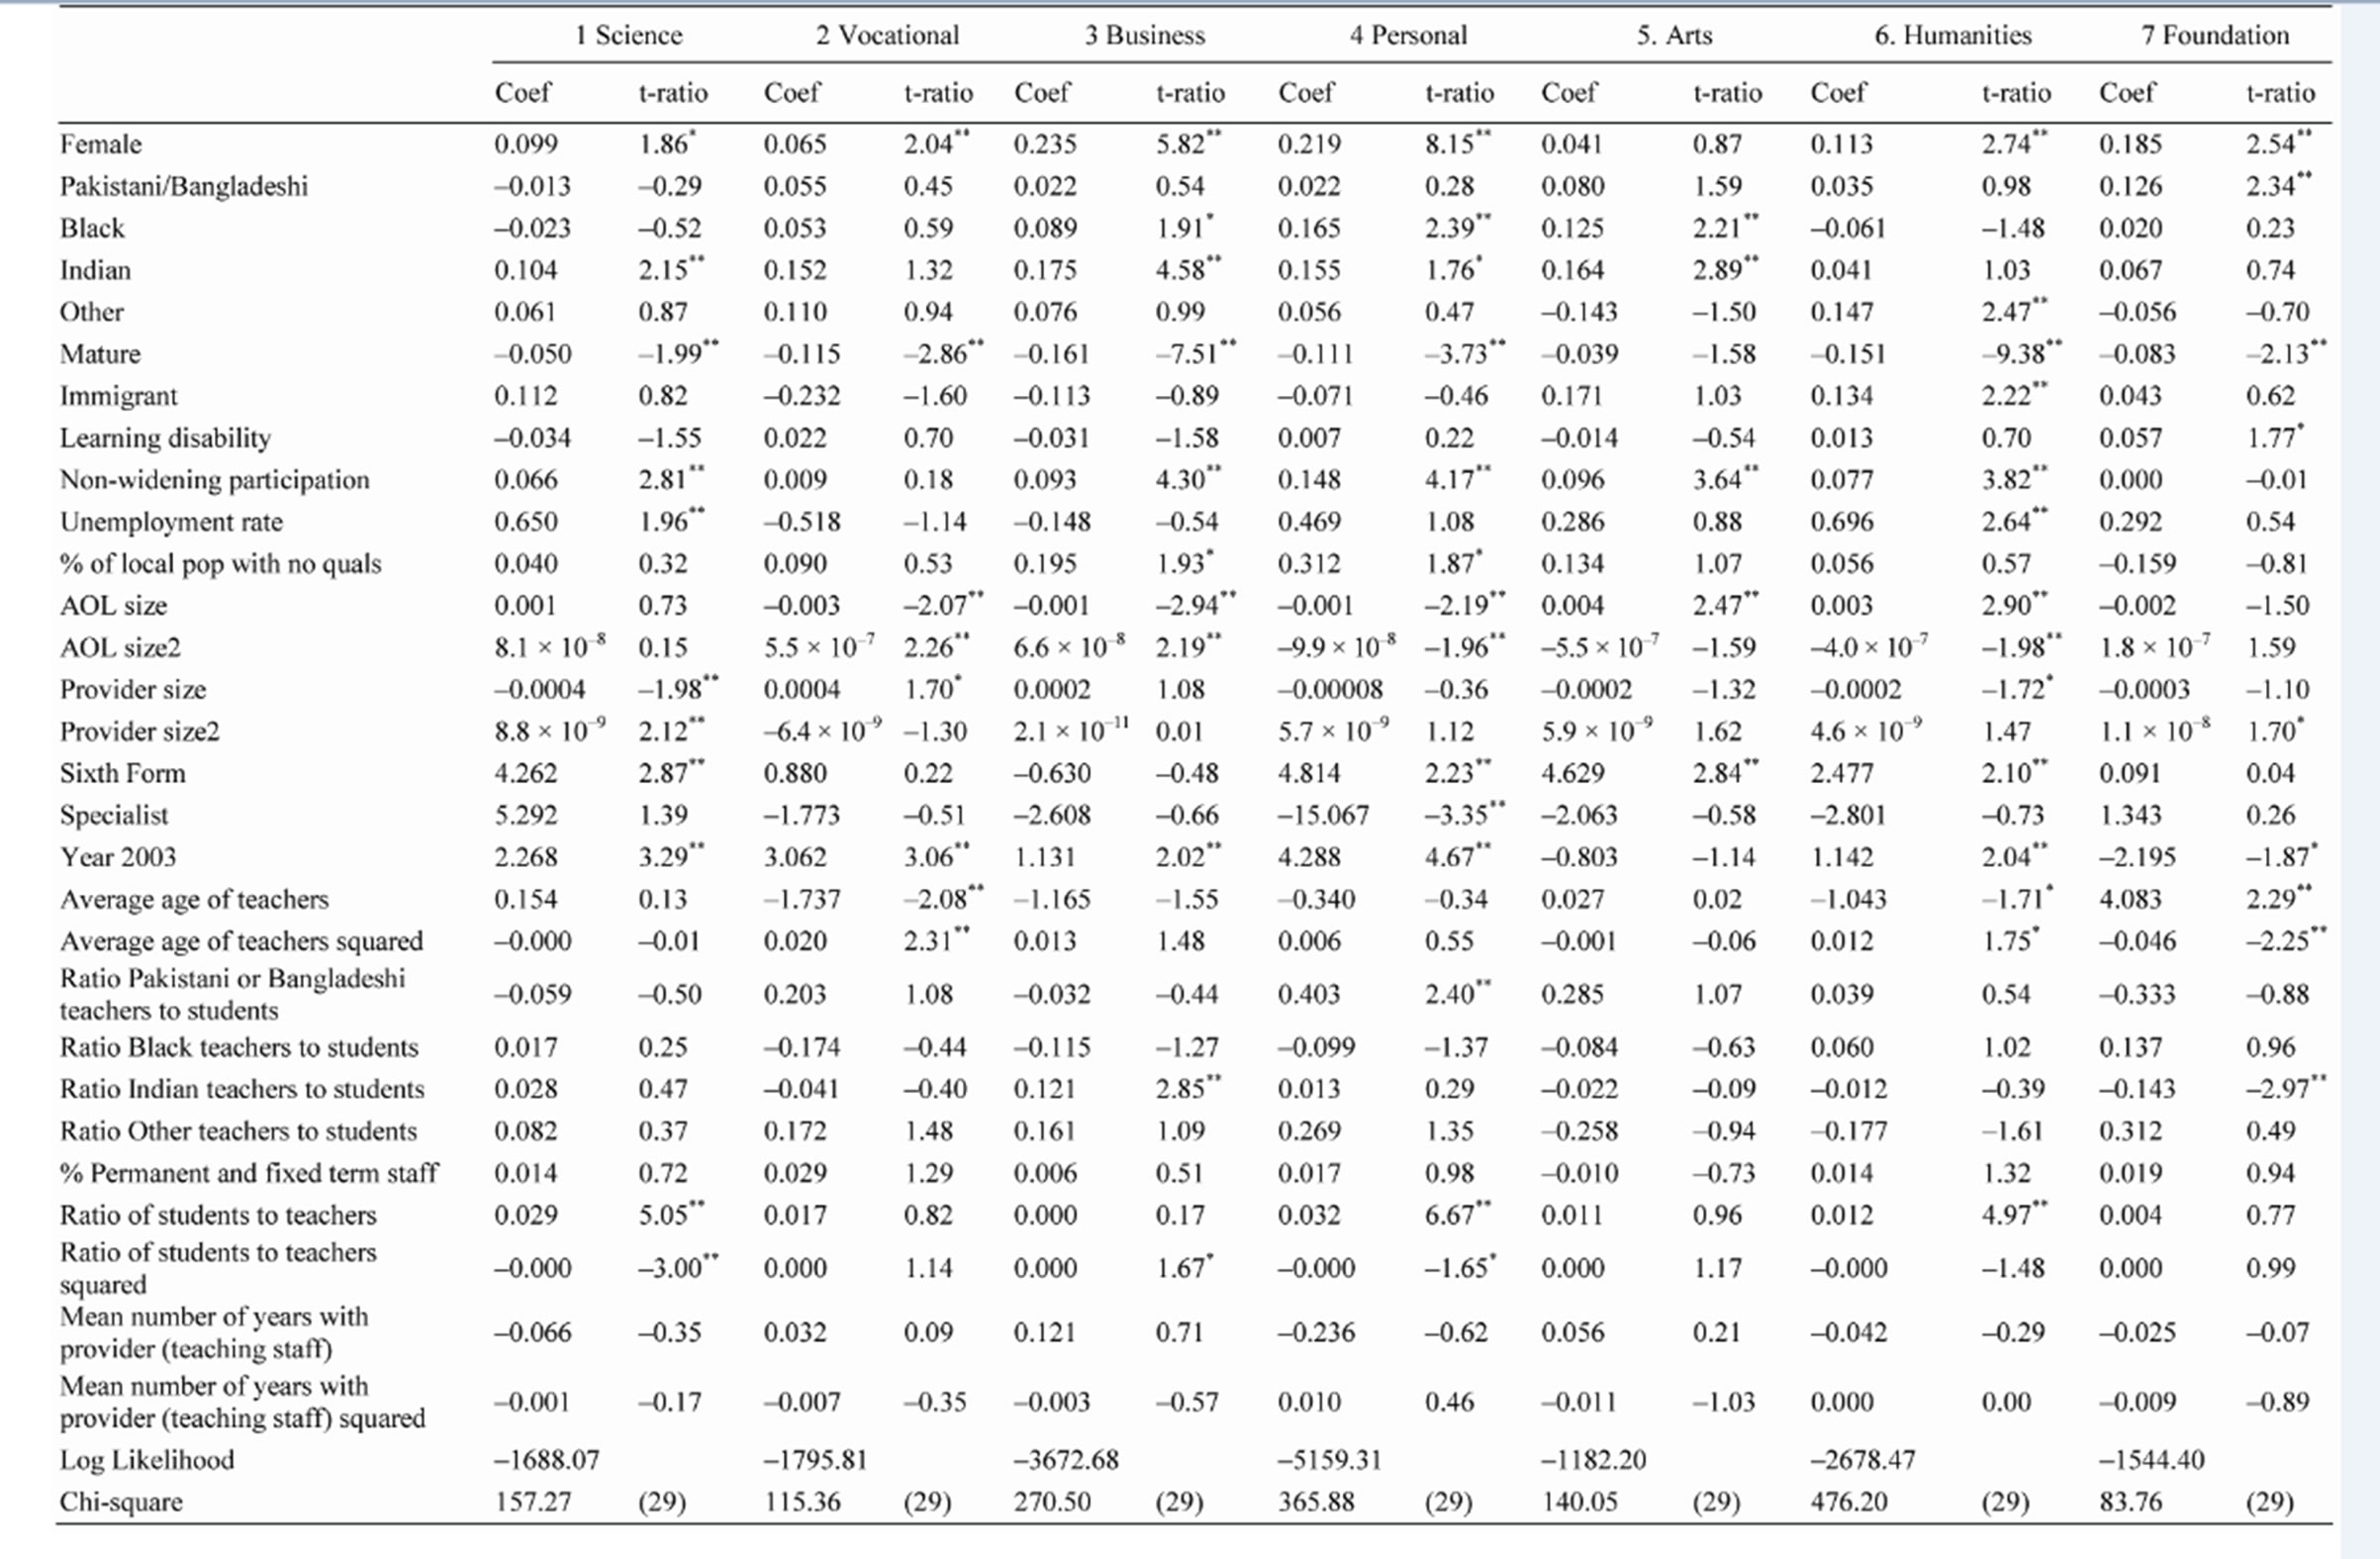
Table 6. The determinants of subject-level technical efficiency (CRS)a.
of success to which inter-institutional variations in efficiency can be explained by student-, staffand institutionrelated variables differs greatly by subject area. The chisquared statistic (with 29 degrees of freedom) varies from 84 in “Foundation” programmes to 476 in “Humanities”, suggesting greater success in explaining efficiency scores in the latter compared to the former.
Student-related characteristics are generally important explanatory variables, but their magnitude and statistical significance varies considerably by subject area. A higher percentage of female students has a statistically significant positive effect on overall efficiency in all but 2 broad subject areas, namely, “Science” and the “Arts”. The largest effects are observed for the “Business & related” and “Personal service” subjects, where a 10 percentage point increase in the percentage of females in the subject increases technical efficiency by 2.4 and 2.2 percentage points, respectively. The effect of the ethnic minority variables also differ by broad subject area. Many of the estimates for the Pakistani/Bangladeshi and Other ethnic groups are statistically insignificant, whereas there are some interesting findings with respect to the percentage of Black and Indian students. In the case of “Personal services”, the “Arts” and to a lesser extent “Business & related” subjects the effect of a higher percentage of Black students on technical efficiency is positive; in the “Humanities” area, however, the effect on technical efficiency is negative but borderline significant. A higher percentage of Indian students raises efficiency in all subjects but is statistically significant in only half the broad subject areas. It is likely that these results reflect differences in the prior attainment of students from each ethnic group with Indians typically ranked highest followed by Black and Pakistani/Bangladeshi students.
The percentage of mature students has a significantly negative effect on efficiency in many of the subject areas, except for the “Arts”. This effect is particularly large (β is approximately –0.15) in “Business & related” and “Humanities” subject areas. The family background of students is also important insofar as a higher percentage of students from “wealthier” backgrounds, reflected by the non-widening participation variable, the higher the technical efficiency of the subject area. This is particularly the case in “Business & related” and “Personal service” subject areas. In contrast, environmental factors, such as the unemployment rate are generally statistically insignificant in explaining efficiency within broad subject areas, the exception being the “Humanities” and “Science” subjects where it has a large positive effect.
The size of the AOL varies in the direction of its effect on technical efficiency. Size has a negative effect on efficiency in “Vocational trades”, “Business & related” and “Personal services”, but a positive effect in the “Arts” and “Humanities” programmes. The significance of the square of AOL size in the case of the last two suggests that the optimum size of AOL within these 2 broad subject areas is around 3500 in each case. This is around 2 to 3 times larger than their current average size. The evidence regarding the effect of provider size on efficiency is limited. Provider size is significantly negatively related to efficiency in “Science”. The optimal provider size for this subject area is estimated to be 21,800, which is almost twice the current average size.
Sixth Form colleges perform significantly better than General/Tertiary FE colleges in 4 subjects—“Science”, “Personal services”, the “Arts” and “Humanities” subject areas. In these cases technical efficiency is between 2 and 5 percentage points higher in Sixth Form colleges compared to General/Tertiary FE colleges. Specialist colleges have lower technical scores in “Personal service” subjects, by around 15 percentage points when compared with General/Tertiary FE colleges.
Teaching-related variables play a much smaller role in explaining efficiency levels within each subject area. Indeed, in the “Arts”, no teaching-related variables are statistically significant. In contrast, the student-teacher ratio is positively related to efficiency in 3 broad subject areas: “Science”, “Personal services” and “Humanities” The average age of teachers has a negative and statisticcally significant effect in “Vocational trades”, and to a lesser extent the “Humanities” subjects. The significance of the squared terms suggests that efficiency starts to rise with teacher age in these subject areas after an age of 43 to 44 years. In contrast, teacher age has a significantly positive effect in “Foundation” programmes up to an age of 44 years, after which efficiency falls with age. Surprisingly, teacher experience has no significant effect on efficiency in any subject area. Possible interactions between teacher age and experience are investigated by dropping the age variables, but experience remains insignificant.
5. Conclusions
Previous research in the context of English FE concluded that FE providers need to implement strategies for improving achievement and retention amongst the most at-risk students, namely white males [3]. This previous study took no account of differences between subjects, yet there is some evidence in the context of higher education that the determinants of achievement and retention vary by subject of study [5,6]. The effectiveness of strategies devised to increase the efficiency with which FE colleges provide education is likely to be improved, therefore, by investigating whether there are also differences between subjects in the efficiency of FE colleges. To this end, we calculated, using DEA, the overall technical efficiency scores across 14 AOLs in the English FE sector using data for 2002 and 2003 obtained from the LSC. The main finding from the DEA is that there are differences in performance by AOL: the mean overall technical efficiency score varied from 75% in “Health, social care & public services” to 86% in “Visual and performing arts and media”.
A second stage analysis of the DEA efficiency scores pooled across subjects reveals further results which should be of interest to policy-makers and managers in the FE sector. First student-related characteristics, such as gender, age, ethnic origin and socio-economic status, are more important than either teacher-related or environmental variables in explaining the level of efficiency. Second, even taking into account variables relating to students, teachers and the school environment, there remain significant differences in efficiency between broad subject areas.
Finally, once the sample is split according to subject and the analysis is repeated, it becomes apparent that the precise effects of student-, teacherand institution-related variables vary by subject. While many of the factors found to be significant in explaining efficiencies by subject are not amenable to alteration by managers, the results should nevertheless be of interest to both managers and policy-makers. First, in judging the efficiency of individual providers, allowance should be made for subject mix, and student and staff characteristics. Second, strategies for improving efficiency should be developed at the micro (subject) rather than the macro (provider) level, since the variables which are important in explaining efficiency vary significantly by subject. Thus, concentrating on improving achievement and retention amongst white males (the strategy implied by the results of analysis at the provider level) may have little effect on improving efficiency in, for example, “Arts” or, to a lesser extent, “Science” where student gender appears to have little effect on performance, or in “Vocational trades” where ethnic background has no effect on efficiency. FE managers therefore need to look at each subject area separately and decide on policies which will improve efficiency in that specific subject. Finally, the existence of differences in efficiency between types of FE provider at the subject level suggests that it is vital that further investigation should be undertaken to establish the specific characteristics of each type of college which contribute to increased efficiency.
6. Acknowledgements
We would like to thank the Centre for Excellence in Leadership, Lancaster University Management School, for funding this research, and the LSC for providing the data. The usual disclaimer applies
REFERENCES
- Foster Report, “Realising the Potential: A Review of the Future Role of Further Education Colleges,” Department for Education and Science, London, 2005.
- Department for Education and Science, “Further Education: Raising Skills, Improving Life Chances,” White Paper, London, 2006.
- S. Bradley, J. Johnes and A. Little, “The Measurement and Determinants of Efficiency and Productivity in the Further Education Sector in England,” Bulletin of Economic Research, Vol. 62, No. 1, 2010, pp. 1-30. doi:10.1111/j.1467-8586.2009.00309.x
- M. Yang, H. Goldstien, W. Browne and G. Woodhouse, “Multivariate Multilevel Analyses of Examination Results,” Journal of the Royal Statistical Society A, Vol. 165, No. 1, 2002, pp. 137-153. doi:10.1111/1467-985X.00633
- J. Johnes, “Inter-University Variations in Undergraduate Non-Completion Rates: A Statistical Analysis by Subject of Study,” Journal of Applied Statistics, Vol. 24, No. 3, 1997, pp. 343-361. doi:10.1080/02664769723738
- J. Johnes, “Measuring Efficiency: A Comparison of Multilevel Modelling and DEA in the Context of Higher Education,” Bulletin of Economic Research, Vol. 58, No. 2, 2006, pp. 75-104. doi:10.1111/j.0307-3378.2006.00238.x
- R. W. Shephard, “Theory of Cost and Production Frontiers,” Princeton University Press, Princeton, 1970.
- R. Färe, “Fundamentals of Production Theory,” SpringerVerlag, Berlin, 1988.
- A. Charnes, W. W. Cooper and E. Rhodes, “Measuring the Efficiency of DMUs,” European Journal of Operational Research, Vol. 2, No. 2, 1978, pp. 429-444. doi:10.1016/0377-2217(78)90138-8
- A. Charnes, W. W. Cooper and E. Rhodes, “Measuring the Efficiency of Decision Making Units: A Short Communication,” European Journal of Operational Research, Vol. 3, No. 4, 1979, p. 339. doi:10.1016/0377-2217(79)90229-7
- T. J. Coelli, D. S. P. Rao, C. J. O’Donnell and G. E. Battese, “An Introduction to Efficiency and Productivity Analysis,” Springer, New York, 2005.
- S. C. Ray, “Resource Use Efficiency in Public Schools: A Study of Connecticut Data,” Management Science, Vol. 37, No. 12, 1991, pp. 1620-1628. doi:10.1287/mnsc.37.12.1620
- S. Grosskopf and C. Moutray, “Evaluating Performance in Chicago Public High Schools in the Wake of Decentralization,” Economics of Education Review, Vol. 20, No. 1, 2001, pp. 1-14. doi:10.1016/S0272-7757(99)00065-5
- S. Bradley, G. Johnes and J. Millington, “The Effect of Competition on the Efficiency of Secondary Schools in England,” European Journal of Operational Research, Vol. 135, No. 2, 2001, pp. 545-568. doi:10.1007/s00148-006-0110-y
- M. Andrews, S. Bradley, D. Stott and J. Taylor, “The Evolution and Determinants of the Educational Gender Gap in England,” 2001. http://www.lancs.ac.uk/staff/ecasb/papers/ggap1-revised.pdf
- S. Bradley and P. Lenton, “Dropping out of Postcompulsory Education in the UK: An Analysis of Determinants and Outcomes,” Journal of Population Economics, Vol. 20, No. 2, 2007, pp. 299-328. doi:10.1007/s00148-006- 0110-y
- S. May, P. Bidgood and N. Saebi, “Are They Thinking What We’re Thinking? College Staff and Student Perceptions of the Impact of Ethnicity and Gender on Completion and Achievement at a College of Further Education,” Journal of Further and Higher Education, Vol. 30, No. 3, 2006, pp. 243-254. doi:10.1080/03098770600802271
- S. Bradley and J. Taylor, “Ethnicity, Educational Attainment and the Transition from School,” The Manchester School, Vol. 72, No. 3, 2004, pp. 317-346. doi:10.1111/j.1467-9957.2004.00395.x
- C. Schofield and H. Dismore, “Predictors of Retention and Achievement of Higher Education Students within a Further Education Context,” Journal of Further and Higher Education, Vol. 34, No. 2, 2010, pp. 207-221. doi:10.1080/03098771003695478
- T. S. Dee, “A Teacher Like Me: Does Race, Ethnicity, or Gender Matter?” American Economic Review, Vol. 95, No. 2, 2005, pp. 158-165. doi:10.1257/000282805774670446
- D. Wilson, S. Burgess and A. Briggs, “The Dynamics of School Attainment of England’s Ethnic Minorities 2005. http://www.bristol.ac.uk/cmpo/publications/papers/2005/wp130.pdf
- E. A. Hanushek, “The Evidence on Class Size,” 1998. http://edpro.stanford.edu/hanushek/admin/pages/files/uploads/testmony.PDF
NOTES
1Note that each module (within a study programme) for which the student has signed up is considered an aimed-for qualification.
2There is evidence based on one college that some males stay on at college until they find a job. Despite adding to the non-completion rate, they have in fact been “successful” [17].

