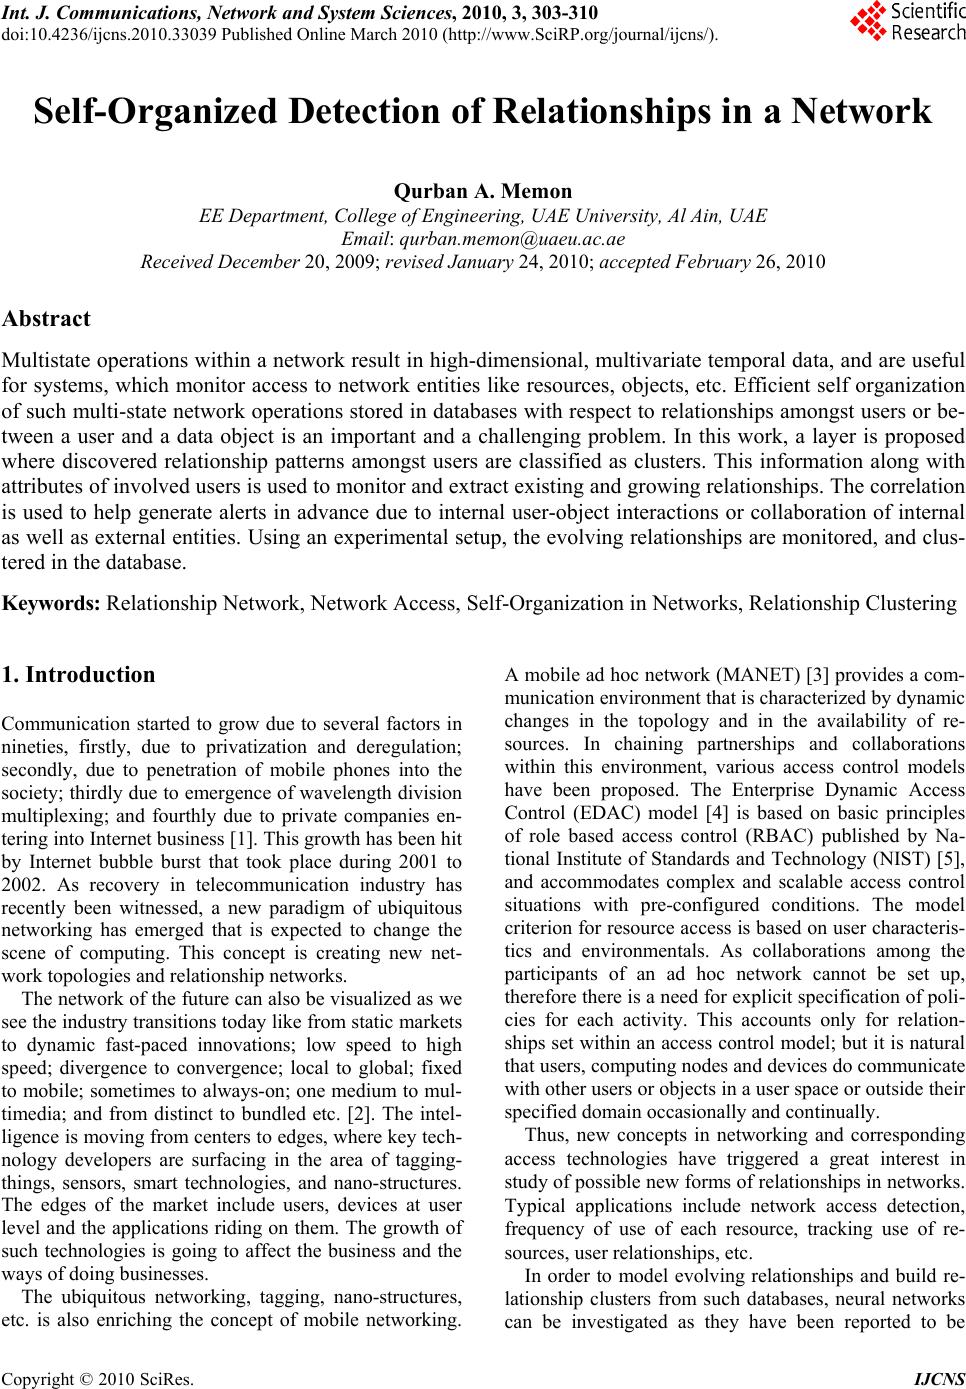
 Int. J. Communications, Network and System Sciences, 2010, 3, 303-310 doi:10.4236/ijcns.2010.33039 blished Online March 2010 (http://www.SciRP.org/journal/ijcns/). Copyright © 2010 SciRes. IJCNS Pu Self-Organized Detection of Relationships in a Network Qurban A. Memon EE Department, College of Engineering, UAE University, Al Ain, UAE Email: qurban.memon@uaeu.ac.ae Received December 20, 2009; revised January 24, 2010; accepte d F ebruary 26, 2010 Abstract Multistate operations within a network result in high-dimensional, multivariate temporal data, and are useful for systems, which monitor access to network entities like resources, objects, etc. Efficient self organization of such multi-state network operations stored in databases with respect to relationships amongst users or be- tween a user and a data object is an important and a challenging problem. In this work, a layer is proposed where discovered relationship patterns amongst users are classified as clusters. This information along with attributes of involved users is used to monitor and extract existing and growing relationships. The correlation is used to help generate alerts in advance due to internal user-object interactions or collaboration of internal as well as external entities. Using an experimental setup, the evolving relationships are monitored, and clus- tered in the database. Keywords: Relationship Network, Network Access, Self-Organization in Networks, Relationship Clustering 1. Introduction Communication started to grow due to several factors in nineties, firstly, due to privatization and deregulation; secondly, due to penetration of mobile phones into the society; thirdly due to emergence of wavelength division multiplexing; and fourthly due to private companies en- tering into Internet business [1]. This growth has been hit by Internet bubble burst that took place during 2001 to 2002. As recovery in telecommunication industry has recently been witnessed, a new paradigm of ubiquitous networking has emerged that is expected to change the scene of computing. This concept is creating new net- work topologies and relationship networks. The network of the future can also be visualized as we see the industry transitions today like from static markets to dynamic fast-paced innovations; low speed to high speed; divergence to convergence; local to global; fixed to mobile; sometimes to always-on; one medium to mul- timedia; and from distinct to bundled etc. [2]. The intel- ligence is moving from centers to edges, where key tech- nology developers are surfacing in the area of tagging- things, sensors, smart technologies, and nano-structures. The edges of the market include users, devices at user level and the applications riding on them. The growth of such technologies is going to affect the business and the ways of doing businesses. The ubiquitous networking, tagging, nano-structures, etc. is also enriching the concept of mobile networking. A mobile ad hoc network (MANET) [3] provides a com- munication environment that is characterized by dynamic changes in the topology and in the availability of re- sources. In chaining partnerships and collaborations within this environment, various access control models have been proposed. The Enterprise Dynamic Access Control (EDAC) model [4] is based on basic principles of role based access control (RBAC) published by Na- tional Institute of Standards and Technology (NIST) [5], and accommodates complex and scalable access control situations with pre-configured conditions. The model criterion for resource access is based on user characteris- tics and environmentals. As collaborations among the participants of an ad hoc network cannot be set up, therefore there is a need for explicit specification of poli- cies for each activity. This accounts only for relation- ships set within an access control model; but it is natural that users, computing nodes and devices do communicate with other users or objects in a user space or outside their specified domain occasionally and continually. Thus, new concepts in networking and corresponding access technologies have triggered a great interest in study of possible new forms of relationships in networks. Typical applications include network access detection, frequency of use of each resource, tracking use of re- sources, user relationships, etc. In order to model evolving relationships and build re- lationship clusters from such databases, neural networks can be investigated as they have been reported to be 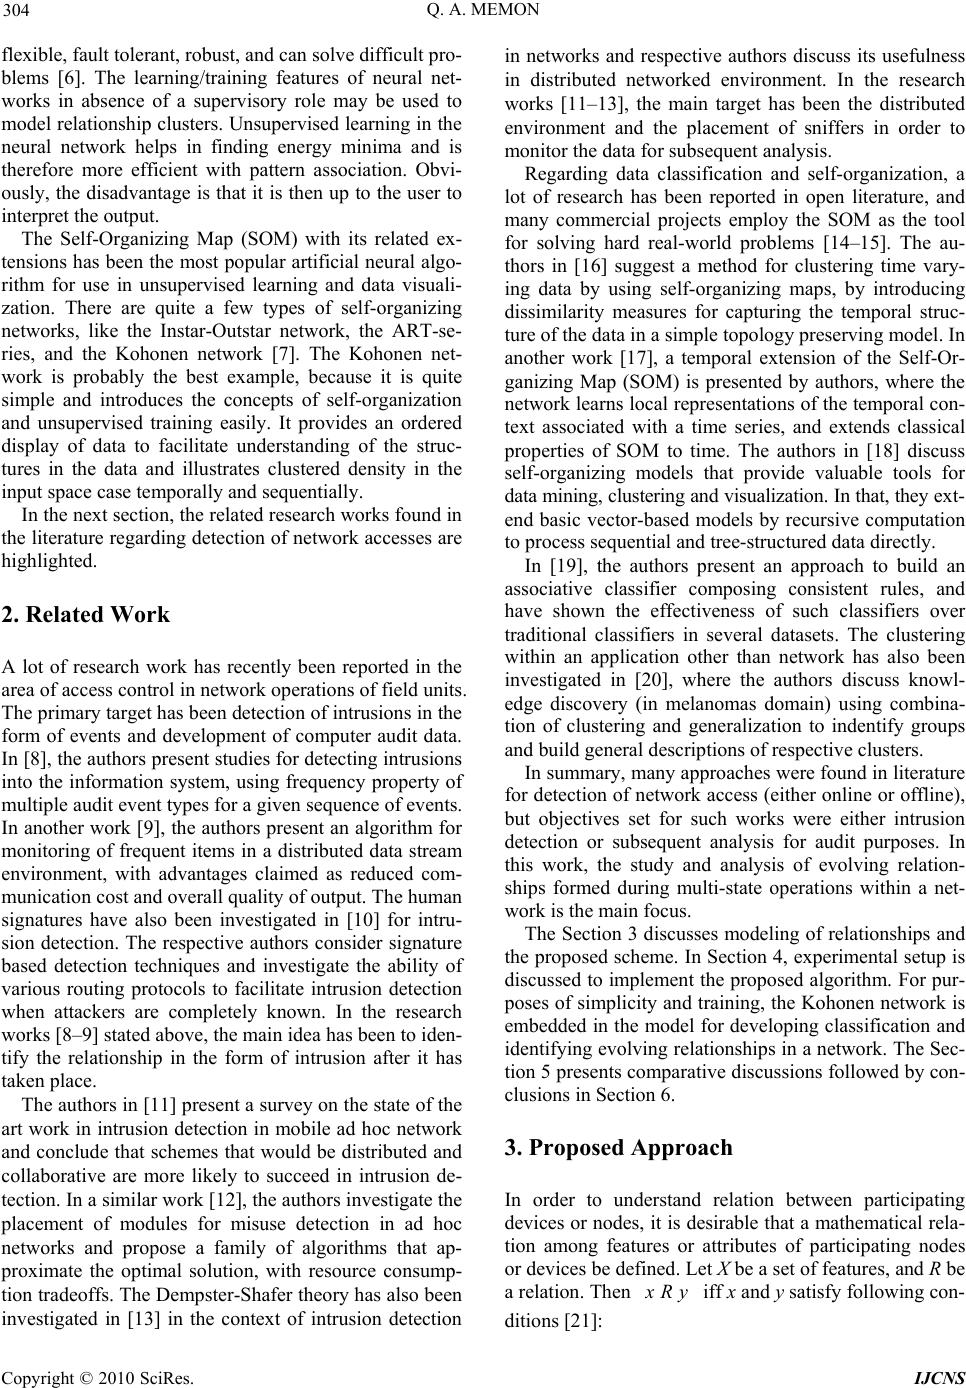 Q. A. MEMON 304 flexible, fault tolerant, robust, and can solve difficult pro- blems [6]. The learning/training features of neural net- works in absence of a supervisory role may be used to model relationship clusters. Unsupervised learning in the neural network helps in finding energy minima and is therefore more efficient with pattern association. Obvi- ously, the disadvantage is that it is then up to the user to interpret the output. The Self-Organizing Map (SOM) with its related ex- tensions has been the most popular artificial neural algo- rithm for use in unsupervised learning and data visuali- zation. There are quite a few types of self-organizing networks, like the Instar-Outstar network, the ART-se- ries, and the Kohonen network [7]. The Kohonen net- work is probably the best example, because it is quite simple and introduces the concepts of self-organization and unsupervised training easily. It provides an ordered display of data to facilitate understanding of the struc- tures in the data and illustrates clustered density in the input space case temporally and sequentially. In the next section, the related research works found in the literature regarding detection of network accesses are highlighted. 2. Related Work A lot of research work has recently been reported in the area of access control in network operations of field units. The primary target has been detection of intrusions in the form of events and development of computer audit data. In [8], the authors present studies for detecting intrusions into the information system, using frequency property of multiple audit event types for a given sequence of events. In another work [9], the authors present an algorithm for monitoring of frequent items in a distributed data stream environment, with advantages claimed as reduced com- munication cost and overall quality of output. The human signatures have also been investigated in [10] for intru- sion detection. The respective authors consider signature based detection techniques and investigate the ability of various routing protocols to facilitate intrusion detection when attackers are completely known. In the research works [8–9] stated above, the main idea has been to iden- tify the relationship in the form of intrusion after it has taken place. The authors in [11] present a survey on the state of the art work in intrusion detection in mobile ad hoc network and conclude that schemes that would be distributed and collaborative are more likely to succeed in intrusion de- tection. In a similar work [12], the authors investigate the placement of modules for misuse detection in ad hoc networks and propose a family of algorithms that ap- proximate the optimal solution, with resource consump- tion tradeoffs. The Dempster-Shafer theory has also been investigated in [13] in the context of intrusion detection in networks and respective authors discuss its usefulness in distributed networked environment. In the research works [11–13], the main target has been the distributed environment and the placement of sniffers in order to monitor the data for subsequent analysis. Regarding data classification and self-organization, a lot of research has been reported in open literature, and many commercial projects employ the SOM as the tool for solving hard real-world problems [14–15]. The au- thors in [16] suggest a method for clustering time vary- ing data by using self-organizing maps, by introducing dissimilarity measures for capturing the temporal struc- ture of the data in a simple topology preserving model. In another work [17], a temporal extension of the Self-Or- ganizing Map (SOM) is presented by authors, where the network learns local representations of the temporal con- text associated with a time series, and extends classical properties of SOM to time. The authors in [18] discuss self-organizing models that provide valuable tools for data mining, clustering and visualization. In that, they ext- end basic vector-based models by recursive computation to process sequential and tree-structured data directly. In [19], the authors present an approach to build an associative classifier composing consistent rules, and have shown the effectiveness of such classifiers over traditional classifiers in several datasets. The clustering within an application other than network has also been investigated in [20], where the authors discuss knowl- edge discovery (in melanomas domain) using combina- tion of clustering and generalization to indentify groups and build general descriptions of respective clusters. In summary, many approaches were found in literature for detection of network access (either online or offline), but objectives set for such works were either intrusion detection or subsequent analysis for audit purposes. In this work, the study and analysis of evolving relation- ships formed during multi-state operations within a net- work is the main focus. The Section 3 discusses modeling of relationships and the proposed scheme. In Section 4, experimental setup is discussed to implement the proposed algorithm. For pur- poses of simplicity and training, the Kohonen network is embedded in the model for developing classification and identifying evolving relationships in a network. The Sec- tion 5 presents comparative discussions followed by con- clusions in Section 6. 3. Proposed Approach In order to understand relation between participating devices or nodes, it is desirable that a mathematical rela- tion among features or attributes of participating nodes or devices be defined. Let X be a set of features, and R be a relation. Then Ry iff x and y satisfy following con- ditions [21]: Copyright © 2010 SciRes. IJCNS 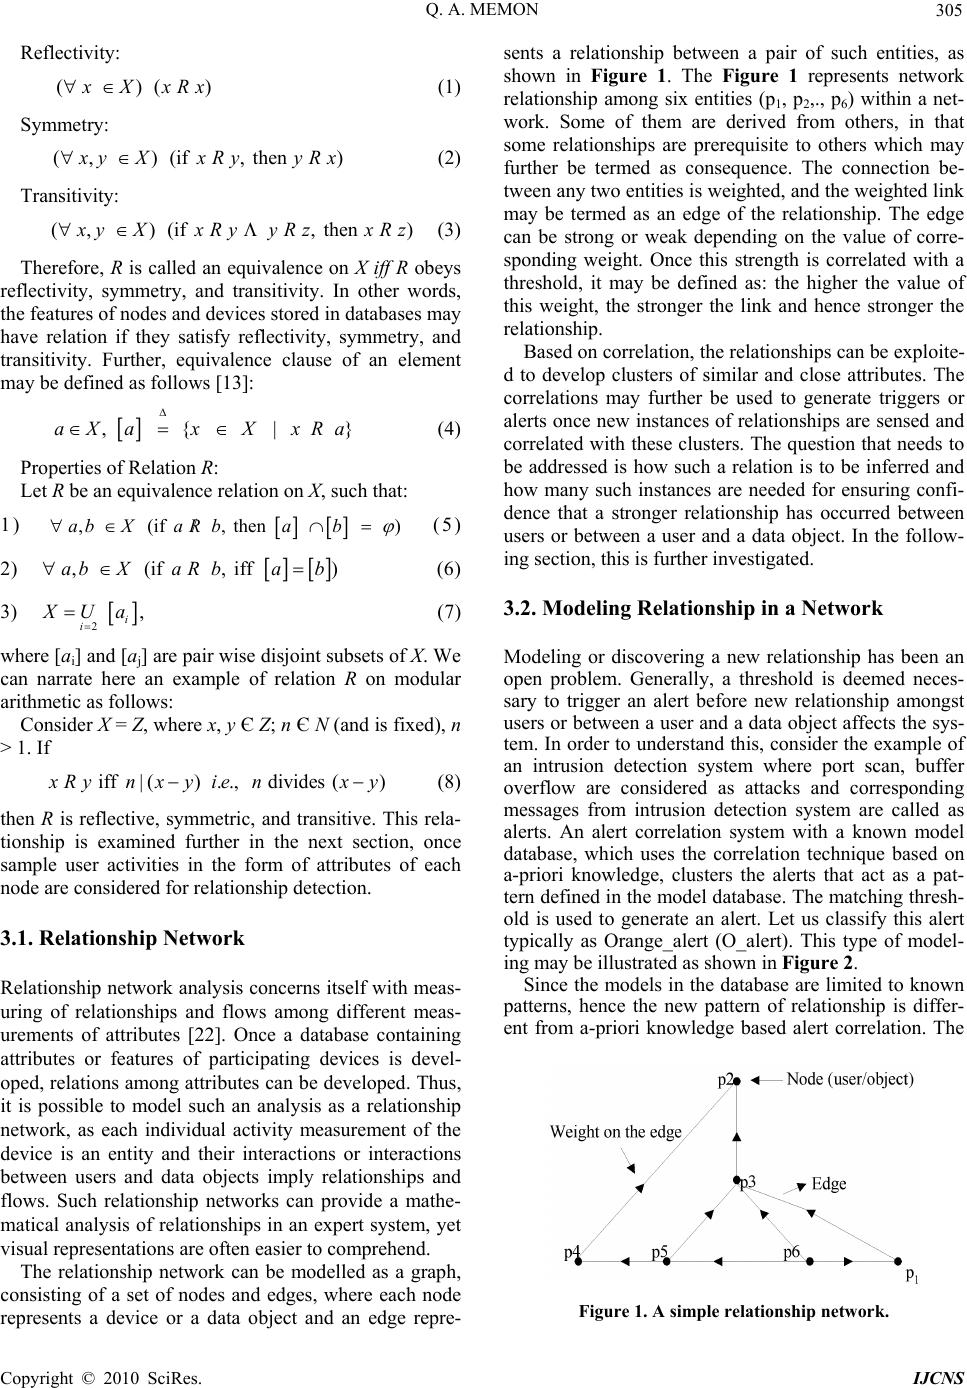 Q. A. MEMON 305 Reflectivity: ( ) ( ) XxRx (1) Symmetry: ( , ) (if , then ) yX xRyyRx (2) Transitivity: ( , ) (if , then ) y XxRyyRzxRz (3) Therefore, R is called an equivalence on X iff R obeys reflectivity, symmetry, and transitivity. In other words, the features of nodes and devices stored in databases may have relation if they satisfy reflectivity, symmetry, and transitivity. Further, equivalence clause of an element may be defined as follows [13]: , { | }aX axXxRa (4) Properties of Relation R: Let R be an equivalence relation on X, such that: 1) , (if , then )abXaR bab (5) 2) , (if , iff )abXaR bab (6) 3) 2 i i, Ua (7) where [ai] and [aj] are pair wise disjoint subsets of X. We can narrate here an example of relation R on modular arithmetic as follows: Consider X = Z, where x, y Є Z; n Є N (and is fixed), n > 1. If iff |() .., divides () Rynx yienx y (8) then R is reflective, symmetric, and transitive. This rela- tionship is examined further in the next section, once sample user activities in the form of attributes of each node are considered for relationship detection. 3.1. Relationship Network Relationship network analysis concerns itself with meas- uring of relationships and flows among different meas- urements of attributes [22]. Once a database containing attributes or features of participating devices is devel- oped, relations among attributes can be developed. Thus, it is possible to model such an analysis as a relationship network, as each individual activity measurement of the device is an entity and their interactions or interactions between users and data objects imply relationships and flows. Such relationship networks can provide a mathe- matical analysis of relationships in an expert system, yet visual representations are often easier to comprehend. The relationship network can be modelled as a graph, consisting of a set of nodes and edges, where each node represents a device or a data object and an edge repre- sents a relationship between a pair of such entities, as shown in Figure 1. The Figure 1 represents network relationship among six entities (p1, p2,., p6) within a net- work. Some of them are derived from others, in that some relationships are prerequisite to others which may further be termed as consequence. The connection be- tween any two entities is weighted, and the weighted link may be termed as an edge of the relationship. The edge can be strong or weak depending on the value of corre- sponding weight. Once this strength is correlated with a threshold, it may be defined as: the higher the value of this weight, the stronger the link and hence stronger the relationship. Based on correlation, the relationships can be exploite- d to develop clusters of similar and close attributes. The correlations may further be used to generate triggers or alerts once new instances of relationships are sensed and correlated with these clusters. The question that needs to be addressed is how such a relation is to be inferred and how many such instances are needed for ensuring confi- dence that a stronger relationship has occurred between users or between a user and a data object. In the follow- ing section, this is further investigated. 3.2. Modeling Relationship in a Network Modeling or discovering a new relationship has been an open problem. Generally, a threshold is deemed neces- sary to trigger an alert before new relationship amongst users or between a user and a data object affects the sys- tem. In order to understand this, consider the example of an intrusion detection system where port scan, buffer overflow are considered as attacks and corresponding messages from intrusion detection system are called as alerts. An alert correlation system with a known model database, which uses the correlation technique based on a-priori knowledge, clusters the alerts that act as a pat- tern defined in the model database. The matching thresh- old is used to generate an alert. Let us classify this alert typically as Orange_alert (O_alert). This type of model- ing may be illustrated as shown in Figure 2. Since the models in the database are limited to known patterns, hence the new pattern of relationship is differ- ent from a-priori knowledge based alert correlation. The Figure 1. A simple relationship network. C opyright © 2010 SciRes. IJCNS  Q. A. MEMON Copyright © 2010 SciRes. IJCNS 306 Figure 2. Alert correlation based on known patterns. alerts based on discovery of new relationships can help to solve this problem. For this, the strength and rising process of the new relationship may be used to define the threshold for triggering the tolerance mechanism of the Relationship Detection System (RDS). This seems ra- tionale as the rising process of achieving new strengths in relationships on the network increases the vulnerabil- ity of the targeted system. To understand this further, an example of an unau- thorized file access may be phrased as: getting knowl- edge of the service port of the address getting the root access installing the components to access the file get the file. There is a logical relationship be- tween two capability states. For example, if C0 = {src, trgt, sniff, address, content, Anne} and C1 = {src, trgt, sniff, all addresses, content, [Anne, Bill]}, this means C0 can be logically inferred from C1. In order to model this rising process of achieving new strength in relationship, consider a node/device which is trying to access an object in a network. The capability of the developing relationship may be described as a six-tuple, as follows: It can be inferred that every relationship is related to two capability states: one is prerequisite state providing the necessary strength for a new relationship, and the other the consequence state, which includes the new achieved strengths. This, in turn, raises a new concept of an alert which embeds existing alert level, prerequisite state and the consequence state. This new alert may be classified as Yellow alert (Y_Alert), and defined as a three-tuple: {,,,,,} Capabilitysrc trgtactn srvcprprty crdntls (9) where capability describes the initiator (source ~src) of the relationship to perform an action (~actn) on the property (~prprty) of the service (~srvc) with given cre- dentials (~crdntls) on the target (~trgt) destination. In order to illustrate this, a state transition diagram can be used where edges are new relationships and nodes are new capabilities. This is shown in Figure 3, where Co is the initial capability state. After a relationship Ri is formed, a new strength Si is achieved. Looking at Figure 3 as an example, the union of C1, C2 and C3 is the pre-requisite to new relationship R4. After R4 is formed, a new strength is achieved and reaches capability state C4. Thus, a capability state has a prerequisite before a new relationship can be formed. This gives rise to new relationships and capability states. Thus, this may form a chain of relationships, one derived from the preceding one and so on, in a temporal fashion. Y_Alert (YA)=(Alert,Prerequisite,Consequence) (10) where Alert is a four-tuple message from RDS and it carries four information components: name, time, sour c e, target. The name is name of the relationship that triggers this alert, time = (begin, end) of the relationship, source and target are net addresses of the relationship entities; Prerequisite includes prerequisite capability of the alert, and Consequence is the current capability state after alert is finished. To find new relationship patterns, alerts are transformed into Y_Alerts, then correlated into a new relationship incident to uncover logic relations. The Y_Alerts can be listed along with their capabilities states and corresponding timing ranges. This helps in correlat- ing Y_Alerts with Meta-Relationship (R), and thus new relationships can be discovered and ultimately stored in the database. This Meta-relationship triggers another level alert, say Red_Alert (RA), and is defined as a three- tuple: R_Alert ‘RA’ = {set_R, set_C, Time} (11) where set_R is the set of correlated Y_Alert, set_C is the set of the capabilities of all consequences of the Y_alert, Time is begin_time and end_time of these Y_Alerts. Meta relationship R resulting in R_Alert can be easily proved that it is a partial relationship. For this, it can be Figure 3. State transition based on new relationships and strengths. 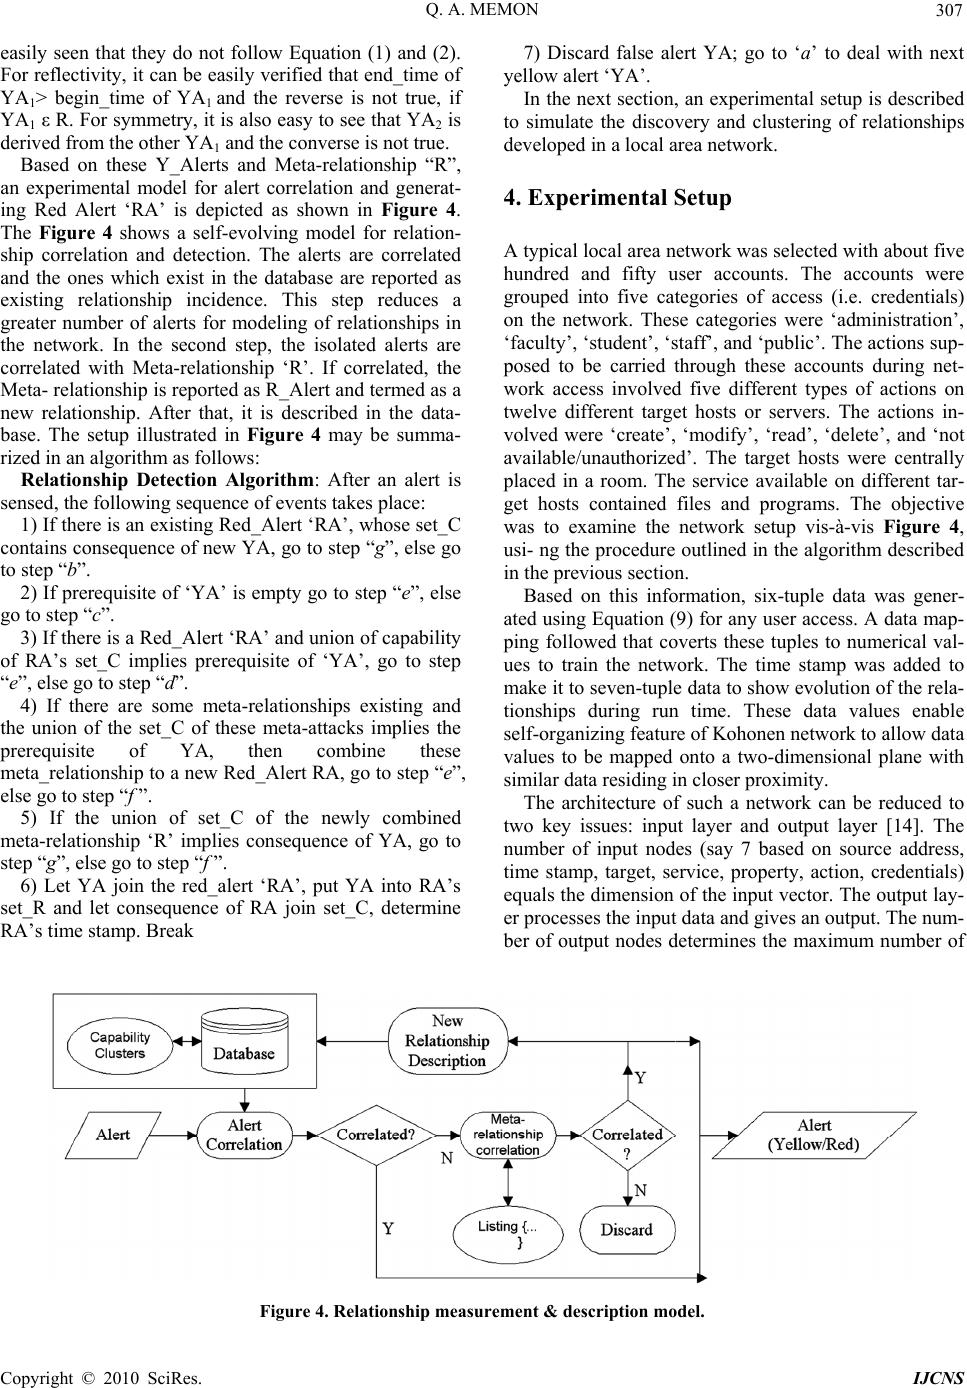 Q. A. MEMON 307 easily seen that they do not follow Equation (1) and (2). For reflectivity, it can be easily verified that end_time of YA1> begin_time of YA1 and the reverse is not true, if YA1 ε R. For symmetry, it is also easy to see that YA2 is derived from the other YA1 and the converse is not true. Based on these Y_Alerts and Meta-relationship “R”, an experimental model for alert correlation and generat- ing Red Alert ‘RA’ is depicted as shown in Figure 4. The Figure 4 shows a self-evolving model for relation- ship correlation and detection. The alerts are correlated and the ones which exist in the database are reported as existing relationship incidence. This step reduces a greater number of alerts for modeling of relationships in the network. In the second step, the isolated alerts are correlated with Meta-relationship ‘R’. If correlated, the Meta- relationship is reported as R_Alert and termed as a new relationship. After that, it is described in the data- base. The setup illustrated in Figure 4 may be summa- rized in an algorithm as follows: Relationship Detection Algorithm: After an alert is sensed, the following sequence of events takes place: 1) If there is an existing Red_Alert ‘RA’, whose set_C contains consequence of new YA, go to step “g”, else go to step “b”. 2) If prerequisite of ‘YA’ is empty go to step “e”, else go to step “c”. 3) If there is a Red_Alert ‘RA’ and union of capability of RA’s set_C implies prerequisite of ‘YA’, go to step “e”, else go to step “d”. 4) If there are some meta-relationships existing and the union of the set_C of these meta-attacks implies the prerequisite of YA, then combine these meta_relationship to a new Red_Alert RA, go to step “e”, else go to step “f ”. 5) If the union of set_C of the newly combined meta-relationship ‘R’ implies consequence of YA, go to step “g”, else go to step “f ”. 6) Let YA join the red_alert ‘RA’, put YA into RA’s set_R and let consequence of RA join set_C, determine RA’s time stamp. Break 7) Discard false alert YA; go to ‘a’ to deal with next yellow alert ‘YA’. In the next section, an experimental setup is described to simulate the discovery and clustering of relationships developed in a local area network. 4. Experimental Setup A typical local area network was selected with about five hundred and fifty user accounts. The accounts were grouped into five categories of access (i.e. credentials) on the network. These categories were ‘administration’, ‘faculty’, ‘student’, ‘staff’, and ‘public’. The actions sup- posed to be carried through these accounts during net- work access involved five different types of actions on twelve different target hosts or servers. The actions in- volved were ‘create’, ‘modify’, ‘read’, ‘delete’, and ‘not available/unauthorized’. The target hosts were centrally placed in a room. The service available on different tar- get hosts contained files and programs. The objective was to examine the network setup vis-à-vis Figure 4, usi- ng the procedure outlined in the algorithm described in the previous section. Based on this information, six-tuple data was gener- ated using Equation (9) for any user access. A data map- ping followed that coverts these tuples to numerical val- ues to train the network. The time stamp was added to make it to seven-tuple data to show evolution of the rela- tionships during run time. These data values enable self-organizing feature of Kohonen network to allow data values to be mapped onto a two-dimensional plane with similar data residing in closer proximity. The architecture of such a network can be reduced to two key issues: input layer and output layer [14]. The number of input nodes (say 7 based on source address, time stamp, target, service, property, action, credentials) equals the dimension of the input vector. The output lay- er processes the input data and gives an output. The num- ber of output nodes determines the maximum number of Figure 4. Relationship measurement & description model. C opyright © 2010 SciRes. IJCNS  Q. A. MEMON 308 )ij clusters to be found. Each neuron (node) in the output sheet has a location in the configuration and represents a cluster, or alternatively a set of common features. The proposed system uses Kohonen Self Organizing Maps (SOM) to plot a matrix of the available data. This is a two dimensional plane containing 1024 cells (32x32 plot). The size of 32x32 clusters is arbitrary (although above than required number of clusters adequate for pos- sible relationship clusters in a typical local area network) and has been selected only for experimental purposes. Activity on the network was monitored for users on a full working day. The period of network activity for a typical user ranged from few minutes to less than sev- enty minutes.Out of five hundred and fifty user accounts, one hundred and eighty–five users accessed the network at different times. The mapped values for these users accumulated in a database were processed to train the SOM network to generate capability clusters. Once built, the SOM takes the data from the database and decides the position of a user entity or the source of activity in the network based on the attributes attached to it. It contains 32 × 32 output nodes along with input nodes, hence total of (7 × 32 × 32 ) 7168 weights of the network were updated each time an input pattern (i.e., seven-tuple data) was presented for training. This proc- ess continued till convergence of its training algorithm. The algorithm used for training of the network typically undergoes the following steps [14]: Define input value range Present an input pattern (i.e., twenty data values) Compute distance between input and weight, and sum them Select the output node with minimum distance – this is the node that is closest to the input vector Alter weights for the closest node (and its neigh- bours) so that it is even nearer to the input vector. Go to step 2 until convergence is achieved. Effectively, this training algorithm is very simple, fol- lowing a familiar equation: (iiwjk xw (12) where k is the learning coefficient, x is input pattern, wij is weight in two dimensions, and ∆ wij is the change in the weight. So all neurons in neighbourhood (say N) to neuron xd0 (i.e., the one with minimum distance) have their weights adjusted. The adjustment of k and N is an area of much research, but Kohonen suggested splitting the training up into two phases. Phase 1 reduces down the learning coefficient from 0.9 to 0.1 (or similar val- ues), and the neighbourhood reduces from half the di- ameter of the network down to the immediately sur- rounding cells (N = 1). Following that, phase 2 reduces the learning coefficient from perhaps 0.1 to 0.0 but over double or more the number of iterations in phase 1. The neighbourhood value is fixed at 1. It was seen that the two phases allow firstly the network to quickly ‘fill out the space’ with the second phase fine-tuning the network to a more accurate representation of the space. The re- sulting output diagram may be visualized showing clus- ters, evolving as time progresses. The examples of typi- cal clusters include each user accessing the network, each object to be accessed on the network, each targeted host, each action, each service, and each credential of the user, etc. This part of the experiment did not involve any corre- lation as there were previously, in fact no capability clus- ters present in the database. Rather, this activity filled up the database with relationship description, to the extent of entering second part of the activity where correlation is to be examined and database is to be enriched with new relationships. This part of the experiment is also con- sidered equivalently as setting threshold for correlation. For the second part of the experiment, the network was monitored for second and third day of the experiment. This enabled to see most of the users accessing the similar objects on the network, thus generating an alert. In this part of the experiment, a total of seventy (70) new users were identified, and thus relationships were described in the database, and clusters created onto the map. A visualization application was added to the network (with the database) to enable analysis of emerging in- formation from these activities, as access to the network evolves. The double click, for example on an object clu- ster shows data from the database, about how many users accessed it with respective credentials and actions with respect to time. Though, it was visualized in real time through alerts. In another example, a user access along with its credential was monitored in real time with a range of objects accessed on a particular host with re- spective actions. In each instance, respective alert gener- ated was observed. 5. Comparative Discussion The clustering approach proposed in this work is simple and addresses the objectives for real time notification of (registered) alerts and enriches the database with evolv- ing relationships. An important component of network policy in many commercial environments is separation of duty and monitoring of network traffic for network management purposes. Nowadays, many networks deploy policy based access to the network to implement separation of duty. The role based access control (RBAC) model [5] provides a conceptual framework for implementing a role based activity in a policy. However, it does not de- tect an evolving capability of the user growing beyond its legitimate strength or access limits. This weakness is Copyright © 2010 SciRes. IJCNS  Q. A. MEMON 309 generally found in networks, when the status of a (pri- vate & secured) object on the network that is being ac- cessed, modified or deleted by a user exceeding one’s role. The approach in this work identifies the relation- ships while they are evolving or in other words the object contents are to be accessed. Such a weakness in the sys- tem deploying only RBAC may be addressed using the proposed approach by setting role of the respective ac- count with objects on the targeted hosts. The threshold is set accordingly to generate alert. Thus, the system gets added capability. In fact, the proposed model provides a self-adaptable approach to trigger the tolerance level of the system. The six-tuple capability data is user-defined and may replace source with an IP address by its role; or capability may even be increased beyond six-tuple by adding role of the user entity to existing six-tuple data. This tends to in- crease the number of clusters and in turn strengths the correlation process of the system. The other examples of undetected activities include access to the object by interaction of (internal or external) users, etc. This situation may be addressed using our approach, as described in Equation (10), and outlined in the algorithm. In other words, the evolving relationship between the user and the object is alerted during the cor- relation stage, earlier than it takes place. The proposed approach is independent of many con- straints. At a centralized place, it provides a real time discovery of evolving relationships amongst users or between users and network object. The proposed ap- proach can also be easily embedded in distributed envi- ronments to trigger alerts before systems become vul- nerable to attacks. In that case, a modification may be suggested such that the six-tuple capability data would be provided by distributed sniffers rather than a set of closely and fixed-placed sniffers. There are many correlation algorithms available in the literature like [19,20], which may be used in conjunction with our proposed approach. 6. Conclusions and Future Work The proposed model for detecting relationships is highly customizable as it is dependent on capability model which is user defined. The approach may be independ- ently deployed or used in conjunction with existing ap- proaches, for example, intrusion detection. The database evolves with time as new relationships are discovered and capabilities are formed as clusters. The detection of relationships may be done using network sensors or sniffers by reading the network packets. Two stages of correlation are performed; first one detects using cluster knowledge compared with capability of the entity; the second stage meta-correlation enables enriching of net- work database by identifying new relationships. As more and more events are registered, lesser becomes the prob- ability of finding new patterns of relationships and easier becomes the job of the network management. As a future work, we intend to modify some parame- ters of the clustering: first we want to confirm the rele- vance of the pattern with role based access and set the threshold to initiation of possible new relationship; sec- ondly we want to develop distributed monitoring of these relationships and observe frequency of such events to discover new associations within the data. 7. Acknowledgement This work was financially supported by the Research Affairs at the UAE University under a contract no. 03-04-7-11/06. 8. References [1] T. Shinohara, “Ubiquitous network vision for new growth,” ITU Telecom Report, 2003. [2] L. Srivastava, “The network of the future: What is over the horizon,” Billing Asia 2006, Shanghai, China, 13 March 2006. [3] Y. Zhang and W. Lee, “An integrated environment for testing mobile ad-hoc networks,” Proceedings of 3rd ACM Symposium on Mobile Ad Hoc Networking and Computing (MobiHoc), June 2002. [4] R. Fernandez, “Enterprise dynamic access control (EDA C) case study,” CS1/06-0078 Project, United States Navy, March 2006. [5] National Institute of Standards and Technology-RBAC. http://csrc.nist.gov/rbac/. [6] D. Hammerstrom, “Neural networks at work,” IEEE Spectrum, pp. 26–32, June 1993. [7] Aleksander, et al., “An Introduction to neural comput- ing,” Chapman and Hall, 1990. [8] N. Ye, X. Li, Q. Chen, S. Emran, and M. Xu, “Probabil- istic techniques for intrusion detection based on computer audit data,” IEEE Transactions on Systems, Man, and Cybernetics-Part A: Systems and Humans, Vol. 31, No. 4, pp. 266–274, 2001. [9] R. Fuller and M. Kantardzic, “Distributed monitoring of frequent items,” Transactions on Machine Learning and Data Mining, Vol. 1, No. 2, pp. 67–82, 2008. [10] F. Anjum, D. Subhadrabandhu, and S. Sarkar, “Signature based intrusion detection for wireless ad hoc networks: A comparative study of various routing protocols,” IEEE Vehicular Technology Conference, Orlando, FL, Vol. 58, pp. 2152–2156, 6–9 October 2003. [11] A. Mishra, K. Nadkarni, and A. Patcha, “Intrusion detec- tion in wireless ad hoc networks,” IEEE Wireless Com- munications, pp. 48–60, February 2004. C opyright © 2010 SciRes. IJCNS  Q. A. MEMON Copyright © 2010 SciRes. IJCNS 310 [12] D. Subhadrabandhu, S. Sarkar, and F. Anjum, “Efficacy of misuse detection in ad hoc networks,” Proceedings of the Annual IEEE Communications Society Conference on Sensor and Ad Hoc Communications and Networks, pp. 97–107, 2004. [13] T. Chen and V. Venkataramanan, “Dempster-Shafer the- ory for intrusion detection in ad hoc networks,” IEEE Internet Computing, pp. 35–41, December 2005. [14] T. Otto, A. Meyer-Baese, M. Hurdal, D. Sumners, D. Auer, and A. Wismuller, “Model-free functional MRI analysis using cluster-based methods,” Proceedings of SPIE, Vol. 5103, pp. 17–24, August 2003. [15] S. Przylucki, W. Wojcik, K. Plachecki, and T. Golec, “An analysis of self-organization process for data classifica- tion in multisensor systems,” Proceedings of SPIE, Vol. 5124, pp. 325–332, September 2003. [16] P. D’Urso and L. Giovanni, “Temporal self-organizing maps for telecommunications market segmentation,” Neurocomputing, Vol. 71, pp. 2880–2892, 2008. [17] T. Voegtlin and P. Dominey, “Recursive self-organizing maps,” Neural Networks, Vol. 15, No. 8–9, pp. 979–991, 2002. [18] B. Hammer, A. Micheli, A. Sperduti, and M. Strickert, “Recursive self-organizing network models,” Neural Networks, Vol. 17, No. 8–9, pp. 1061–1085, 2004. [19] Y. Shidara, M. Mineichi Kudo, and A. Nakamura, “Clas- sification based on consistent itemset rules,” Transactions on Machine Learning and Data Mining, Vol. 1, No. 1, pp. 17–30, 2008. [20] A. Fornells, E. Armengol, E. Golobardes, S. Puig, and J. Malvehy, “Experiences using clustering and generaliza- tions for knowledge discovery in melanomas domain,” Transactions on Machine Learning and Data Mining, Vol. 1, No. 2, pp. 49–65, 2008. [21] K. Rosen, “Discrete mathematics and its applications,” 4th Edition, McGraw-Hill Publishers, 2000. [22] V. Krebs, “Introduction to social network analysis,” 15 January 2007. http://www.orgnet.com/sna.html.
|