Paper Menu >>
Journal Menu >>
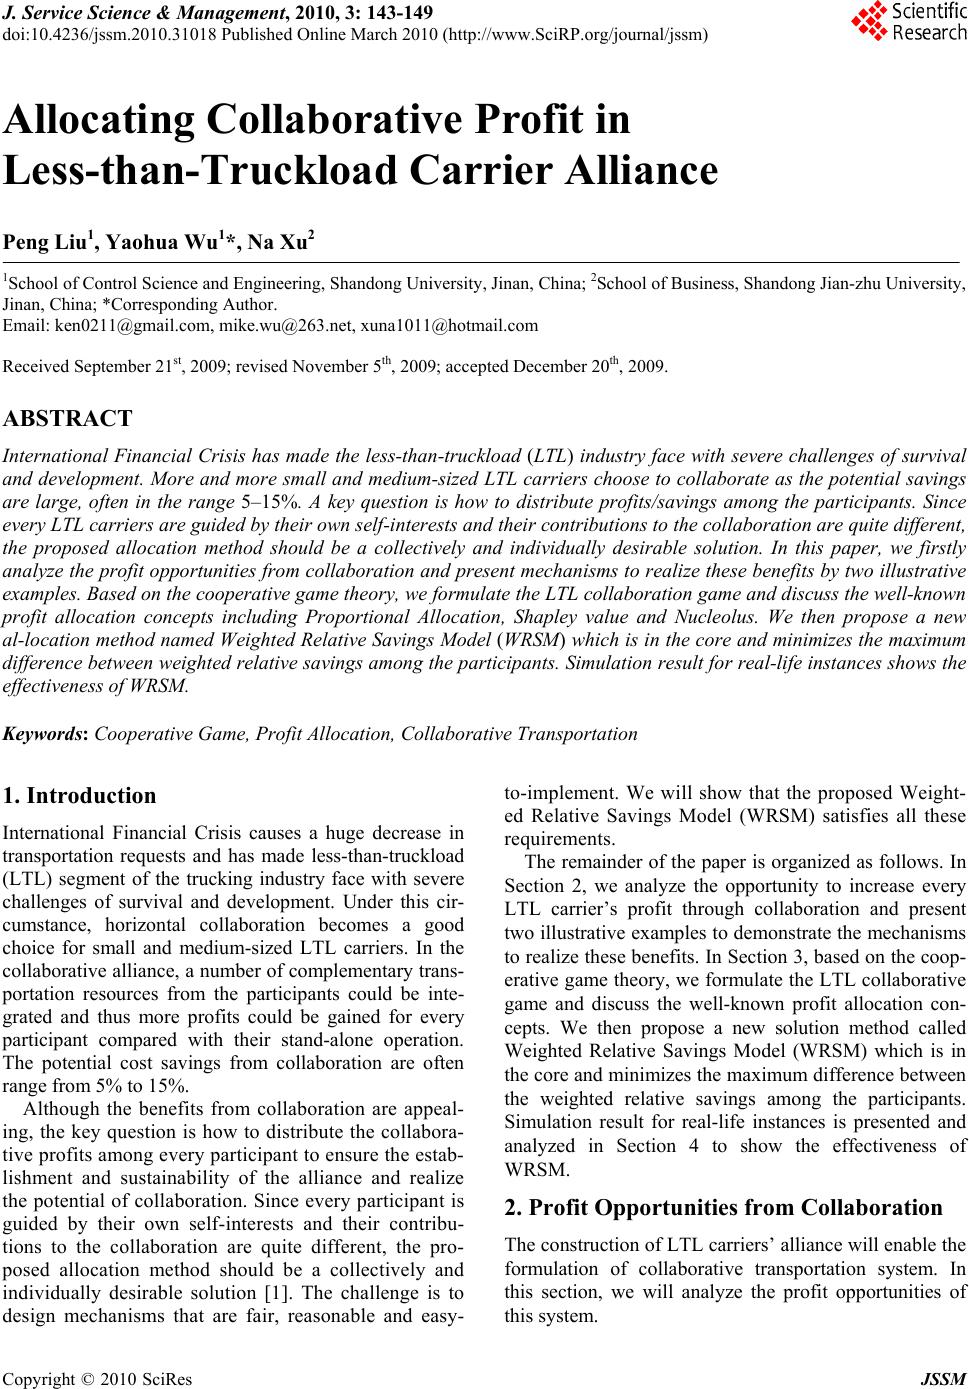 J. Service Science & Management, 2010, 3: 143-149 doi:10.4236/jssm.2010.31018 Published Online March 2010 (http://www.SciRP.org/journal/jssm) Copyright © 2010 SciRes JSSM 143 Allocating Collaborative Profit in Less-than-Truckload Carrier Alliance Peng Liu1, Yaohua Wu1*, Na Xu2 1School of Control Science and Engineering, Shandong University, Jinan, China; 2School of Business, Shandong Jian-zhu University, Jinan, China; *Corresponding Author. Email: ken0211@gmail.com, mike.wu@263.net, xuna1011@hotmail.com Received September 21st, 2009; revised November 5th, 2009; accepted December 20th, 2009. ABSTRACT International Financial Crisis has made the less-than-truckload (LTL) industry face with severe challenges of survival and development. More and more small and medium-sized LTL carriers choose to collaborate as the potential savings are large, often in the range 5–15%. A key question is how to distribute profits/savings among the participants. Since every LTL carriers are guided by their own self-interests and their contributions to the collaboration are quite different, the proposed allocation method should be a collectively and individually desirable solution. In this paper, we firstly analyze the profit oppo rtunities from collaboration and present mecha nisms to realize these benefits by two illustrative examples. Based on the co operative gam e theory, we formula te the LTL co llabo ration game and discuss the well-kn own profit allocation concepts including Proportional Allocation, Shapley value and Nucleolus. We then propose a new al-location method named Weighted Relative Savings Model (WRSM) which is in the core and minimizes the maximum difference between weighted relative sa vings among the participants. Simulation resu lt for real-life instances shows the effectiveness of WRSM. Keywords: Cooperative Game, Profit Allocation, Collaborative Transportation 1. Introduction International Financial Crisis causes a huge decrease in transportation requests and has made less-than-truckload (LTL) segment of the trucking industry face with severe challenges of survival and development. Under this cir- cumstance, horizontal collaboration becomes a good choice for small and medium-sized LTL carriers. In the collaborative alliance, a number of complementary trans- portation resources from the participants could be inte- grated and thus more profits could be gained for every participant compared with their stand-alone operation. The potential cost savings from collaboration are often range from 5% to 15%. Although the benefits from collaboration are appeal- ing, the key question is how to distribute the collabora- tive profits among every participant to ensure the estab- lishment and sustainability of the alliance and realize the potential of collaboration. Since every participant is guided by their own self-interests and their contribu- tions to the collaboration are quite different, the pro- posed allocation method should be a collectively and individually desirable solution [1]. The challenge is to design mechanisms that are fair, reasonable and easy- to-implement. We will show that the proposed Weight- ed Relative Savings Model (WRSM) satisfies all these requirements. The remainder of the paper is organized as follows. In Section 2, we analyze the opportunity to increase every LTL carrier’s profit through collaboration and present two illustrative examples to demonstrate the mechanisms to realize these benefits. In Section 3, based on the coop- erative game theory, we formulate the LTL collaborative game and discuss the well-known profit allocation con- cepts. We then propose a new solution method called Weighted Relative Savings Model (WRSM) which is in the core and minimizes the maximum difference between the weighted relative savings among the participants. Simulation result for real-life instances is presented and analyzed in Section 4 to show the effectiveness of WRSM. 2. Profit Opportunities from Collaboration The construction of LTL carriers’ alliance will enable the formulation of collaborative transportation system. In this section, we will analyze the profit opportunities of this system. 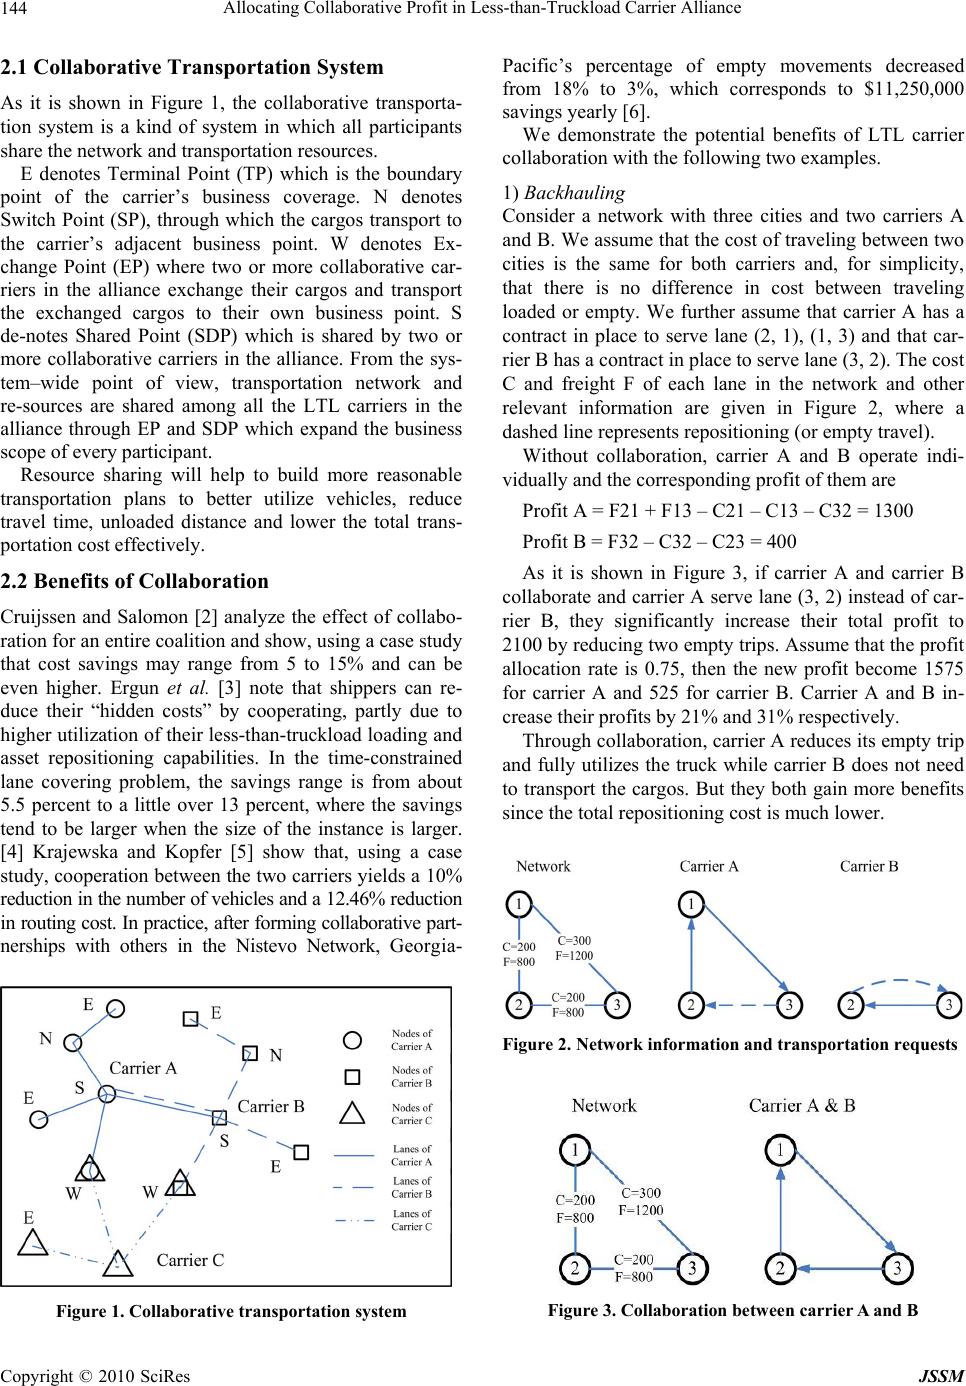 Allocating Collaborative Profit in Less-than-Truckload Carrier Alliance Copyright © 2010 SciRes JSSM 144 2.1 Collaborative Transportation System As it is shown in Figure 1, the collaborative transporta- tion system is a kind of system in which all participants share the network and transportation resources. E denotes Terminal Point (TP) which is the boundary point of the carrier’s business coverage. N denotes Switch Point (SP), through which the cargos transport to the carrier’s adjacent business point. W denotes Ex- change Point (EP) where two or more collaborative car- riers in the alliance exchange their cargos and transport the exchanged cargos to their own business point. S de-notes Shared Point (SDP) which is shared by two or more collaborative carriers in the alliance. From the sys- tem–wide point of view, transportation network and re-sources are shared among all the LTL carriers in the alliance through EP and SDP which expand the business scope of every participant. Resource sharing will help to build more reasonable transportation plans to better utilize vehicles, reduce travel time, unloaded distance and lower the total trans- portation cost effectively. 2.2 Benefits of Collaboration Cruijssen and Salomon [2] analyze the effect of collabo- ration for an entire coalition and show, using a case study that cost savings may range from 5 to 15% and can be even higher. Ergun et al. [3] note that shippers can re- duce their “hidden costs” by cooperating, partly due to higher utilization of their less-than-truckload loading and asset repositioning capabilities. In the time-constrained lane covering problem, the savings range is from about 5.5 percent to a little over 13 percent, where the savings tend to be larger when the size of the instance is larger. [4] Krajewska and Kopfer [5] show that, using a case study, cooperation between the two carriers yields a 10% reduction in the number of vehicles and a 12.46% reduction in routing cost. In practice, after forming collaborative part- nerships with others in the Nistevo Network, Georgia- Figure 1. Collaborative transportation system Pacific’s percentage of empty movements decreased from 18% to 3%, which corresponds to $11,250,000 savings yearly [6]. We demonstrate the potential benefits of LTL carrier collaboration with the following two examples. 1) Backhauling Consider a network with three cities and two carriers A and B. We assume that the cost of traveling between two cities is the same for both carriers and, for simplicity, that there is no difference in cost between traveling loaded or empty. We further assume that carrier A has a contract in place to serve lane (2, 1), (1, 3) and that car- rier B has a contract in place to serve lane (3, 2). The cost C and freight F of each lane in the network and other relevant information are given in Figure 2, where a dashed line represents repositioning (or empty travel). Without collaboration, carrier A and B operate indi- vidually and the corresponding profit of them are Profit A = F21 + F13 – C21 – C13 – C32 = 1300 Profit B = F32 – C32 – C23 = 400 As it is shown in Figure 3, if carrier A and carrier B collaborate and carrier A serve lane (3, 2) instead of car- rier B, they significantly increase their total profit to 2100 by reducing two empty trips. Assume that the profit allocation rate is 0.75, then the new profit become 1575 for carrier A and 525 for carrier B. Carrier A and B in- crease their profits by 21% and 31% respectively. Through collaboration, carrier A reduces its empty trip and fully utilizes the truck while carrier B does not need to transport the cargos. But they both gain more benefits since the total repositioning cost is much lower. Figure 2. Network information and transportation requests Figure 3. Collaboration betwee n carrier A and B 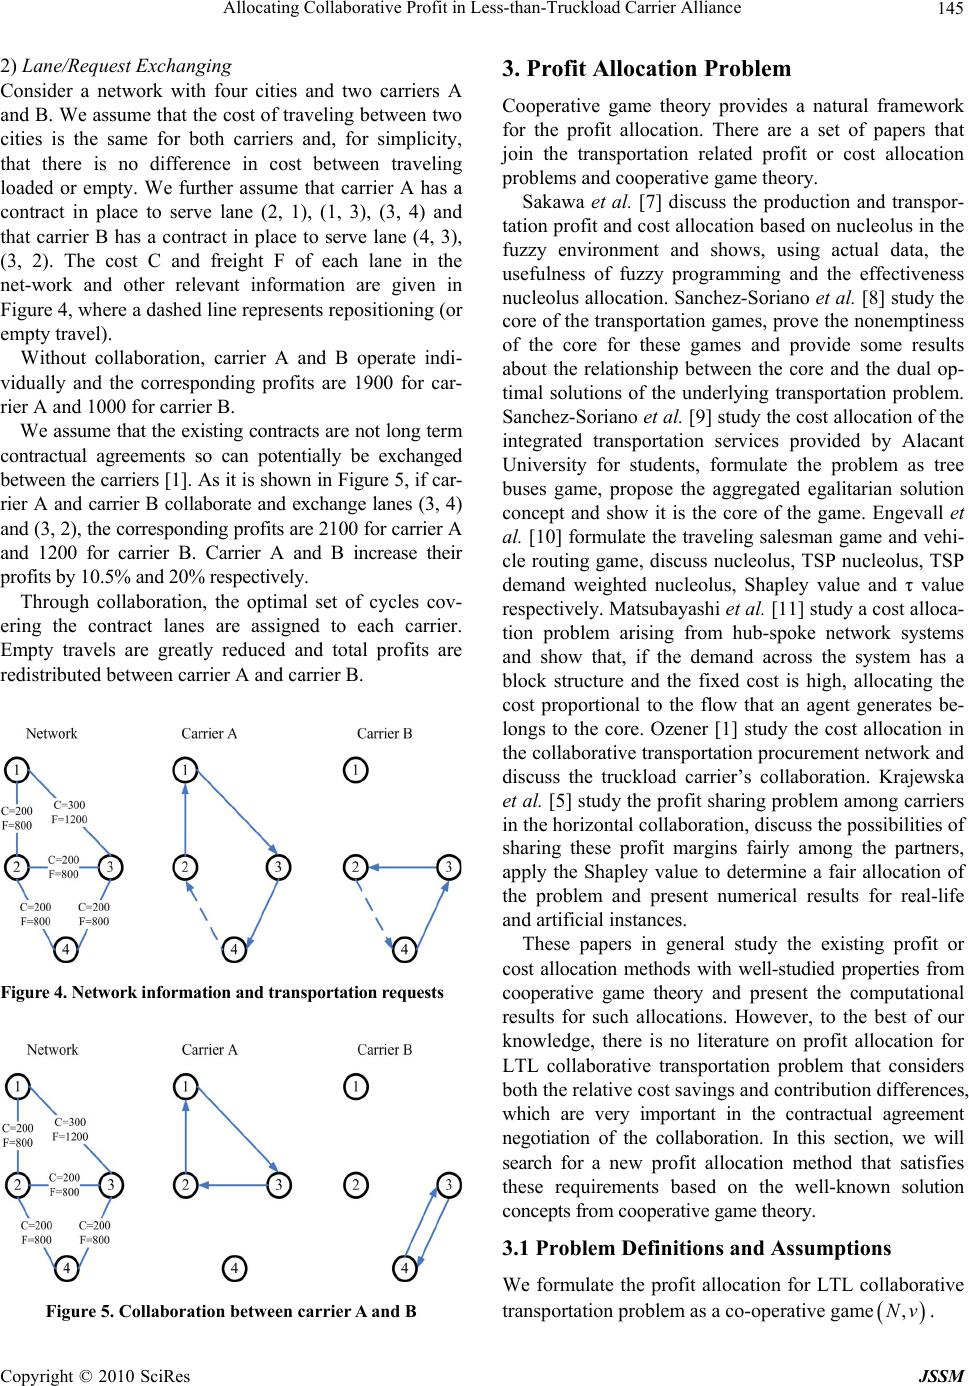 Allocating Collaborative Profit in Less-than-Truckload Carrier Alliance Copyright © 2010 SciRes JSSM 145 2) Lane/Request Exchanging Consider a network with four cities and two carriers A and B. We assume that the cost of traveling between two cities is the same for both carriers and, for simplicity, that there is no difference in cost between traveling loaded or empty. We further assume that carrier A has a contract in place to serve lane (2, 1), (1, 3), (3, 4) and that carrier B has a contract in place to serve lane (4, 3), (3, 2). The cost C and freight F of each lane in the net-work and other relevant information are given in Figure 4, where a dashed line represents repositioning (or empty travel). Without collaboration, carrier A and B operate indi- vidually and the corresponding profits are 1900 for car- rier A and 1000 for carrier B. We assume that the existing contracts are not long term contractual agreements so can potentially be exchanged between the carriers [1]. As it is shown in Figure 5, if car- rier A and carrier B collaborate and exchange lanes (3, 4) and (3, 2), the corresponding profits are 2100 for carrier A and 1200 for carrier B. Carrier A and B increase their profits by 10.5% and 20% respectively. Through collaboration, the optimal set of cycles cov- ering the contract lanes are assigned to each carrier. Empty travels are greatly reduced and total profits are redistributed between carrier A and carrier B. Figure 4. Network information and transportation requests Figure 5. Collaboration betwee n carrier A and B 3. Profit Allocation Problem Cooperative game theory provides a natural framework for the profit allocation. There are a set of papers that join the transportation related profit or cost allocation problems and cooperative game theory. Sakawa et al. [7] discuss the production and transpor- tation profit and cost allocation based on nucleolus in the fuzzy environment and shows, using actual data, the usefulness of fuzzy programming and the effectiveness nucleolus allocation. Sanchez-Soriano et al. [8] study the core of the transportation games, prove the nonemptiness of the core for these games and provide some results about the relationship between the core and the dual op- timal solutions of the underlying transportation problem. Sanchez-Soriano et al. [9] study the cost allocation of the integrated transportation services provided by Alacant University for students, formulate the problem as tree buses game, propose the aggregated egalitarian solution concept and show it is the core of the game. Engevall et al. [10] formulate the traveling salesman game and vehi- cle routing game, discuss nucleolus, TSP nucleolus, TSP demand weighted nucleolus, Shapley value and τ value respectively. Matsubayashi et al. [11] study a cost alloca- tion problem arising from hub-spoke network systems and show that, if the demand across the system has a block structure and the fixed cost is high, allocating the cost proportional to the flow that an agent generates be- longs to the core. Ozener [1] study the cost allocation in the collaborative transportation procurement network and discuss the truckload carrier’s collaboration. Krajewska et al. [5] study the profit sharing problem among carriers in the horizontal collaboration, discuss the possibilities of sharing these profit margins fairly among the partners, apply the Shapley value to determine a fair allocation of the problem and present numerical results for real-life and artificial instances. These papers in general study the existing profit or cost allocation methods with well-studied properties from cooperative game theory and present the computational results for such allocations. However, to the best of our knowledge, there is no literature on profit allocation for LTL collaborative transportation problem that considers both the relative cost savings and contribution differences, which are very important in the contractual agreement negotiation of the collaboration. In this section, we will search for a new profit allocation method that satisfies these requirements based on the well-known solution concepts from cooperative game theory. 3.1 Problem Definitions and Assumptions We formulate the profit allocation for LTL collaborative transportation problem as a co-operative game ,Nv. 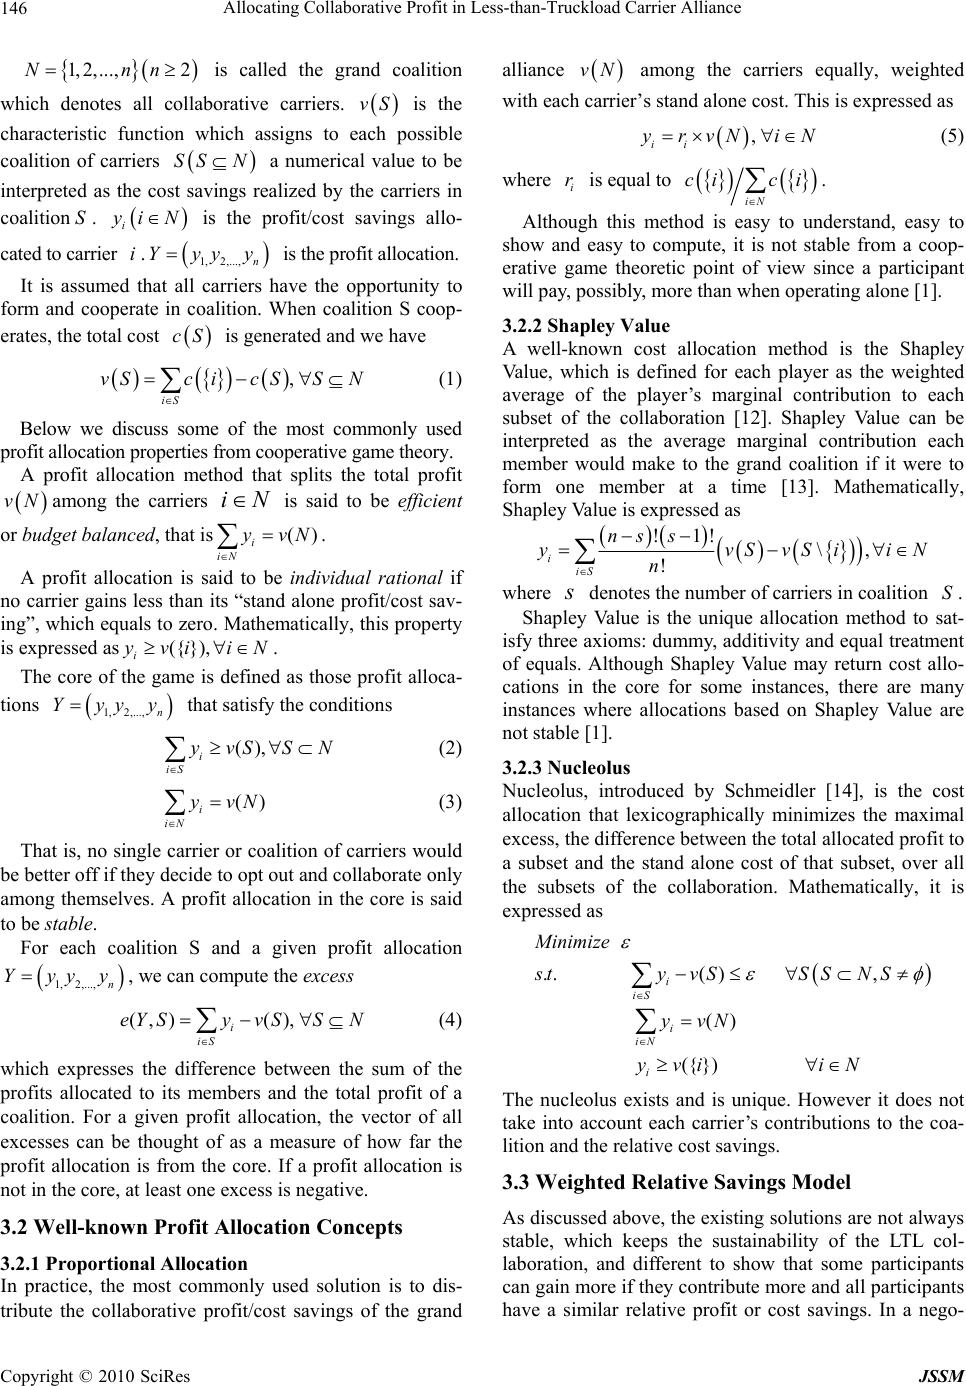 Allocating Collaborative Profit in Less-than-Truckload Carrier Alliance Copyright © 2010 SciRes JSSM 146 1, 2,...,2Nnn is called the grand coalition which denotes all collaborative carriers. vS is the characteristic function which assigns to each possible coalition of carriers SS N a numerical value to be interpreted as the cost savings realized by the carriers in coalition S. i y iN is the profit/cost savings allo- cated to carrier i. 1, 2,..., n Yyyy is the profit allocation. It is assumed that all carriers have the opportunity to form and cooperate in coalition. When coalition S coop- erates, the total cost cS is generated and we have , iS vSc icSSN (1) Below we discuss some of the most commonly used profit allocation properties from cooperative game theory. A profit allocation method that splits the total profit vN among the carriers iN is said to be efficient or budget balanced, that is() i iN yvN . A profit allocation is said to be individual rational if no carrier gains less than its “stand alone profit/cost sav- ing”, which equals to zero. Mathematically, this property is expressed as({ }), i yvi iN. The core of the game is defined as those profit alloca- tions 1, 2,..., n Yyyy that satisfy the conditions (), i iS yvSSN (2) () i iN yvN (3) That is, no single carrier or coalition of carriers would be better off if they decide to opt out and collaborate only among themselves. A profit allocation in the core is said to be stable. For each coalition S and a given profit allocation 1, 2,..., n Yyyy, we can compute the excess (,) (), i iS eY SyvSSN (4) which expresses the difference between the sum of the profits allocated to its members and the total profit of a coalition. For a given profit allocation, the vector of all excesses can be thought of as a measure of how far the profit allocation is from the core. If a profit allocation is not in the core, at least one excess is negative. 3.2 Well-known Profit Allocation Concepts 3.2.1 Proportional Allocation In practice, the most commonly used solution is to dis- tribute the collaborative profit/cost savings of the grand alliance vN among the carriers equally, weighted with each carrier’s stand alone cost. This is expressed as , ii y rvN iN (5) where i r is equal to iN ci ci . Although this method is easy to understand, easy to show and easy to compute, it is not stable from a coop- erative game theoretic point of view since a participant will pay, possibly, more than when operating alone [1]. 3.2.2 Shapley Value A well-known cost allocation method is the Shapley Value, which is defined for each player as the weighted average of the player’s marginal contribution to each subset of the collaboration [12]. Shapley Value can be interpreted as the average marginal contribution each member would make to the grand coalition if it were to form one member at a time [13]. Mathematically, Shapley Value is expressed as !1! \, ! iiS ns s yvSvSiiN n where s denotes the number of carriers in coalition S. Shapley Value is the unique allocation method to sat- isfy three axioms: dummy, additivity and equal treatment of equals. Although Shapley Value may return cost allo- cations in the core for some instances, there are many instances where allocations based on Shapley Value are not stable [1]. 3.2.3 Nucleolus Nucleolus, introduced by Schmeidler [14], is the cost allocation that lexicographically minimizes the maximal excess, the difference between the total allocated profit to a subset and the stand alone cost of that subset, over all the subsets of the collaboration. Mathematically, it is expressed as ..( ), () ({}) i iS i iN i M inimize styv SSSNS yvN yvi iN The nucleolus exists and is unique. However it does not take into account each carrier’s contributions to the coa- lition and the relative cost savings. 3.3 Weighted Relative Savings Model As discussed above, the existing solutions are not always stable, which keeps the sustainability of the LTL col- laboration, and different to show that some participants can gain more if they contribute more and all participants have a similar relative profit or cost savings. In a nego- 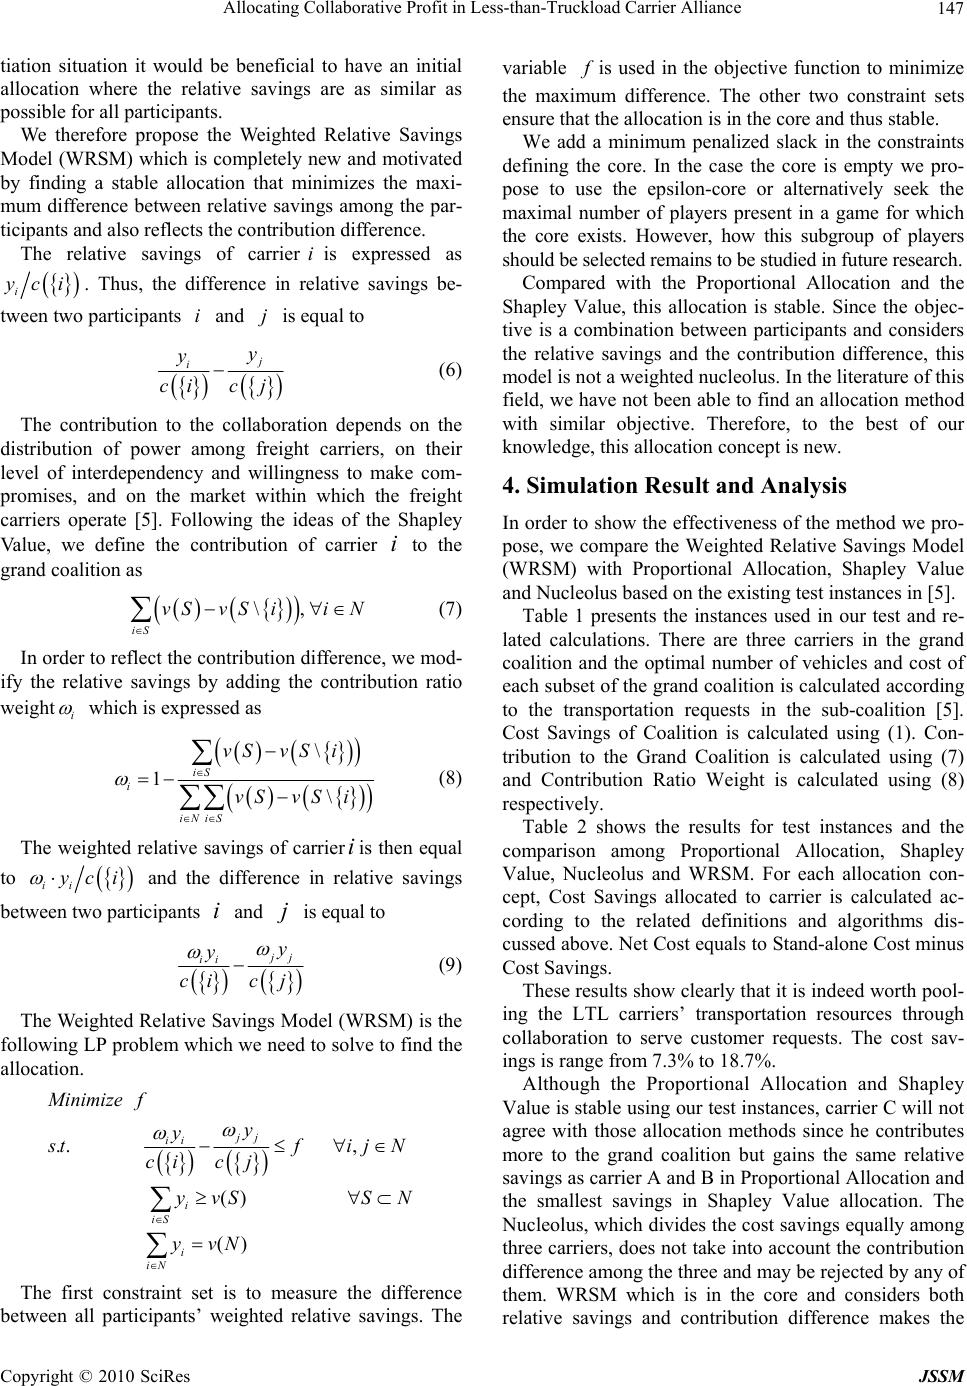 Allocating Collaborative Profit in Less-than-Truckload Carrier Alliance Copyright © 2010 SciRes JSSM 147 tiation situation it would be beneficial to have an initial allocation where the relative savings are as similar as possible for all participants. We therefore propose the Weighted Relative Savings Model (WRSM) which is completely new and motivated by finding a stable allocation that minimizes the maxi- mum difference between relative savings among the par- ticipants and also reflects the contribution difference. The relative savings of carrieriis expressed as i yci . Thus, the difference in relative savings be- tween two participants i and j is equal to j iy y cicj (6) The contribution to the collaboration depends on the distribution of power among freight carriers, on their level of interdependency and willingness to make com- promises, and on the market within which the freight carriers operate [5]. Following the ideas of the Shapley Value, we define the contribution of carrier i to the grand coalition as \, iS vSvSii N (7) In order to reflect the contribution difference, we mod- ify the relative savings by adding the contribution ratio weight i which is expressed as \ 1\ iS i iNiS vSvS i vSvS i (8) The weighted relative savings of carrieriis then equal to ii yci and the difference in relative savings between two participants i and j is equal to j j ii y y cicj (9) The Weighted Relative Savings Model (WRSM) is the following LP problem which we need to solve to find the allocation. .. , () () jj ii i iS i iN Minimize f y y s tfijN cic j yvS SN yvN The first constraint set is to measure the difference between all participants’ weighted relative savings. The variable f is used in the objective function to minimize the maximum difference. The other two constraint sets ensure that the allocation is in the core and thus stable. We add a minimum penalized slack in the constraints defining the core. In the case the core is empty we pro- pose to use the epsilon-core or alternatively seek the maximal number of players present in a game for which the core exists. However, how this subgroup of players should be selected remains to be studied in future research. Compared with the Proportional Allocation and the Shapley Value, this allocation is stable. Since the objec- tive is a combination between participants and considers the relative savings and the contribution difference, this model is not a weighted nucleolus. In the literature of this field, we have not been able to find an allocation method with similar objective. Therefore, to the best of our knowledge, this allocation concept is new. 4. Simulation Result and Analysis In order to show the effectiveness of the method we pro- pose, we compare the Weighted Relative Savings Model (WRSM) with Proportional Allocation, Shapley Value and Nucleolus based on the existing test instances in [5]. Table 1 presents the instances used in our test and re- lated calculations. There are three carriers in the grand coalition and the optimal number of vehicles and cost of each subset of the grand coalition is calculated according to the transportation requests in the sub-coalition [5]. Cost Savings of Coalition is calculated using (1). Con- tribution to the Grand Coalition is calculated using (7) and Contribution Ratio Weight is calculated using (8) respectively. Table 2 shows the results for test instances and the comparison among Proportional Allocation, Shapley Value, Nucleolus and WRSM. For each allocation con- cept, Cost Savings allocated to carrier is calculated ac- cording to the related definitions and algorithms dis- cussed above. Net Cost equals to Stand-alone Cost minus Cost Savings. These results show clearly that it is indeed worth pool- ing the LTL carriers’ transportation resources through collaboration to serve customer requests. The cost sav- ings is range from 7.3% to 18.7%. Although the Proportional Allocation and Shapley Value is stable using our test instances, carrier C will not agree with those allocation methods since he contributes more to the grand coalition but gains the same relative savings as carrier A and B in Proportional Allocation and the smallest savings in Shapley Value allocation. The Nucleolus, which divides the cost savings equally among three carriers, does not take into account the contribution difference among the three and may be rejected by any of them. WRSM which is in the core and considers both relative savings and contribution difference makes the 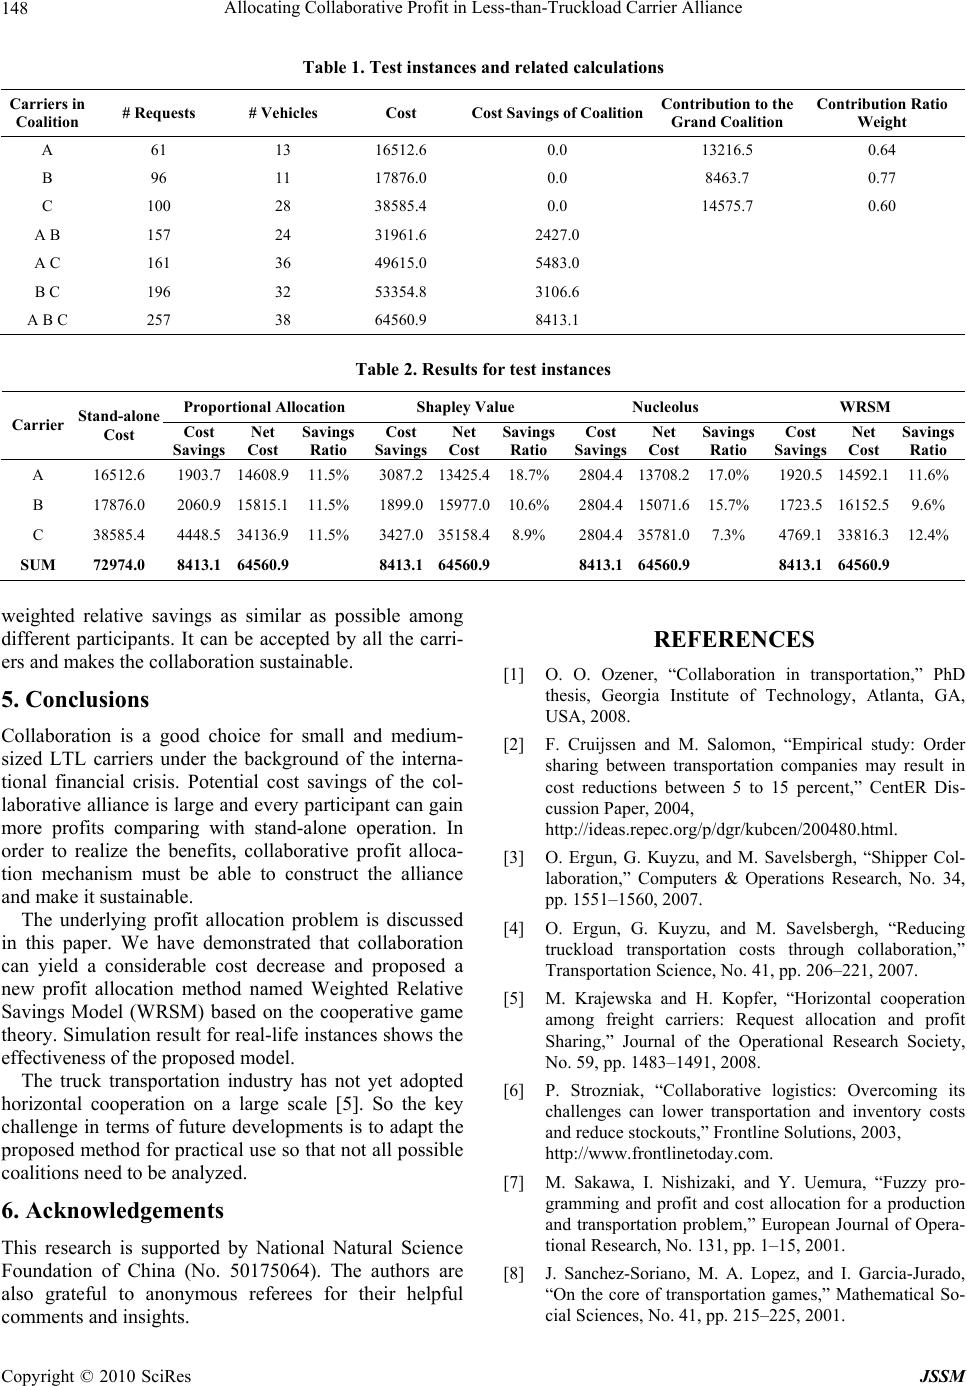 Allocating Collaborative Profit in Less-than-Truckload Carrier Alliance Copyright © 2010 SciRes JSSM 148 Table 1. Test instances and related calculations Carriers in Coalition # Requests # Vehicles Cost Cost Savings of CoalitionContribution to the Grand Coalition Contribution Ratio Weight A 61 13 16512.6 0.0 13216.5 0.64 B 96 11 17876.0 0.0 8463.7 0.77 C 100 28 38585.4 0.0 14575.7 0.60 A B 157 24 31961.6 2427.0 A C 161 36 49615.0 5483.0 B C 196 32 53354.8 3106.6 A B C 257 38 64560.9 8413.1 Table 2. Results for test instances Proportional Allocation Shapley Value Nucleolus WRSM Carrier Stand-alone Cost Cost Savings Net Cost Savings Ratio Cost Savings Net Cost Savings Ratio Cost Savings Net Cost Savings Ratio Cost Savings Net Cost Savings Ratio A 16512.6 1903.7 14608.9 11.5% 3087.213425.418.7% 2804.413708.217.0% 1920.5 14592.111.6% B 17876.0 2060.9 15815.1 11.5% 1899.015977.010.6% 2804.415071.615.7% 1723.5 16152.59.6% C 38585.4 4448.5 34136.9 11.5% 3427.035158.48.9% 2804.435781.07.3% 4769.1 33816.312.4% SUM 72974.0 8413.1 64560.9 8413.164560.9 8413.164560.9 8413.1 64560.9 weighted relative savings as similar as possible among different participants. It can be accepted by all the carri- ers and makes the collaboration sustainable. 5. Conclusions Collaboration is a good choice for small and medium- sized LTL carriers under the background of the interna- tional financial crisis. Potential cost savings of the col- laborative alliance is large and every participant can gain more profits comparing with stand-alone operation. In order to realize the benefits, collaborative profit alloca- tion mechanism must be able to construct the alliance and make it sustainable. The underlying profit allocation problem is discussed in this paper. We have demonstrated that collaboration can yield a considerable cost decrease and proposed a new profit allocation method named Weighted Relative Savings Model (WRSM) based on the cooperative game theory. Simulation result for real-life instances shows the effectiveness of the proposed model. The truck transportation industry has not yet adopted horizontal cooperation on a large scale [5]. So the key challenge in terms of future developments is to adapt the proposed method for practical use so that not all possible coalitions need to be analyzed. 6. Acknowledgements This research is supported by National Natural Science Foundation of China (No. 50175064). The authors are also grateful to anonymous referees for their helpful comments and insights. REFERENCES [1] O. O. Ozener, “Collaboration in transportation,” PhD thesis, Georgia Institute of Technology, Atlanta, GA, USA, 2008. [2] F. Cruijssen and M. Salomon, “Empirical study: Order sharing between transportation companies may result in cost reductions between 5 to 15 percent,” CentER Dis- cussion Paper, 2004, http://ideas.repec.org/p/dgr/kubcen/200480.html. [3] O. Ergun, G. Kuyzu, and M. Savelsbergh, “Shipper Col- laboration,” Computers & Operations Research, No. 34, pp. 1551–1560, 2007. [4] O. Ergun, G. Kuyzu, and M. Savelsbergh, “Reducing truckload transportation costs through collaboration,” Transportation Science, No. 41, pp. 206–221, 2007. [5] M. Krajewska and H. Kopfer, “Horizontal cooperation among freight carriers: Request allocation and profit Sharing,” Journal of the Operational Research Society, No. 59, pp. 1483–1491, 2008. [6] P. Strozniak, “Collaborative logistics: Overcoming its challenges can lower transportation and inventory costs and reduce stockouts,” Frontline Solutions, 2003, http://www.frontlinetoday.com. [7] M. Sakawa, I. Nishizaki, and Y. Uemura, “Fuzzy pro- gramming and profit and cost allocation for a production and transportation problem,” European Journal of Opera- tional Research, No. 131, pp. 1–15, 2001. [8] J. Sanchez-Soriano, M. A. Lopez, and I. Garcia-Jurado, “On the core of transportation games,” Mathematical So- cial Sciences, No. 41, pp. 215–225, 2001.  Allocating Collaborative Profit in Less-than-Truckload Carrier Alliance Copyright © 2010 SciRes JSSM 149 [9] J. Sanchez-Soriano, N. Llorce, A. Meca, and E. Molina, “An integrated transport system for Alacant’s students,” Annals of Operations Research, No. 109, pp. 41–60, 2002. [10] S. Engevall, M. Gothe-Lundgren, and P. Varbrand, “The heterogeneous vehicle-routing game,” Transportation Science, No. 38, pp. 71–85, 2004. [11] N. Matsubayashi, M. Umezawa, Y. Masuda, and H. Ni- shino, “A cost allocation problem arising in hub–spoke network systems,” European Journal of Operational Re- search, No. 160, pp. 821–838, 2005. [12] L. S. Shapley, “A value for n-person games,” Annals of Mathematical Studies, No. 28, pp. 307–317, 1953. [13] H. P. Young, “Cost allocation: Methods, principles, ap- plications,” European Journal of Operational Research, No. 27, pp. 254–255, 1986. [14] D. Schmeidler, “Nucleolus of a characteristic function game,” Siam Journal on Applied Mathematics, No. 17, pp. 1163–1170, 1969. |