Paper Menu >>
Journal Menu >>
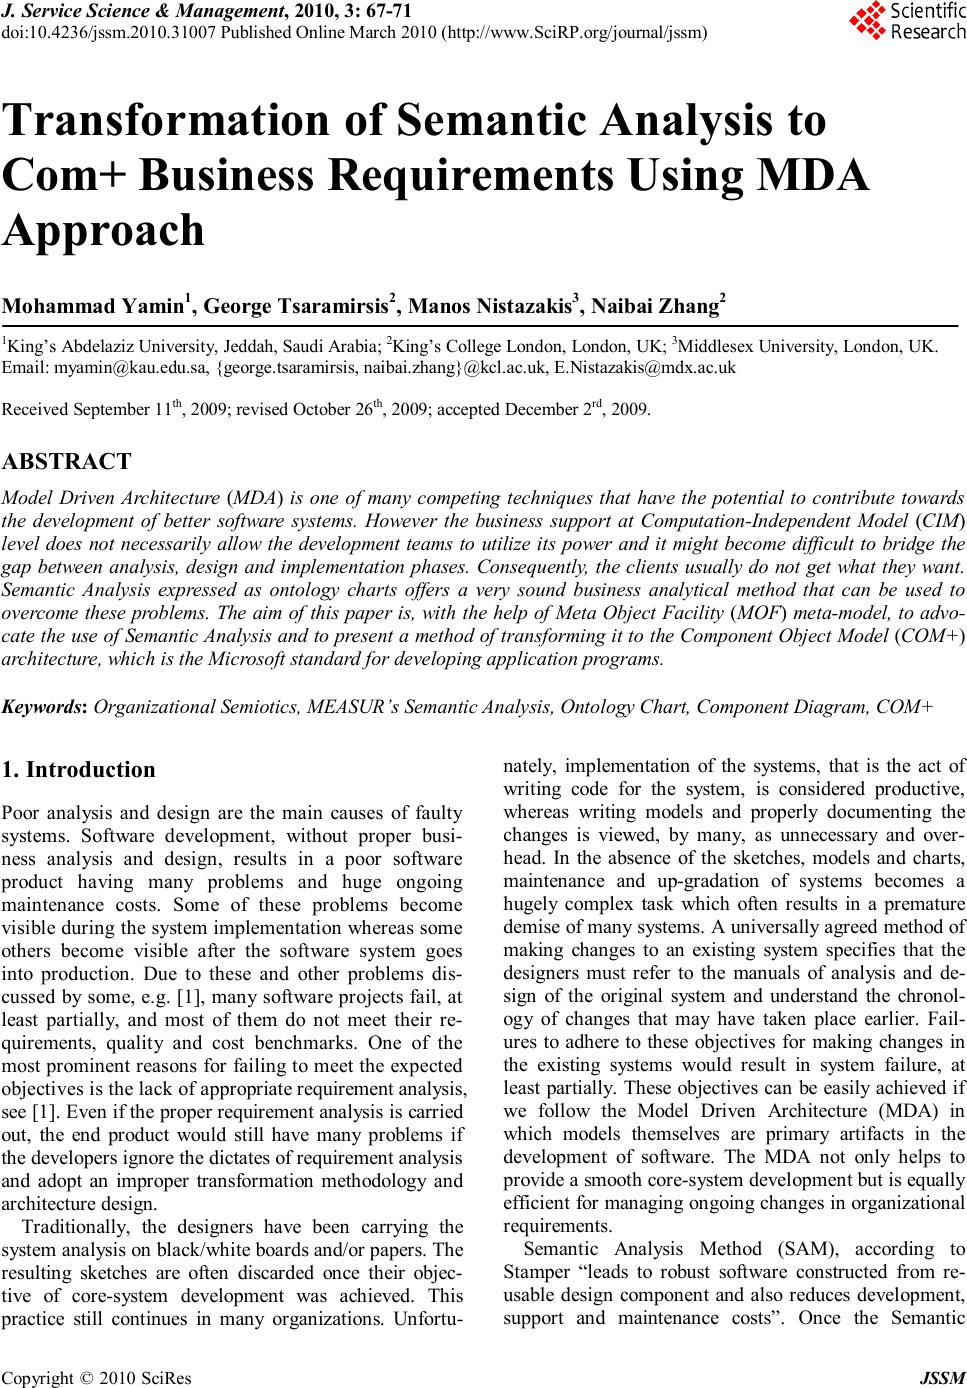 J. Service Science & Management, 2010, 3: 67-71 doi:10.4236/jssm.2010.31007 Published Online March 2010 (http://www.SciRP.org/journal/jssm) Copyright © 2010 SciRes JSSM 67 Transformation of Semantic Analysis to Com+ Business Requirements Using MDA Approach Mohammad Yamin1, George Tsaramirsis2, Manos Nistazakis3, Naibai Zhang2 1King’s Abdelaziz University, Jeddah, Saudi Arabia; 2King’s College London, London, UK; 3Middlesex University, London, UK. Email: myamin@kau.edu.sa, {george.tsaramirsis, naibai.zhang}@kcl.ac.uk, E.Nistazakis@mdx.ac.uk Received September 11th, 2009; revised October 26th, 2009; accepted December 2rd, 2009. ABSTRACT Model Driven Architecture (MDA) is one of many competing techniques that have the potential to contribute towards the development of better software systems. However the business support at Computation-Independent Model (CIM) level does not necessarily allow the development teams to utilize its power and it might become difficult to bridge the gap between analysis, design and implementation phases. Consequently, the clients usually do not get what they want. Semantic Analysis expressed as ontology charts offers a very sound business analytical method that can be used to overcome these problems. The aim of this paper is, with the help of Meta Object Facility (MOF) meta-model, to advo- cate the use of Semantic Analysis and to present a method of transforming it to the Component Object Model (COM+) architecture, which is the Microsoft standard for developing application programs. Keywords: Organizational Semiotics, MEASUR’s Semantic Analysis, Ontology Chart, Component Diagram, COM+ 1. Introduction Poor analysis and design are the main causes of faulty systems. Software development, without proper busi- ness analysis and design, results in a poor software product having many problems and huge ongoing maintenance costs. Some of these problems become visible during the system implementation whereas some others become visible after the software system goes into production. Due to these and other problems dis- cussed by some, e.g. [1], many software projects fail, at least partially, and most of them do not meet their re- quirements, quality and cost benchmarks. One of the most prominent reasons for failing to meet the expected objectives is the lack of appropriate requirement analysis, see [1]. Even if the proper requirement analysis is carried out, the end product would still have many problems if the developers ignore the dictates of requirement analysis and adopt an improper transformation methodology and architecture design. Traditionally, the designers have been carrying the system analysis on black/white boards and/or papers. The resulting sketches are often discarded once their objec- tive of core-system development was achieved. This practice still continues in many organizations. Unfortu- nately, implementation of the systems, that is the act of writing code for the system, is considered productive, whereas writing models and properly documenting the changes is viewed, by many, as unnecessary and over- head. In the absence of the sketches, models and charts, maintenance and up-gradation of systems becomes a hugely complex task which often results in a premature demise of many systems. A universally agreed method of making changes to an existing system specifies that the designers must refer to the manuals of analysis and de- sign of the original system and understand the chronol- ogy of changes that may have taken place earlier. Fail- ures to adhere to these objectives for making changes in the existing systems would result in system failure, at least partially. These objectives can be easily achieved if we follow the Model Driven Architecture (MDA) in which models themselves are primary artifacts in the development of software. The MDA not only helps to provide a smooth core-system development but is equally efficient for managing ongoing changes in organizational requirements. Semantic Analysis Method (SAM), according to Stamper “leads to robust software constructed from re- usable design component and also reduces development, support and maintenance costs”. Once the Semantic 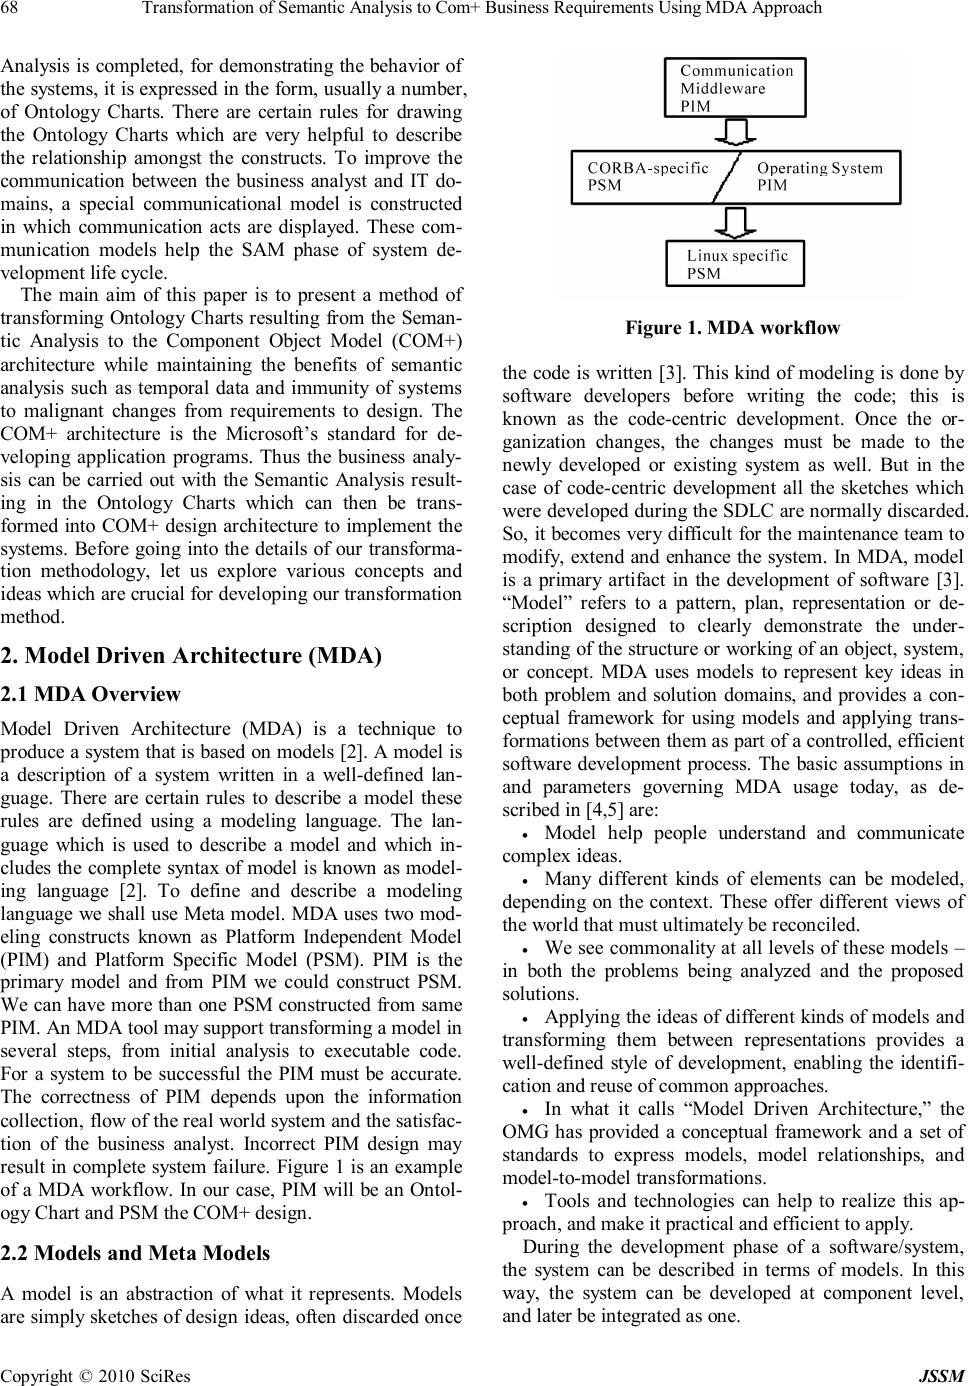 Transformation of Semantic Analysis to Com+ Business Requirements Using MDA Approach Copyright © 2010 SciRes JSSM 68 Analysis is completed, for demonstrating the behavior of the systems, it is expressed in the form, usually a number, of Ontology Charts. There are certain rules for drawing the Ontology Charts which are very helpful to describe the relationship amongst the constructs. To improve the communication between the business analyst and IT do- mains, a special communicational model is constructed in which communication acts are displayed. These com- munication models help the SAM phase of system de- velopment life cycle. The main aim of this paper is to present a method of transforming Ontology Charts resulting from the Seman- tic Analysis to the Component Object Model (COM+) architecture while maintaining the benefits of semantic analysis such as temporal data and immunity of systems to malignant changes from requirements to design. The COM+ architecture is the Microsoft’s standard for de- veloping application programs. Thus the business analy- sis can be carried out with the Semantic Analysis result- ing in the Ontology Charts which can then be trans- formed into COM+ design architecture to implement the systems. Before going into the details of our transforma- tion methodology, let us explore various concepts and ideas which are crucial for developing our transformation method. 2. Model Driven Architecture (MDA) 2.1 MDA Overview Model Driven Architecture (MDA) is a technique to produce a system that is based on models [2]. A model is a description of a system written in a well-defined lan- guage. There are certain rules to describe a model these rules are defined using a modeling language. The lan- guage which is used to describe a model and which in- cludes the complete syntax of model is known as model- ing language [2]. To define and describe a modeling language we shall use Meta model. MDA uses two mod- eling constructs known as Platform Independent Model (PIM) and Platform Specific Model (PSM). PIM is the primary model and from PIM we could construct PSM. We can have more than one PSM constructed from same PIM. An MDA tool may support transforming a model in several steps, from initial analysis to executable code. For a system to be successful the PIM must be accurate. The correctness of PIM depends upon the information collection, flow of the real world system and the satisfac- tion of the business analyst. Incorrect PIM design may result in complete system failure. Figure 1 is an example of a MDA workflow. In our case, PIM will be an Ontol- ogy Chart and PSM the COM+ design. 2.2 Models and Meta Models A model is an abstraction of what it represents. Models are simply sketches of design ideas, often discarded once Figure 1. MDA workflow the code is written [3]. This kind of modeling is done by software developers before writing the code; this is known as the code-centric development. Once the or- ganization changes, the changes must be made to the newly developed or existing system as well. But in the case of code-centric development all the sketches which were developed during the SDLC are normally discarded. So, it becomes very difficult for the maintenance team to modify, extend and enhance the system. In MDA, model is a primary artifact in the development of software [3]. “Model” refers to a pattern, plan, representation or de- scription designed to clearly demonstrate the under- standing of the structure or working of an object, system, or concept. MDA uses models to represent key ideas in both problem and solution domains, and provides a con- ceptual framework for using models and applying trans- formations between them as part of a controlled, efficient software development process. The basic assumptions in and parameters governing MDA usage today, as de- scribed in [4,5] are: • Model help people understand and communicate complex ideas. • Many different kinds of elements can be modeled, depending on the context. These offer different views of the world that must ultimately be reconciled. • We see commonality at all levels of these models – in both the problems being analyzed and the proposed solutions. • Applying the ideas of different kinds of models and transforming them between representations provides a well-defined style of development, enabling the identifi- cation and reuse of common approaches. • In what it calls “Model Driven Architecture,” the OMG has provided a conceptual framework and a set of standards to express models, model relationships, and model-to-model transformations. • Tools and technologies can help to realize this ap- proach, and make it practical and efficient to apply. During the development phase of a software/system, the system can be described in terms of models. In this way, the system can be developed at component level, and later be integrated as one.  Transformation of Semantic Analysis to Com+ Business Requirements Using MDA Approach Copyright © 2010 SciRes JSSM 69 2.3 Ontology Chart Meta Model Even if UML is well supported, the scope of MDA doesn’t diminish. MDA uses the Meta Object Facility (MOF) to allow any model to have its semantics repre- sented in MOF participating in the MDA process [6]. The OMG [2] suggests four levels of abstraction for the models. Beginning with the actual system M0, moving to a model M1 that describes the specific system, the Meta model of this model is M2 which describes the semantics of the model and can be used for more models and finally, the Meta model of the Meta model that explains the se- mantics of the Meta model. “A metamodel makes state- ments about what can be expressed in the valid models of a certain modeling language”, see [3]. Also in [3] “Given its metamodel representation, we can determine whether a model is valid”. MOF is a model that can be used to define Meta models. This is illustrated by the following example: Given a system that consists of a number of java classes which is used to process loan applications, the actual system is the M0. The class diagram that represents the system for loan applications is the M1. The Meta model that describes class diagrams is the M2. MOF is used to describe the semantics of the Meta model that describes class diagrams. Obviously, there can be more layers between the M2 and MOF but in the real world it does not make much sense because it will in- crease the complexity at the cost of little or no benefit. In the Meta model, as shown in Figure 2 which is re- produced from [7], the surrogate table holds all the in- formation that a node of the Ontology Chart needs to hold. Ades and others [8] have proposed an ontology chart which is claimed to be the most complete. The sort attribute can be either universal or particular, and the type can be agent, affordance, role or communication act. Figure 2. M2 Meta model for ontology chart 3. Semantic Analysis and Com+ SAM is a business analysis method used to capture or- ganisational knowledge and is represented in the form of a number of diagrams known as Ontology Charts. Each of these diagrams consists of nodes with different shapes and their associations. Each node of the ontol- ogy chart can be agent, affordances and determiners [9]. Agents are entities from the real world capable to taking legal responsibility. Usually they are physical or legal persons (organisations). Determiners are attributes of agents or affordances, such as name, address and so on. Affordance stands for everything else. Ontology Charts are limited to binary associations. Each node is onto- logically depended on one or two ancestor node(s) with the “root” node being the only exception. The “root” does not have any ancestor nodes and it is used to set the scope of the system. The “root” would disappear during transformation. Ontologically dependency re- quires that if the ancestor node seizes to exist then the child node would also seize to exist. Another property of the Ontology Charts is that each node has a start and finish time, giving a temporal dimension to the chart. Ontology Charts are capable of reflecting the complete structure of the organization describing the relationship between different entities. COM+ is an approach for developing application pro- grams and is an architectural design standard introduced by Microsoft [10]. The COM+ architecture supports both an object oriented programming and a set of operating system services. It adds a new set of services for applica- tion components while they are running, such as notify- ing them of significant events or ensuring they are au- thorized to run. COM+ is intended to provide a model that makes it relatively easy to create business applica- tions that work well with the Microsoft technologies. Here we produce transformation rules for converting Ontology Chart to COM+ format. These transformations are intended to provide developers with a direct mapping to COM+ application which is a Microsoft standard. 4. Case Study: An Ontology Chart for A Law Firm and Its Transformation 4.1 Law Firm Ontology Chart Consider the following case from a law firm. The “Law Firm” is connected to its dependant “Contacts” and it is again connected to “Client”. That means that if “Law Firm” ceases to exist, “Contacts” would be meaningless and also cease to exist. Also if there is no “Client” the norm “Law Firm” still exists. A “Client” is a “person” that has a “Contact” with “Law Firm” regarding his/her case. Finally an “Employee” has a function to calculate the “hourly rate”. Also the “ Person” has role “Lawyer”  Transformation of Semantic Analysis to Com+ Business Requirements Using MDA Approach Copyright © 2010 SciRes JSSM 70 who is “Employed By” the “ Law Firm”. Figure 3 shows the ontology char for the above case. In the above Ontology Chart, a physical person can be employed by a law firm as a lawyer. This employee has an hourly rate based on his employment contract. A cli- ent contacts the law firm and the law firm assigns a law- yer for this client. 4.2 The Transformation The Key component in MDA is the transformations be- tween models. According to [11], “A transformation lan- guage must provide for complete automation and must be expressive, unambiguous, and Turing complete”. The transformation can be endogenous if the source and the target models have the same Meta model or exogenous if they have a different Meta model. For example the transformation between a class diagram and a more de- tailed class diagram is endogenous where the transforma- tion from use case diagrams to a class diagram is exoge- nous. The transformation does not necessary have to be between a PIM and a PSM. It can also be from a more abstract PIM to a more detailed PIM. For example, use case diagrams can be transformed to sequence diagrams free of technical details, or from a PSM to another PSM (e.g. from EJBs to COM+). The official transformation language of OMG is QVT; however, other transforma- tion languages such as Kermeta or even Java are also available. This mapping will define the transformation rules for Meta models. In order to write the transformation rules, fist of all, we have to identify the key elements in the source model which in our situation are Ontology Charts. So, the key elements on which the transformation rules need to be applied are, a) Agents b) Affordances c) Roles d) Determiners Figure 3. An ontology chart from a law firm Now, after identifying the key elements of the source model now we have to identify what are the potential key elements of the target model which in our situation is COM+. The potential key elements in COM+ are, a) Components b) Interfaces c) Connections (Either Delegate or Assembly) Once the key elements are identified in the source and target model than the most important step is the mapping of each source element to the relevant target element. Before writing the transformations using any transforma- tion language such as Kermeta or QVT, it is important to identify the transformation rules. We present the follow- ing rules for mapping Ontology Chart to COM+: 1) For each surrogate that is of type agent, a COM+ component is generated. For each surrogate determiner, it will become an attribute of that component. 2) For each affordance, an interface will be generated depending on the antecedent or dependent with required or provided interface respectively, depending on whether the generated component requires or provides data. 3) For a type role, a special component that is sub unit of Agent will be created. 4) Roles connected with affordances in Ontology Chart will become a sub-COM+ component Once the key rules are written using normal English Language we can use any transformation language or even plain English to covert the source model in to target model. The result of COM+ is modelled in Figure 4 (Note that the root in Ontology Chart is dropped). The output generated after the transformation is in the form of xmi which is easy to manipulate by transforma- tion languages like Kermeta or even java or C#. 5. Conclusions and Future Work The work in this paper demonstrates as to how an On- tology Chart can be mapped to COM+ based component Figure 4. The result COM+ model  Transformation of Semantic Analysis to Com+ Business Requirements Using MDA Approach Copyright © 2010 SciRes JSSM 71 architecture. Our research has proposed a MOF Meta model for Ontology Chart and its transformation to COM+ diagram. This development would allow business analysts to design their Ontology Charts which can di- rectly be coded without worrying about the loss of qual- ity during the systems development. It should be empha- sized that the key to correct transformation is to define a set of transformation rules accurately. Although the transformation from Ontology Chart to COM+ model has been achieved but still more work needs to be done re- garding the services which are implemented in COM+. REFERENCES [1] BCS, “The challenges of complex it projects,” The report of a working group from The Royal Academy of Engi- neering and The British Computer Society, April 2004. [2] OMG, Meta ObjectFacility (MOF) Specification, Object Management Group, 2003, http://doc.omg.org/formal/02- 04-03. [3] S. Sendall and W. Kozaczynski, “Model transformation: The heart and soul of model-driven software develop- ment, ” IEEE Software, IEEE Computer Society, October 2003. [4] E. Seidewitz, “What models mean,” IEEE Softw, Vol. 20, No. 5, pp. 26–32, September 2003, http://dx.doi.org/10.1109/MS.2003. 1231147. [5] A. Kleppe, J Warmer, and W. Bast, MDA Explained: The Model Driven Architecture(TM): Practice and Promise The Addison-Wesley Object Technology Series, 2000. [6] I. Poernomo, A type theoretic framework for formal metamodelling, in R. Reussner and J. Stafford and C. Szyperski (Eds.), Architecting Systems with Trustworthy Components, Springer, LNCS, Vol. 3930, pp. 262–298, 2006. [7] Y. Ades, N. Karimi Sani, M. Nistazakis, I. Poernomo, G. Tsaramirsis, and M. Yamin “Implementing SNF com- pliant software,” Proceedings of ICISO’09, ISBN: 978-0-9806057-2-3, pp. 71, 2009. [8] Y. Ades, F. Ben-Oman, I. Poernomo, and G. Tsaramirsis, “Mapping ontology charts to class diagrams,” ICOS ’07, 2007. [9] K. Liu, “Semiotics in information systems engineering,” Cambridge University Press, ISBN 0521 593352, Micro- soft, COM+, 2000, http://msdn.microsoft.com/en-us/li- brary/ms685978(VS.85).aspx. [10] OMG, MDA guide version 1.0.1, 2000, www.omg.org/ docs/omg/03-06-01.pdf. [11] R. Stamper, “MEASUR—Methods of theory and analysis of information systems,” Proceedings of IWRA, pp. 135– 160, 2008. |