Paper Menu >>
Journal Menu >>
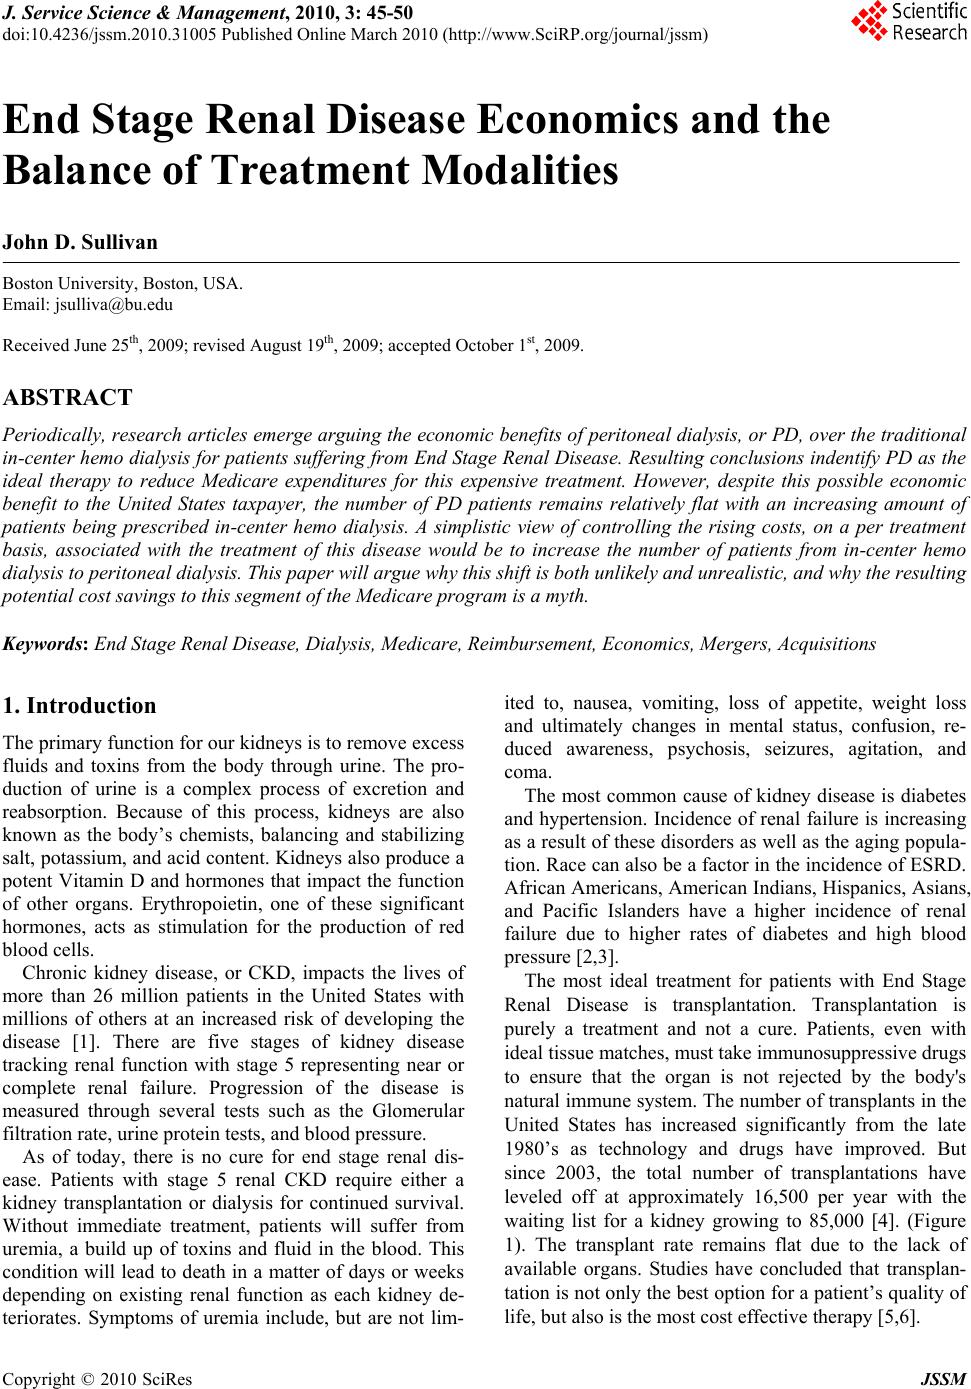 J. Service Science & Management, 2010, 3 : 45 -50 doi:10.4236/jssm.2010.31005 Published Online March 2010 (http://www.SciRP.org/journal/jssm) Copyright © 2010 SciRes JSSM 45 End Stage Renal Disease Economics and the Balance of Treatment Modalities John D. Sullivan Boston University, Boston, USA. Email: jsulliva@bu.edu Received June 25th, 2009; revised August 19th, 2009; accepted October 1st, 2009. ABSTRACT Periodically, research articles emerge arguing the economic b enefits of peritoneal dialysis, or PD, over the traditional in-center hemo dialysis for patients su ffering from End Stage Renal Disease. Resulting conclusion s indentify PD as the ideal therapy to reduce Medicare expenditures for this expensive treatment. However, despite this possible economic benefit to the United States taxpayer, the number of PD patients remains relatively flat with an increasing amount of patients being prescribed in-center hemo dialysis. A simplistic view of controlling the rising costs, on a per treatment basis, associated with the treatment of this disease would be to increase the number of patients from in-center hemo dialysis to peritoneal dialysis. This pap er will ar gue why this shift is both unlikely and unrealistic, an d why the resulting potential cost savings to this segment of the Medicare program is a myth. Keywords: End Stage Renal Disease , Di alysis, Medicare, Reimb urse ment, Economics, Mergers , Acq u i sit i ons 1. Introduction The primary function for our kidneys is to remove excess fluids and toxins from the body through urine. The pro- duction of urine is a complex process of excretion and reabsorption. Because of this process, kidneys are also known as the body’s chemists, balancing and stabilizing salt, potassium, and acid content. Kidneys also produce a potent Vitamin D and hormones that impact the function of other organs. Erythropoietin, one of these significant hormones, acts as stimulation for the production of red blood cells. Chronic kidney disease, or CKD, impacts the lives of more than 26 million patients in the United States with millions of others at an increased risk of developing the disease [1]. There are five stages of kidney disease tracking renal function with stage 5 representing near or complete renal failure. Progression of the disease is measured through several tests such as the Glomerular filtration rate, urine protein tests, and blood pressure. As of today, there is no cure for end stage renal dis- ease. Patients with stage 5 renal CKD require either a kidney transplantation or dialysis for continued survival. Without immediate treatment, patients will suffer from uremia, a build up of toxins and fluid in the blood. This condition will lead to death in a matter of days or weeks depending on existing renal function as each kidney de- teriorates. Symptoms of uremia include, but are not lim- ited to, nausea, vomiting, loss of appetite, weight loss and ultimately changes in mental status, confusion, re- duced awareness, psychosis, seizures, agitation, and coma. The most common cause of kidney disease is diabetes and hypertension. Incidence of renal failure is increasing as a result of these disorders as well as the aging popula- tion. Race can also be a factor in the incidence of ESRD. African Americans, American Indians, Hispanics, Asians, and Pacific Islanders have a higher incidence of renal failure due to higher rates of diabetes and high blood pressure [2 ,3]. The most ideal treatment for patients with End Stage Renal Disease is transplantation. Transplantation is purely a treatment and not a cure. Patients, even with ideal tissue matches, must take immunosuppressive drugs to ensure that the organ is not rejected by the body's natural immune system. The number of transplants in the United States has increased significantly from the late 1980’s as technology and drugs have improved. But since 2003, the total number of transplantations have leveled off at approximately 16,500 per year with the waiting list for a kidney growing to 85,000 [4]. (Figure 1). The transplant rate remains flat due to the lack of available organs. Studies have concluded that transplan- tation is not only the be st option for a patient’s quality of life, but also is the most cost effective therapy [5,6]. 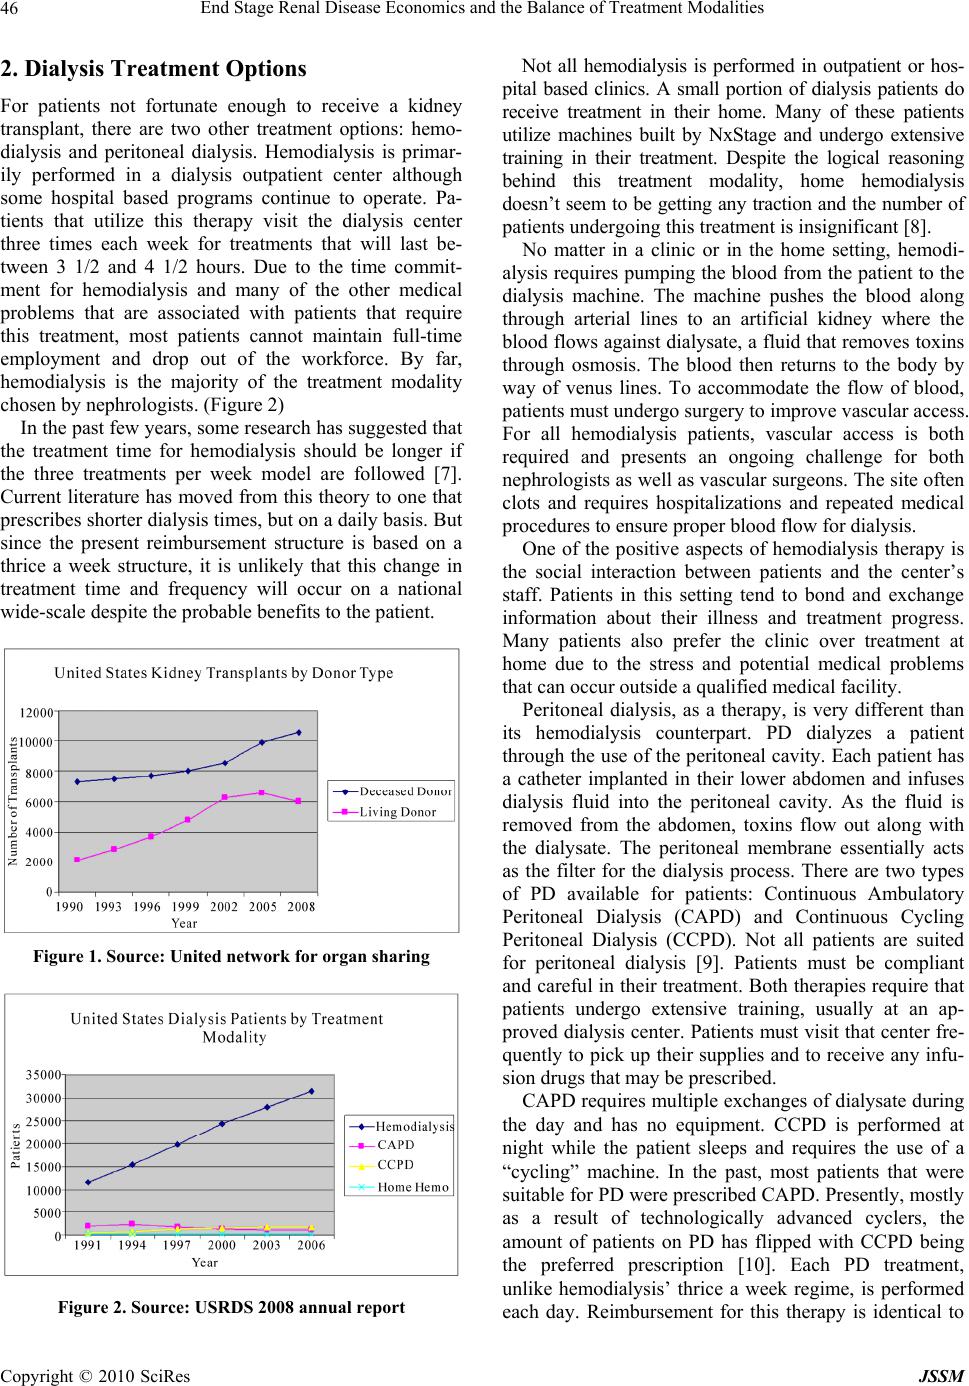 End Stage Renal Disease Economics and the Balance of Treatment Modalities Copyright © 2010 SciRes JSSM 46 2. Dialysis Treatment Options For patients not fortunate enough to receive a kidney transplant, there are two other treatment options: hemo- dialysis and peritoneal dialysis. Hemodialysis is primar- ily performed in a dialysis outpatient center although some hospital based programs continue to operate. Pa- tients that utilize this therapy visit the dialysis center three times each week for treatments that will last be- tween 3 1/2 and 4 1/2 hours. Due to the time commit- ment for hemodialysis and many of the other medical problems that are associated with patients that require this treatment, most patients cannot maintain full-time employment and drop out of the workforce. By far, hemodialysis is the majority of the treatment modality chosen by nephr olo gi st s. (Fi g ure 2) In the past few years, some research has suggested that the treatment time for hemodialysis should be longer if the three treatments per week model are followed [7]. Current literature has moved from this theory to one that prescribes shorter dialysis times, but on a daily basis. But since the present reimbursement structure is based on a thrice a week structure, it is unlikely that this change in treatment time and frequency will occur on a national wide-scale despite the probable benefits to the patient. Figure 1. Source: United network for organ sharing Figure 2. Source: USRDS 2008 annual report Not all hemodialysis is performed in outpatient or hos- pital based clinics. A small portion of dialysis patients do receive treatment in their home. Many of these patients utilize machines built by NxStage and undergo extensive training in their treatment. Despite the logical reasoning behind this treatment modality, home hemodialysis doesn’t seem to be getting any traction and the number of patients undergoing this treatment is insign ifican t [8]. No matter in a clinic or in the home setting, hemodi- alysis requires pumping the blood from the patient to the dialysis machine. The machine pushes the blood along through arterial lines to an artificial kidney where the blood flows against dialysate, a fluid that removes toxins through osmosis. The blood then returns to the body by way of venus lines. To accommodate the flow of blood, patients must undergo surgery to improve vascular access. For all hemodialysis patients, vascular access is both required and presents an ongoing challenge for both nephrologists as well as vascular surgeons. The site often clots and requires hospitalizations and repeated medical procedures to ensure p ro per bl oo d fl o w fo r dialysis. One of the positive aspects of hemodialysis therapy is the social interaction between patients and the center’s staff. Patients in this setting tend to bond and exchange information about their illness and treatment progress. Many patients also prefer the clinic over treatment at home due to the stress and potential medical problems that can occur outside a qualified medical facility. Peritoneal dialysis, as a therapy, is very different than its hemodialysis counterpart. PD dialyzes a patient through the u se of the peritoneal cavity. Each patient has a catheter implanted in their lower abdomen and infuses dialysis fluid into the peritoneal cavity. As the fluid is removed from the abdomen, toxins flow out along with the dialysate. The peritoneal membrane essentially acts as the filter for the dialysis process. There are two types of PD available for patients: Continuous Ambulatory Peritoneal Dialysis (CAPD) and Continuous Cycling Peritoneal Dialysis (CCPD). Not all patients are suited for peritoneal dialysis [9]. Patients must be compliant and careful in their treatment. Both therap ies require that patients undergo extensive training, usually at an ap- proved dialysis center. Patients must visit that center fre- quently to pick up th eir supplies and to receive any infu - sion drugs that may be prescr ibed. CAPD requires multiple exchanges of dialysate during the day and has no equipment. CCPD is performed at night while the patient sleeps and requires the use of a “cycling” machine. In the past, most patients that were suitable for PD were prescribed CAPD . Presen tly, mostl y as a result of technologically advanced cyclers, the amount of patients on PD has flipped with CCPD being the preferred prescription [10]. Each PD treatment, unlike hemodialysis’ thrice a week regime, is performed each day. Reimbursement for this therapy is identical to  End Stage Renal Disease Economics and the Balance of Treatment Modalities Copyright © 2010 SciRes JSSM 47 hemodialysis whereby the same amount is paid for a three treatment week as the PD seven day a week ther- apy. A major advantage for patients that choose PD as their treatment modality is flexibility since trice a week travel is not required for treatment. This would also enforce the shift from CAPD to CCPD given that the therapy is done while the patient sleeps. However, use of the peritoneal membrane as a filter does have its drawbacks for p atients. Most patients, at one time or another, can develop peri- tonitis. This inflammation and infection of the peritoneal cavity is painful and requires patients to convert to hemodialysis while being treated for their infection and many patients cannot convert back to PD. For both therapies, reimbursement is currently based on a basic treatment with additional payments for an- cillary drugs and testing. PD does appear less expen- sive than hemodialysis. From the payment perspective, PD prescriptions for the basic treatment are identical to hemodialysis treatment although individual non-gov- ernment payers may have separate payment structures for each therapy. Although the payment structures for hemodialysis and PD are the same for the basic treat- ment, the difference in cost seems to be ancillary drugs. Patients that are prescribed PD are typically healthier than their hemodialysis counterparts and often don’t require additional drugs to maintain a better quality of life [11]. Peritoneal dialysis patients also tend to pos- sess a greater kidney function that would require less external treatments for such disorders as anemia. Re- search studies conclude that only 20% of PD patients are using EPO for anemia as compared with 80% of hemodialysis patients [12]. 2.1 The End Stage Renal Disease Program In July of 1973, under the direction of the Federal Gov- ernment, health care in the United States changed dra- matically for patients with renal failure. Through Medi- care Part B, virtually every citizen, after an initial wait- ing period, would be entitled to coverage, paid by tax dollars, for this disease regardless of age. The ESRD program has, at times, been hailed as a success story and at other moments in its history, been criticized for the programs growing economic burden and high mor- tality rates. Initial results were difficult to assess because of the slow build up of physicians and clinics to meet the needs of ESRD patients across the country. Initially, the argu- ment behind the program was that treatment options, such as transplan t, would keep the cost of providin g care low. The first year of the life saving treatment cost the government $229 million for approximately 16,000 pa- tients. The current Med icare payment is $20.3 billion for 437, 334 patients [13]. (Figure 3) Figure 3. Source: USRDS 2008 annual report The idea behind dialysis was that it would serve as a model for a universal health care system in the United States. The problem with this theory is that the renal pa- tient community is not an accurate reflection of the mainstream health care needs of the general population. As reflected by the very nature of the constant therapy combined with the numerous hospitalizations, the ESRD program cannot be an example of how universal health care may work. The exploding costs have placed more and more of an economic burden on Medicare consum- ing 6% of the budget for less than 1% of the Medicare population [14]. 2.2 The Dialysis Business Model The dialysis market, from the providers’ side, is basically controlled by two entities: Fresenius Medical Care and DaVita. The combination of these two companies control 82.1% of the top ten providers in the dialysis market [15]. (Figure 4). Other smaller either niche or “mom and pop” clinics control the remaining share along with hospital dialysis based units. For profit clinics dominate the mar- ket and have significantly increased their size over the last fifteen years. (Figure 5) Fresenius and DaVita, by their very business model, are two very distinct companies. Fresenius, or FMC, is a fully integrated co mpany that both provides dialysis care to patients and manufactures the equipment and supplies for that care. FMC is a global health care company with the largest patient base of any provider. By increasing the production of artificial kidneys, or dialyzers, FMC has virtually ended the process of re- processing dialyzers to reduce costs through economies of scale production. Reprocessing dialyzers was a com- mon practice in the 1970’s throug h the 1990’sat first due to the lower ability to manufacture enough dialyzers. As production increased, reuse was purely a means to reduce medical supply costs. Studies are inconclusive as to whether or not reuse impacts the quality of treatment or effects mortality rates. DaVita on the other hand, is a pure dialysis provider  End Stage Renal Disease Economics and the Balance of Treatment Modalities Copyright © 2010 SciRes JSSM 48 Figure 4. Source: Nephrology news and issues july 2009 Figure 5. Source: USRDS 2008 annual report only treating patients in the United States. While not at all of their clinics, many of DaVita’s clinics still reuse patient dialyzers. For patients worried about this practice, DaVita maintains information regarding reuse on their website [16] . Consolidation over the past thirty years has been driven by the in cen tive to cu t costs rather than to increase market share and expand. Dialysis, by its very nature, is a business that requires an infrastructure to support multi- ple clinics with minimum administrative or corporate staff. Mergers and acquisitions add the patient volume and base revenue while administration costs from the target company can be eliminated. The driving force behind this strategy has been Medi- care’s inability or unwillingness to raise the composite rate. With a level reimbursement rate from the majority of the patient population combined with inflationary pressures from the medical labor market, providers were forced to look to this “roll up” strategy to maintain prof- itability. Larger dialysis companies operate at a signifi- cant advantage to their smaller competitors. Expenses can be leveraged through economies of scale, but with stagnant reimbursement from government sources, this advantage can be limited. Thus, leverage in revenue is also critical to their advantage over smaller providers. By controlling larger shares of the market, dialysis chains can leverage payments from commercial insurance pro- viders making up more than the difference from the Medicare and Medicaid shortfall. Outpatient dialysis hemodialysis units are expensive investments with leasehold improvements and equipment ranging from $1.5 to $2.5 million depending on size and location. From a finance perspective, these are large fixed cost businesses [17]. To minimize or leverage these fixed costs, volume of patients is critical to maximize profitability. For profit dialysis centers tend to have higher numbers of patients per unit than non-profit and hospital based units. (Figure 6) Because of the increase in fixed asset investment by dialysis companies, there may be an incentive to push towards flowing the volume of patients from a PD ther- apy to hemodialysis. Adding to this pressure of sending renal patients to clinics is the emerging structure within the small to medium size dialysis companies. To motivate younger nephrologists or perhaps to give older physi- cians the ability to div est a portion of their investment in a dialysis business, these smaller dialysis companies, many supported by private equity investment dollars, is to offer a joint venture arrangement with the nephrologist. Whether a de novo unit or an existing clinic, the physi- cian will have an incentive to prescribe hemodialysis over PD to drive volume and fully leverage their large fixed asset investment. PD, by its very nature, is a variable cost treatment without the overhead required in a sophisticated outpa- tient clinic. Labor costs do exist, but are far less utilized as patients usually only visit the clinic once a month to pick up supplies and drop off blood samples. Variable costs for PD patients are a different story. Because PD patients dialyze seven days a week, medical supply costs are significantly higher than in-center hemodialysis pa- tients. The difference in cost experienced by the payer is attributable to the lower amount of prescription drugs. If PD is indeed a lower cost with similar revenue streams as in-center hemodialysis patients, why is the industry so reluctant to embrace this therapy? The overwhelming majority of the market is controlled by Figure 6. Source: USRDS 2008 annual report  End Stage Renal Disease Economics and the Balance of Treatment Modalities Copyright © 2010 SciRes JSSM 49 for-profit entities with the top two being publicly traded. Small to mid size other players are backed by private equity firms responsible to their investors. Peritoneal dialysis may be the lowest cost from the payers’ perspec- tive, but is it the most profitable to the providers? With the immense pressure from Wall Street and Private Eq- uity Firms for high returns, it at least appears that the significant factor to profitability for dialysis co mpanies is ancillary drugs and not the basic dialysis treatment. Oth- erwise, capital resources would be directed to invest in areas with the highest potential return. This theory may be complimented by the number of nephrologists that believe in the effectiveness of peritoneal dialysis [18]. Regardless of motive, the simple fact is that the level of PD patients continues to be flat while the in-center hemodialysis patient population is growing [19]. 3. Current and Future Reimbursement Structure for Dialysis The renal community is on the edge of a monumental change in reimbursement by the federal government. The present system is based on a fee for service with addi- tional charges for drugs and medical tests. The new payment structure would entail a “bundled” rate. This rate would be inclusive of both the dialysis treatment and any additional drugs the patient may require. The Medi- care Improvements for Patients and Providers Act of 2008, passed on July 15 and survived a veto from Presi- dent Bush, requires this new bundled system to be in place for ESRD by 2011. Bundled rate systems are not new to renal providers. Prior to the invention of Amgen’s anemia drug, Epogen in 1989, the Medicare composite rate was essentially a “bundled payment” covering nearly all the costs of pro- viding care to patients. Some commercial insurance companies have already moved to a bundled reimburse- ment as a means to control costs and simplify the billing process. The reasoning behind this change is likely to control costs associated with additional necessary drugs while creating a high quality environment thorough quality measures in outcomes to ensure that care isn’t being re- duced under bundling to secure higher profitability [20]. The problem with this approach is that it does not take into account adverse consequences such as providers pushing patients that are non-compliant into competing clinics. Nor does the plan specify how small and medium providers will afford to invest in the systems necessary to gather and analyze this da ta. Implementation for this program will start regionally and as it is tested, be rolled out on a nationwide basis. Obviously, geographical areas will play a key role in the reimbursement rate based on the cost of living. It may be likely that adjustments to th e bundle would occur as data is collected similar to Medicare’s first implementation of the ESRD program in 1973. A report will be issued dur- ing the summer of 2009 with more details alth ough much hasn’t been disclosed by way of bundled reimbursement by modality. The question that remains regarding this new structure is what the goals of Med icare will be b eyond maintainin g a quality program? If it is to ensure profitability for pro- viders, even slightly beyond break-even, Medicare will be forced to increase what they’re currently paying for these services [21]. Thus, the bundled rate will likely be very similar to the current reimbursement. 4. Conclusions The majority of dialysis that is performed in the United States is conducted under the high fixed-cost outpatient dialysis units. Despite significant improvements in the delivery of PD therapy, the numbers of patients utilizing either CAPD or CCPD remains flat as the total renal failure population experiences consistent growth. This is primarily due to the high fixed cost infrastructu re already in place, which many physicians don’t believe that their patients are suitable for PD, and many nephrologists un- willingness to prescribe PD for treatment. If profitability is the goal of most providers, it would appear that in-center patients, as long as the center is at a high utili- zation, are more profitable than at home hemodialysis or PD patients. Otherwise peritoneal dialysis would be em- phasized as an alternative therapy and the rate of utiliza- tion would at least grow at the rate of the incidence of renal failure. From the payers’ perspective, peritoneal dialysis treatment is more cost effective th an traditional in-center and home hemodialysis. However, in the current clinical and economic environment, any shift in treatment modal- ity seems unlikely. The pressure from investors, includ- ing physicians, emphasizes a volume in-center treatment model that maximizes financial returns. With the aging population combined with higher incidence rates of dia- betes and hypertension, the overall cost of the ESRD program will continue to consume a greater portion of the Medicare budget. REFERENCES [1] National Kidney Foundation. Chronic kidney Disease (CKD), The facts about chronic kidney disease (CKD), May 26, 2009, http://www.kidney.org/kidneydisease/ckd/index.cfm. [2] N. Tareen, et al., “Chronic kidney disease in African American and Mexican American populations,” Kidney International, No. 68, pp. S137–S140, 2005. [3] N. Burrows, Y. Li, and D. Williams, “Racial and ethnic differences in trends of end stage renal disease: United States 1995 to 2005,” Advances in Chronic Kidney Dis-  End Stage Renal Disease Economics and the Balance of Treatment Modalities Copyright © 2010 SciRes JSSM 50 ease, Vol. 15, No. 2, pp. 147–152. [4] United Network for Organ Sharing, View Data Reports, National Data, Transplants by Donor Type, Kidney, May 25, 2009, http://optn.transplant.hrsa.gov/latestData/rptData.asp. [5] K. Howard, et al., “The cost effectiveness of increasing kidney transplantation and home based dialysis,” Ne- phrology, Vol. 14, No. 1, pp. 123–132, 2009. [6] E. Yen, et al., “Cost effectiveness of extending Medicare coverage of immunosuppressive medications to the life of a kidney transplant,” American Journal of Transplantation, Vol. 4, No. 10, pp. 1703–1708, 2004. [7] R. Saran, et al., “Longer treatment time and slower ul- trafiltration in hemodialysis: Associations with reduced mortality in the DOPPS,” Kidney International, Vol. 69 No. 7, pp. 1222–1228, April 2006. [8] United States Renal Data System 2008 Annual Report. [9] J. D. Sullivan, “Making peritoneal dialysis and home hemodialysis more economically viable,” Nephrology News and Issues and Issues, pp. 54–58, July 2006. [10] United States Renal Data System Annual Data Report, Chapter 2, Incidence and Prevalence, 2008, http://www. USRDS.org. [11] F. Coronel, et al., “Erythropoietin requirements: a com- parative multicenter study between peritoneal dialysis and hemodialysis,” Journal of Nephrology, Vol. 16, No. 5, pp. 697–702, September–October, 2006. [12] J. J. Snyder, R. N. Foley , D. T. Gilberston, E. F. Vonesh, and A. J. Collins, “Hemoglobin levels and erythropoietin doses in hemodialysis and peritoneal dialysis patients in the United States,” Journal of the American Society of Nephrology, Vol. 15, No. 1, pp. 174–179, 2004. [13] United States Renal Data System Annual Data Report, Section K, The Economic Costs of ESRD, pp. 292, 2008, http://www.USRDS.org. [14] 1999 HCFA statistics. Baltimore, Health Care Financing Administration, April 2000, (HCFA publication no. 03421). [15] Nephrology News and Issues, July 2009. [16] http://www.davita.com/dialysis/treatment/a/1867. [17] J. D. Sullivan, “Making peritoneal dialysis and home hemodialysis more economically viable,” Nephrology News and Issues, pp. 54–58, July 2006. [18] http://www.aakp.org/aakp-library/Fewer-Patients-Periton eal-Dialysis/. [19] United States Renal Data System, 2008 Annual Report [20] J. Sullivan, “Bundling and its potential impact on dialysis service providers,” Nephrology News and Issues, October 2008. [21] J. D. Sullivan, “Bundling and its potential impact on di- alysis service providers,” Nephrology News and Issues, October 2008. |