 Vol.2, No.3, 211-224 (2010) doi:10.4236/health.2010.23031 Copyright © 2010 SciRes Openly accessible at http://www.scirp.org/journal/HEALTH/ Health Employing fuzzy logic in the diagnosis of a clinical case G. Licata Dipartimento FIERI, University of Palermo, Viale delle Scienze, Palermo, Italy; ninnilicata@yahoo.it Received 20 October 2009; revised 9 December 2009; accepted 14 December 2009. ABSTRACT Fuzzy logic is a logical calculus which operates with many truth values (while classical logic works with the two values of true and false). Since fuzzy logic considers the truth of scien- tific statements like something softened, it is fruitfully applied to the study of biological phe- nomena, biology is indeed considered the field of complexity, uncertainty and vagueness. In this paper fuzzy logic is successfully applied to the clinical diagnosis of a patient who suffers from different diseases bound by a complex causal chain. In this work it is presented a mathematical foundation of fuzzy logic (with connectives and inference rules) and then the application of fuzzy reasoning to the study of a clinical case. Probabilistic logic is widely con- sidered the unique logical calculus useful in clinical diagnosis, thus the usefulness of fuzzy logic and its relation with probabilistic logic is here explored. The presentation of the case is supplied with all the features necessary to affect a clinical diagnosis: physical exam, anamnesis and tests. Keywords: Fuzzy Logic; Probabilistic Logic; Clini- cal Diagnosis; Biological Phenomena; Truth 1. INTRODUCTION In this work fuzzy logic was applied to clinical diagnosis. Fuzzy logic is a multi-valued logic, i.e. a logic which works with many (finite or infinite) truth-values. Differ- ently from classical logic, which works with two truth- values (true or false, 1 or 0), fuzzy logic allows for de- grees of truth. Fuzzy logic considers the truth of scientific statements like something softened, then it is fruitfully applied to the study of biological phenomena because biology and medicine are considered the field of com- plexity, uncertainty and vagueness. Fuzzy logic empha- sizes the precision of clinical data: it includes scalar quantities in the argumentations, providing conclusions which give partial truth in results. This means that fuzzy diagnosis, achieving the quantitative precision of clinical signs, symptoms and laboratory tests, is capable to show the vagueness of diagnostic argumentations. Classical logic derives from absolutely true premises absolutely true conclusions, but in the whole science the absolute truth is an illusion: human science always works with uncertainty. In medicine, and in particular in medical practice, this problem is quite evident. Fuzzy and prob- abilistic logic treats vagueness and uncertainty, but nowadays only probabilistic logic is employed in clinical diagnosis. The central aim of this work is to demonstrate that fuzzy diagnosis may be an improvement and a comple- tion of probabilistic diagnosis. Fuzzy logic, differently from classical logic, not only shows the uncertainty in the argu- mentations, but also measures it; and, differently from probabilistic logic, treats a kind of uncertainty which prob- ability does not consider. Many scholars are persuaded by the work of de Finetti [1] that only one kind of mathe- matical method is needed to treat uncertainty: probabil- istic logic. If that was the case fuzzy logic would be not necessary. On the other hand, Kosko argues that prob- abilistic logic is a sub-theory of fuzzy logic, and that probability handles only one kind of uncertainty. He also claims to have proven a derivation of Bayes’ theorem from the concept of fuzzy ‘subsethood’ [2]. Zadeh, the creator of fuzzy logic, argues that fuzzy logic is different in char- acter from probability, and it is not a substitute of prob- abilistic logic. Which is the relation between fuzzy and probabilistic logic? The clinical diagnosis is a good field to look for the answer. A lot of clinical phenomena, symptoms, signs and laboratory tests are quantitative; whether their quantity is wholly scalar, as in the case of lab test, or whether it is determinable only by linguistic adjectives, as in the case of symptoms, there is however a great advantage in the use of fuzzy logic. In the “Methods” section of this work it was furnished a mathematical-logic formulation of fuzzy logic and of fuzzy set theory. In the “Results” sec- tion fuzzy logic was applied to a real clinical case. 2. METHODS: ELEMENTS OF FUZZY LOGIC 2.1. Set Theory A set is a collection of objects which satisfies one particular condition. The objects contained in the set are called  G. Licata / HEALTH 2 (2010) 211-224 Copyright © 2010 SciRes Openly accessible at http://www.scirp.org/journal/HEALTH/ 212 “elements” of the set. The elements of a set can also be sets. The term “set” is not defined: it is sufficient to give an intuitive exposition of set theory. Following a usual symbolization, the sets are denoted with capital letters A, B, X, Y, and the elements of the sets with miniscule letters a, b, x, y, To denote that a is an element of A, it is used a A (1) To denote that a is not an element of A, it is used a A (2) To denote that A is the set which has as elements a, b, c, it is used A = {a, b, c, …} (3) Definition 1. For two sets A and B, if each element of A is an element of B, then A is a subset of B: A B or B A (4) To denote that A is not a subset of B, it is used A B (5) Definition 2. For two sets A and B, A B shall denote the set constituted by the elements which belong to A or to B. The set A B is called the “union of A and B”. Definition 3. For two sets A and B, A B shall denote the set constituted by the elements which belong to A and to B. The set A B is called the “intersection of A and B”. Definition 4. For two sets A and B, a function f of A in B is a law which associates to each element of A an element of B. To denote this function it is used f: A → B. An “indicator function” or a “characteristic function” is a function defined on a set X that indicates the mem- bership of an element x in a subset A of X. The indicator function of a subset A of a set X is a function 1A: X→ {0,1} defined as 1 if x A 1 A(x) = 0 if x A 2.2. Fuzzy Set The fuzzy set theory is an extension of classical set theory. As the classical sets are used in classical two-valued logic, fuzzy sets are used in fuzzy logic. In classical set theory the membership of elements in relation to a set is assessed in binary terms according to a crisp condition: an element either belongs (1, true) or does not belong (0, false) to the set. By contrast, fuzzy set theory permits a gradual membership of the elements in relation to a set. This fact is described with the aid of a membership function μ→[0,1]. The membership function of a fuzzy set is a generalization of the indicator function of classical sets. In fuzzy logic, it represents the degree of truth as an ex- tension of valuation. For any crisp set X, a membership function on X is any function from X to the real unit in- terval [0, 1]. Membership functions on a crisp set X rep- resent fuzzy subsets of X. It is remarkable that fuzzy sets are defined as subsets of a classical set; this is the reason why the fuzzy set theory is considered an extension of classical set theory. The membership function represent- ing a fuzzy set is usually denoted by μÃ. For an element x of X, the value μà (x) is called the membership degree of x to the fuzzy set Ã, which is a subset of X. The membership degree μà (x) quantifies the grade of membership of the element x to the fuzzy set Ã. The value 0 means that x is not a member of the fuzzy set; the value 1 means that x is fully a member of the fuzzy set. The values between 0 and 1 characterize members which belong to the fuzzy set only partially. Usually membership functions with values in [0, 1] are called [0, 1]-valued membership functions. In Figure 1, the function μà (x) of an element of the fuzzy subset à of X is represented by the curved line, while the function μA (x) of an element of the crisp subset A of X is represented by the broken line. For A X à 2.3. Fuzzy Logic Fuzzy logic, derived from fuzzy set theory, is an useful calculus which represents a reasoning that is approximate rather than precisely deduced as in classical predicate or propositional logic. It can be thought of as the application side of fuzzy set theory dealing with well thought out real world. Fuzzy logic admits set membership values to range (inclusively) between 0 and 1, and, in its linguistic form, admits imprecise concepts like “slightly”, “enough”, “very”, “not completely” and so on. 2.3.1. Connectives As the classical logic, but differently from probabilistic logic, fuzzy logic is truth-functional. The AND (), OR (), and NOT () operators of classical logic exist also in fuzzy logic; they are usually defined as the minimum, maximum, and complement. When they are defined in this way they are called “Zadeh operators”, indeed they were Figure 1. The function μà (x) of an element of the fuzzy subset à of X is represented by the curved line, the function μA (x) of an element of the crisp subset A of X is represented by the broken line.  G. Licata / HEALTH 2 (2010) 211-224 Copyright © 2010 SciRes http://www.scirp.org/journal/HEALTH/Openly accessible at 213 first defined in Zadeh’s original papers. The most important posed in the past for fuzzy logic, such as those of Sugeno [3], Dubois and Prade [4] and Yager [5]. Each of these provides a way to vary the “gain” on the function so that it can be very restrictive or very permissive. Here I follow the Gödel T-norm (min) and Gödel T-conorm (max) as defined in Hajek [6]. thing to understand about fuzzy logical reasoning is the fact that it is a superset of standard Boolean logic. If we keep the fuzzy values at their extremes of 1 (completely true), and 0 (completely false), the laws of classical logic will be valid. Consider, for example, the truth tables of classical logic (Figure 2). 2.3.2. Fuzzy Implication: If-Then Rules Knowing that in fuzzy logic the truth of any sentence is a matter of degree, these truth tables must be defined through others connectives. Input values can be real numbers be- tween 0 and 1. One function which will preserve the results of the AND truth table (for example) and also extend to all real numbers between 0 and 1 is the min operation. This operation resolves the sentence A AND B, where A and B are limited to the range (0, 1), by using the function min (A, B). Using the same reasoning, it is possible to replace the OR operation with the max function, so the sentence A OR B, where A and B are limited to the range (0, 1), becomes equivalent to max (A, B). Finally, the operation NOT A becomes equivalent to the operation 1 A. The truth function of negation has to be non-increasing (and assign 0 to 1 and vice versa); the function 1 − A (Łukasiewicz ne- gation) is the best known candidate. Let’s consider Figure 3: the truth table in Figure 2 is completely unchanged by this substitution. Fuzzy sets are the subjects and predicates of fuzzy logic. The If-Then rule statements are used to formulate the conditional statements that comprise fuzzy logic. A single fuzzy If-Then rule assumes the canonical form 1) if x is A then y is B or, in fuzzy propositional logic, 2) if p then q In 1) A and B are linguistic values defined by fuzzy sets on the ranges (universes of discourse) X and Y, re- spectively. The if-part of the rule, “x is A” (or p), is called the antecedent or premise, while the then-part of the rule, “y is B” (or q), is called the consequent or conclusion. An example of such a rule might be. If service is good then tip is average. The adjective good can be represented as a number between 0 and 1, thus the antecedent is an interpretation that gives a single number between 0 and 1. The adjective average is represented as a fuzzy set, and so the conse- quent is an assignment that assigns the entire fuzzy set B to the output variable y. In the If-Then rule, the word “is” is used in two entirely different ways depending on whether it appears in the antecedent or the consequent. In general, the input of an If-Then rule is the current value for the input variable (in this case, service), while the With these three functions it is possible to resolve any construction using fuzzy sets and the fuzzy logical op- erations AND, OR, and NOT. Clearly, it is only defined here one particular correspondence between two-valued and multi-valued logical operations for AND, OR, and NOT. This correspondence is not unique. Not only min and ma x but several kind of connectives have been pro- Figure 2. Truth tables of classical logic. Figure 3. Truth tables of fuzzy logic.  G. Licata / HEALTH 2 (2010) 211-224 Copyright © 2010 SciRes Openly accessible at http://www.scirp.org/journal/HEALTH/ 214 output is an entire fuzzy set (in this case, average). This set will later be “defuzzyfied”, assigning a numerical value to the output. The defuzzyfication is the process of producing a numerical result in fuzzy logic. Typically, a fuzzy system will have a number of tables of conversion that transform some variables (scalar or linguistic) into numerical results: the result is described in terms of membership into fuzzy sets. Interpreting an If-Then rule involves distinct parts: first evaluating the antecedent (which involves fuzzyfying the input variable and then defuzzyfying it), second applying that result to the con- sequent (implication). In the case of two-valued or clas- sical logic, If-Then rules don’t present difficulty. If the premise is true, then the conclusion is true. If we relax the restrictions of two-valued logic and assume that the an- tecedent is a fuzzy statement, this shall reflect on the conclusion. If the antecedent is true to some degree of membership, then the consequent is also true to that same degree. In other words: Classical logic p q (p and q are either true or false) Fuzzy logic 0.5 p 0.5 q (partial antecedents provide partial implication) The antecedent of a rule can have multiple parts, for example: if sky is gray and wind is strong and barometer is fal- ling, then... All parts of the antecedent must be defuzzyfied, cal- culated simultaneously and resolved to a single number using the logical operators described in the preceding section. The consequent of a rule can also have multiple parts. For example: if temperature is cold then hot water valve is open and cold water valve is closed. The consequent is affected by the antecedent and all consequents are affected equally by the result of the an- tecedent. The consequent assigns a fuzzy set to the output, then the implication function modifies that fuzzy set to the degree specified by the antecedent. The If-Then rules which were used in the case report (Section 3) gave to (all parts of the) the consequent the same fuzzy value which was given to the antecedent. Using the If-Then rules is a four-part process: 1) Fuzzifycation of variables: Provide tables of con- version that transform some variables (scalar or linguistic) into fuzzy sets, the tables show that the degree of mem- bership to the fuzzy set correspond to numerical values between 0 and 1 (0 and 100%). 2) Defuzzifycation: Resolve all fuzzy statements in the antecedent giving a precise degree of membership be- tween 0 and 1 (0 and 100%) to each part. If there is only one part into the antecedent, this is the degree of support for the rule. 3) Apply fuzzy operators to multiple part antecedents: If there are multiple parts in the antecedent, apply fuzzy logic operators (connectives) and resolve the antecedent to a single number between 0 and 1. This is the degree of support for the rule. 4) Apply implication method: Use the degree of sup- port for the entire rule to shape the output fuzzy set. The consequent of a fuzzy rule assigns an entire fuzzy set to the output. If the antecedent is only partially true, (i.e., is assigned a value less than 1), then the output fuzzy set is truncated according to the implication method. The general structure of the If-Then rules, with their modifications with connectives, is: if p * p’ then q * q’ where * denotes the binary operations of conjunction and disjunction. The inference rule that was used in the case report (Section 3) to provide the If-Then statements is the generalized modus ponens (GMP), which has the form: ((p q) p’) q’ where p’ is always a quantitative modification of p and q’ is always a quantitative modification of q (through the degree of membership). This rule allows quantitative implications as p q 0.60 p 0.60 q 3. RESULTS: CASE REPORT Maria C., a 67-years-old white woman, was admitted to our unit because of dyspnoea, fatigue, leg oedema and abdominal enlargement. The patient was quite well until two weeks ago, when she complained of increasing weakness, abdominal en- largement and foot enlargement. Moreover, she felt in- creasingly tired and suffered breathing difficulties, in particular after physical activity or at the end of the day. Physical exam: on admission the patient was pale and dyspnoeic at rest. On clinical examination the patient had leg oedema and ascites. Blood Pressure 160/80 mm/Hg Breathing rate Hyperpnoea: 22 cycle/min Heart Rate 140 b/min Weight 68.8 Kg Heart Percussion of heart area estimate enlargement of heart size. Normal heart sounds with systolic heart murmur 3/6 Levine. Tachycardia and arrhythmias. Thorax Reduced chest expansibility during inspiration and expiration. An abolished fremitus on the right pulmonary base and a reduced fremitus on the other part of the right chest. The chest percussion reveals the absence of the “clear lung sound”. On auscul- tation of the chest the normal breathing is impaired and is revealed the presence of rales on the right part of the chest and on the medium-basal left part of the chest. 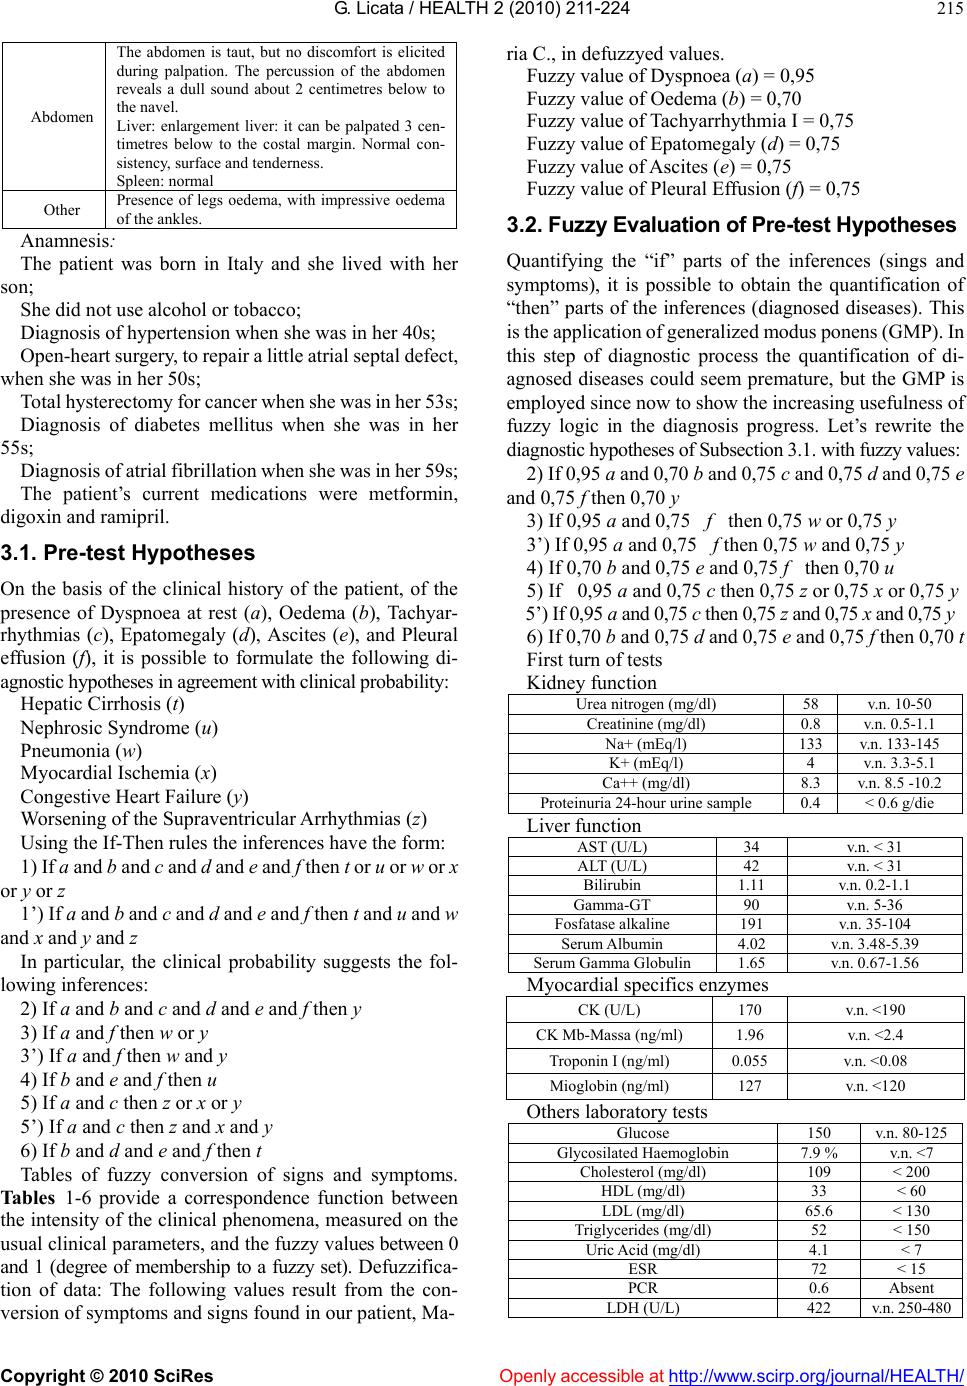 G. Licata / HEALTH 2 (2010) 211-224 Copyright © 2010 SciRes Openly accessible at http://www.scirp.org/journal/HEALTH/ 215 Abdomen The abdomen is taut, but no discomfort is elicited during palpation. The percussion of the abdomen reveals a dull sound about 2 centimetres below to the navel. Liver: enlargement liver: it can be palpated 3 cen- timetres below to the costal margin. Normal con- sistency, surface and tenderness. Spleen: normal Other Presence of legs oedema, with impressive oedema of the ankles. Anamnesis: The patient was born in Italy and she lived with her son; She did not use alcohol or tobacco; Diagnosis of hypertension when she was in her 40s; Open-heart surgery, to repair a little atrial septal defect, when she was in her 50s; Total hysterectomy for cancer when she was in her 53s; Diagnosis of diabetes mellitus when she was in her 55s; Diagnosis of atrial fibrillation when she was in her 59s; The patient’s current medications were metformin, digoxin and ramipril. 3.1. Pre-test Hypotheses On the basis of the clinical history of the patient, of the presence of Dyspnoea at rest (a), Oedema (b), Tachyar- rhythmias (c), Epatomegaly (d), Ascites (e), and Pleural effusion (f), it is possible to formulate the following di- agnostic hypotheses in agreement with clinical probability: Hepatic Cirrhosis (t) Nephrosic Syndrome (u) Pneumonia (w) Myocardial Ischemia (x) Congestive Heart Failure (y) Worsening of the Supraventricular Arrhythmias (z) Using the If-Then rules the inferences have the form: 1) If a and b and c and d and e and f then t or u or w or x or y or z 1’) If a and b and c and d and e and f then t and u and w and x and y and z In particular, the clinical probability suggests the fol- lowing inferences: 2) If a and b and c and d and e and f then y 3) If a and f then w or y 3’) If a and f then w and y 4) If b and e and f then u 5) If a and c then z or x or y 5’) If a and c then z and x and y 6) If b and d and e and f then t Tables of fuzzy conversion of signs and symptoms. Tables 1-6 provide a correspondence function between the intensity of the clinical phenomena, measured on the usual clinical parameters, and the fuzzy values between 0 and 1 (degree of membership to a fuzzy set). Defuzzifica- tion of data: The following values result from the con- version of symptoms and signs found in our patient, Ma- ria C., in defuzzyed values. Fuzzy value of Dyspnoea (a) = 0,95 Fuzzy value of Oedema (b) = 0,70 Fuzzy value of Tachyarrhythmia I = 0,75 Fuzzy value of Epatomegaly (d) = 0,75 Fuzzy value of Ascites (e) = 0,75 Fuzzy value of Pleural Effusion (f) = 0,75 3.2. Fuzzy Evaluation of Pre-test Hypotheses Quantifying the “if” parts of the inferences (sings and symptoms), it is possible to obtain the quantification of “then” parts of the inferences (diagnosed diseases). This is the application of generalized modus ponens (GMP). In this step of diagnostic process the quantification of di- agnosed diseases could seem premature, but the GMP is employed since now to show the increasing usefulness of fuzzy logic in the diagnosis progress. Let’s rewrite the diagnostic hypotheses of Subsection 3.1. with fuzzy values: 2) If 0,95 a and 0,70 b and 0,75 c and 0,75 d and 0,75 e and 0,75 f then 0,70 y 3) If 0,95 a and 0,75 f then 0,75 w or 0,75 y 3’) If 0,95 a and 0,75 f then 0,75 w and 0,75 y 4) If 0,70 b and 0,75 e and 0,75 f then 0,70 u 5) If 0,95 a and 0,75 c then 0,75 z or 0,75 x or 0,75 y 5’) If 0,95 a and 0,75 c then 0,75 z and 0,75 x and 0,75 y 6) If 0,70 b and 0,75 d and 0,75 e and 0,75 f then 0,70 t First turn of tests Kidney function Urea nitrogen (mg/dl) 58 v.n. 10-50 Creatinine (mg/dl) 0.8 v.n. 0.5-1.1 Na+ (mEq/l) 133 v.n. 133-145 K+ (mEq/l) 4 v.n. 3.3-5.1 Ca++ (mg/dl) 8.3 v.n. 8.5 -10.2 Proteinuria 24-hour urine sample 0.4 < 0.6 g/die Liver function AST (U/L) 34 v.n. < 31 ALT (U/L) 42 v.n. < 31 Bilirubin 1.11 v.n. 0.2-1.1 Gamma-GT 90 v.n. 5-36 Fosfatase alkaline 191 v.n. 35-104 Serum Albumin 4.02 v.n. 3.48-5.39 Serum Gamma Globulin 1.65 v.n. 0.67-1.56 Myocardial specifics enzymes CK (U/L) 170 v.n. <190 CK Mb-Massa (ng/ml) 1.96 v.n. <2.4 Troponin I (ng/ml) 0.055 v.n. <0.08 Mioglobin (ng/ml) 127 v.n. <120 Others laboratory tests Glucose 150 v.n. 80-125 Glycosilated Haemoglobin 7.9 % v.n. <7 Cholesterol (mg/dl) 109 < 200 HDL (mg/dl) 33 < 60 LDL (mg/dl) 65.6 < 130 Triglycerides (mg/dl) 52 < 150 Uric Acid (mg/dl) 4.1 < 7 ESR 72 < 15 PCR 0.6 Absent LDH (U/L) 422 v.n. 250-480 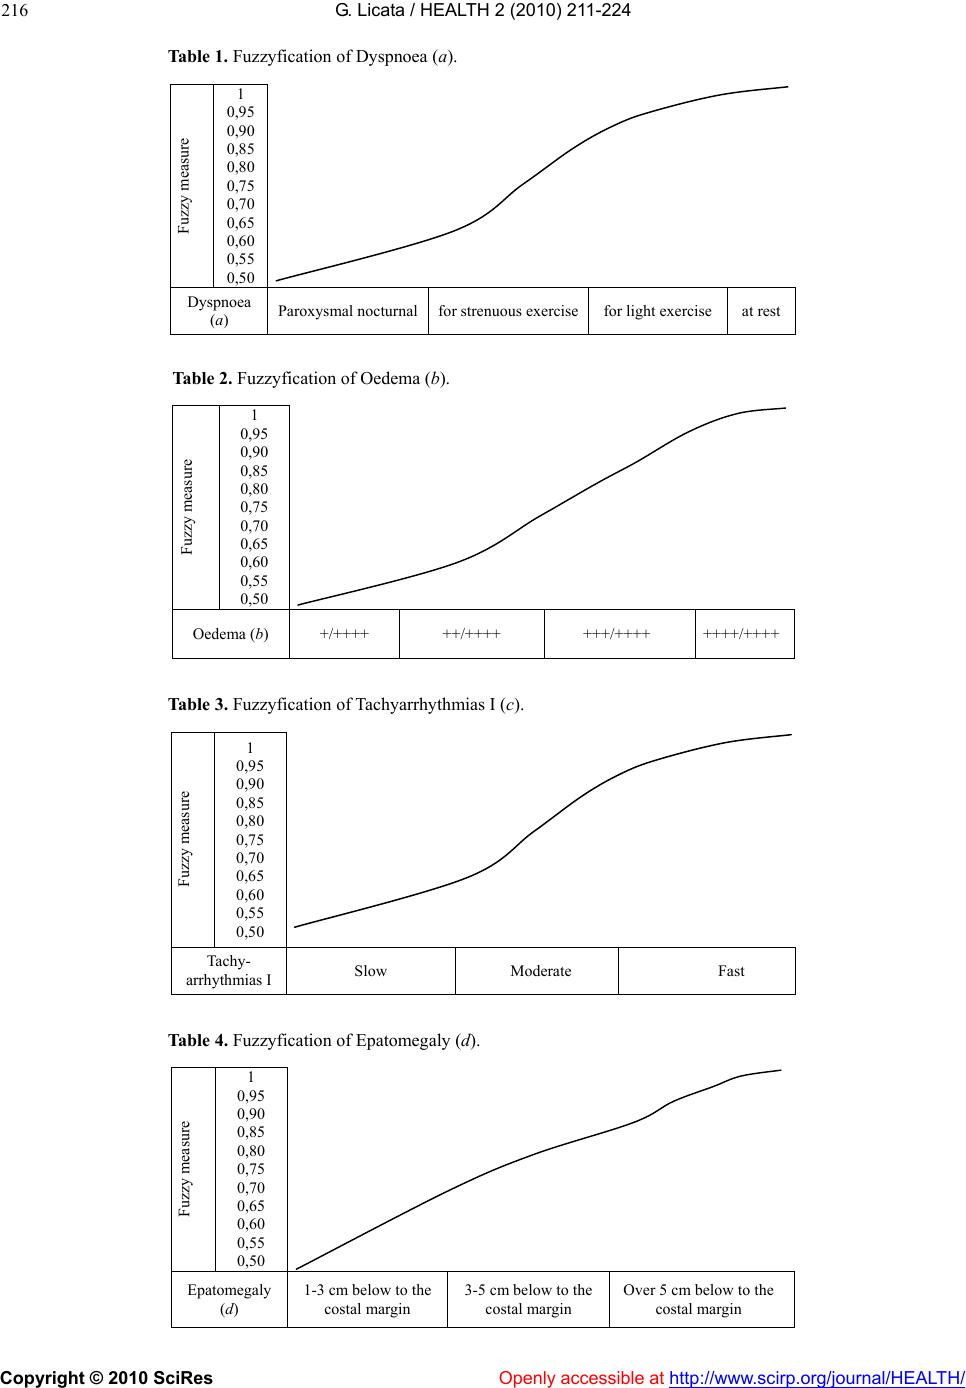 G. Licata / HEALTH 2 (2010) 211-224 Copyright © 2010 SciRes http://www.scirp.org/journal/HEALTH/ 216 Table 1. Fuzzyfication of Dyspnoea (a). Fuzzy measure 1 0,95 0,90 0,85 0,80 0,75 0,70 0,65 0,60 0,55 0,50 Dyspnoea (a) Paroxysmal nocturnalfor strenuous exercisefor light exerciseat rest Table 2. Fuzzyfication of Oedema (b). Fuzzy measure 1 0,95 0,90 0,85 0,80 0,75 0,70 0,65 0,60 0,55 0,50 Oedema (b) +/++++ ++/++++ +++/++++ ++++/++++ Table 3. Fuzzyfication of Tachyarrhythmias I (c). Fuzzy measure 1 0,95 0,90 0,85 0,80 0,75 0,70 0,65 0,60 0,55 0,50 Tachy- arrhythmias I Slow Moderate Fast Table 4. Fuzzyfication of Epatomegaly (d). Fuzzy measure 1 0,95 0,90 0,85 0,80 0,75 0,70 0,65 0,60 0,55 0,50 Epatomegaly (d) 1-3 cm below to the costal margin 3-5 cm below to the costal margin Over 5 cm below to the costal margin Openly accessible at 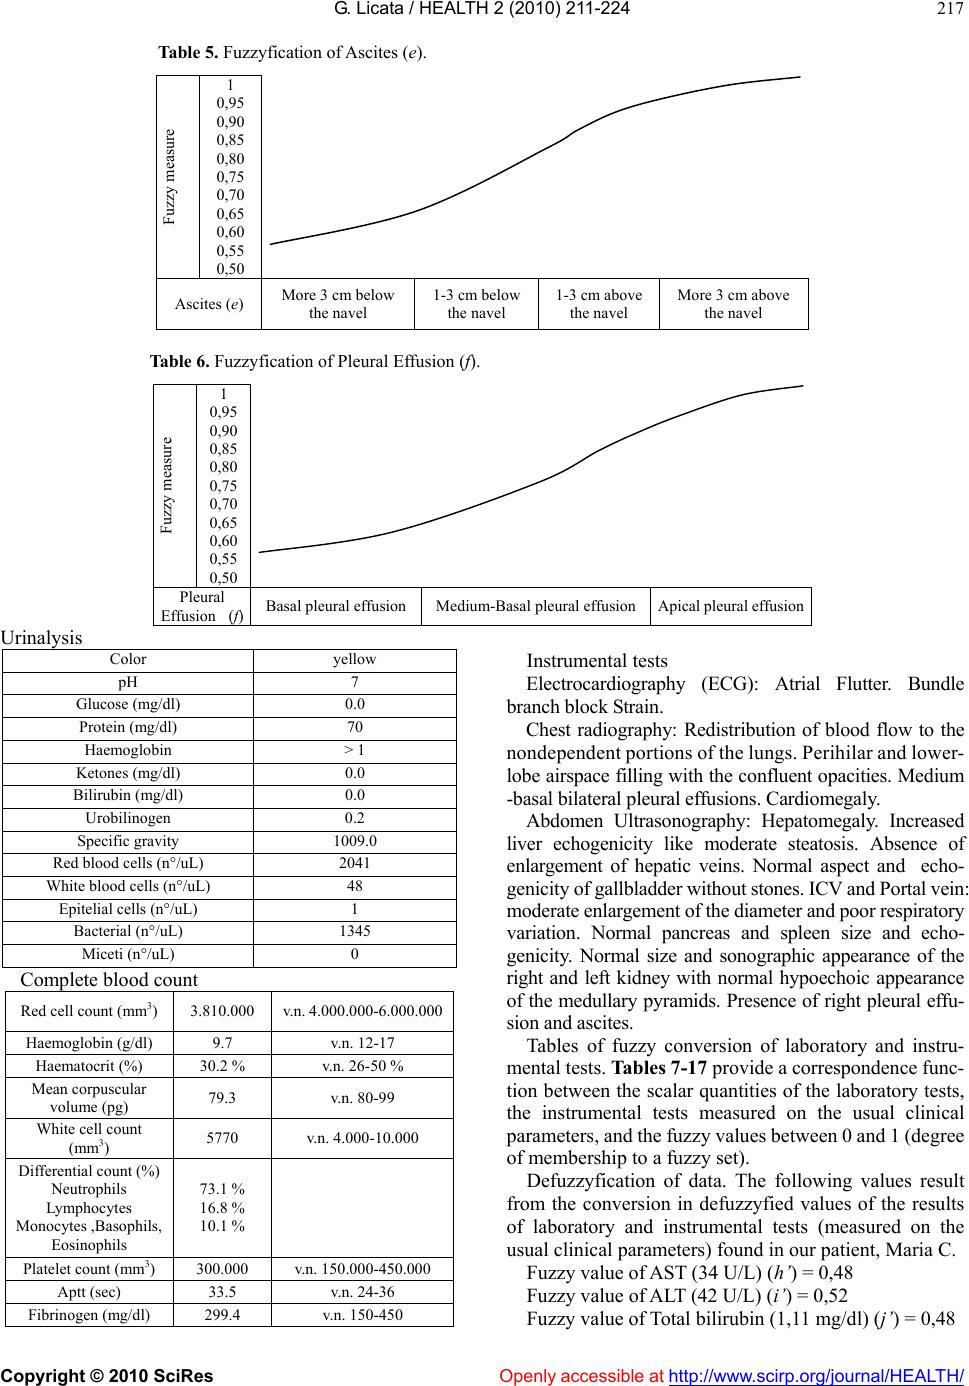 G. Licata / HEALTH 2 (2010) 211-224 Copyright © 2010 SciRes Openly accessible at http://www.scirp.org/journal/HEALTH/ 217 Table 5. Fuzzyfication of Ascites (e). Fuzzy measure 1 0,95 0,90 0,85 0,80 0,75 0,70 0,65 0,60 0,55 0,50 Ascites (e) More 3 cm below the navel 1-3 cm below the navel 1-3 cm above the navel More 3 cm above the navel Table 6. Fuzzyfication of Pleural Effusion (f). Fuzzy measure 1 0,95 0,90 0,85 0,80 0,75 0,70 0,65 0,60 0,55 0,50 Pleural Effusion (f)Basal pleural effusionMedium-Basal pleural effusionApical pleural effusion Urinalysis Color yellow pH 7 Glucose (mg/dl) 0.0 Protein (mg/dl) 70 Haemoglobin > 1 Ketones (mg/dl) 0.0 Bilirubin (mg/dl) 0.0 Urobilinogen 0.2 Specific gravity 1009.0 Red blood cells (n°/uL) 2041 White blood cells (n°/uL) 48 Epitelial cells (n°/uL) 1 Bacterial (n°/uL) 1345 Miceti (n°/uL) 0 Complete blood count Red cell count (mm3) 3.810.000 v.n. 4.000.000-6.000.000 Haemoglobin (g/dl) 9.7 v.n. 12-17 Haematocrit (%) 30.2 % v.n. 26-50 % Mean corpuscular volume (pg) 79.3 v.n. 80-99 White cell count (mm3) 5770 v.n. 4.000-10.000 Differential count (%) Neutrophils Lymphocytes Monocytes ,Basophils, Eosinophils 73.1 % 16.8 % 10.1 % Platelet count (mm3) 300.000 v.n. 150.000-450.000 Aptt (sec) 33.5 v.n. 24-36 Fibrinogen (mg/dl) 299.4 v.n. 150-450 Instrumental tests Electrocardiography (ECG): Atrial Flutter. Bundle branch block Strain. Chest radiography: Redistribution of blood flow to the nondependent portions of the lungs. Perihilar and lower- lobe airspace filling with the confluent opacities. Medium -basal bilateral pleural effusions. Cardiomegaly. Abdomen Ultrasonography: Hepatomegaly. Increased liver echogenicity like moderate steatosis. Absence of enlargement of hepatic veins. Normal aspect and echo- genicity of gallbladder without stones. ICV and Portal vein: moderate enlargement of the diameter and poor respiratory variation. Normal pancreas and spleen size and echo- genicity. Normal size and sonographic appearance of the right and left kidney with normal hypoechoic appearance of the medullary pyramids. Presence of right pleural effu- sion and ascites. Tables of fuzzy conversion of laboratory and instru- mental tests. Tables 7-17 provide a correspondence func- tion between the scalar quantities of the laboratory tests, the instrumental tests measured on the usual clinical parameters, and the fuzzy values between 0 and 1 (degree of membership to a fuzzy set). Defuzzyfication of data. The following values result from the conversion in defuzzyfied values of the results of laboratory and instrumental tests (measured on the usual clinical parameters) found in our patient, Maria C. Fuzzy value of AST (34 U/L) (h’) = 0,48 Fuzzy value of ALT (42 U/L) (i’) = 0,52 Fuzzy value of Total bilirubin (1,11 mg/dl) (j’) = 0,48 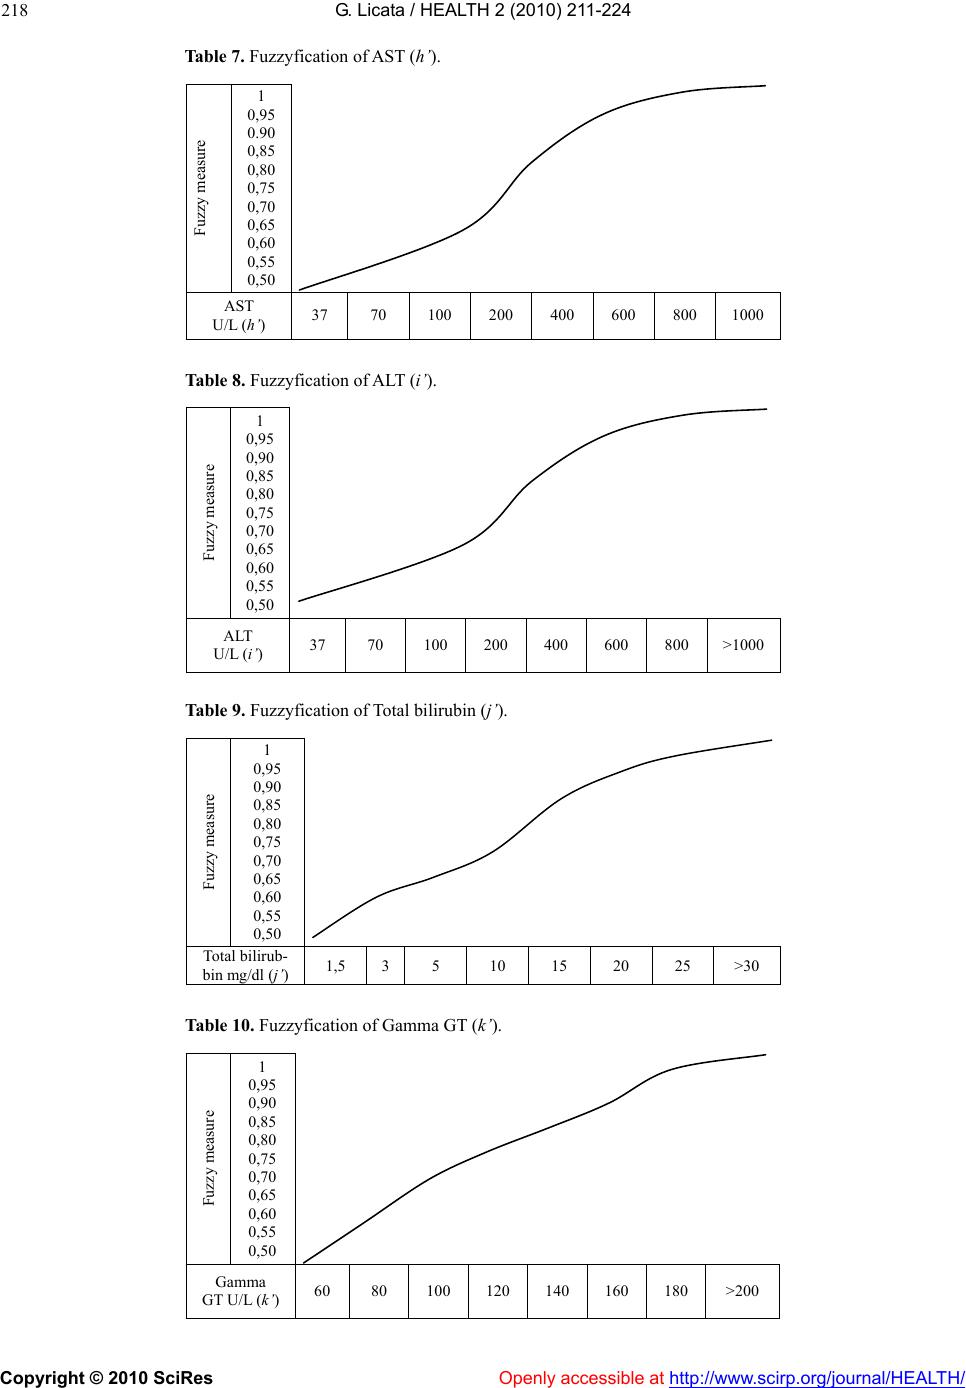 G. Licata / HEALTH 2 (2010) 211-224 Copyright © 2010 SciRes Openly accessible at http://www.scirp.org/journal/HEALTH/ 218 Table 7. Fuzzyfication of AST (h’). Fuzzy measure 1 0,95 0.90 0,85 0,80 0,75 0,70 0,65 0,60 0,55 0,50 AST U/L (h’) 37 70 100 200 400 600 800 1000 Table 8. Fuzzyfication of ALT (i’). Fuzzy measure 1 0,95 0,90 0,85 0,80 0,75 0,70 0,65 0,60 0,55 0,50 ALT U/L (i’) 37 70 100 200 400 600 800 >1000 Table 9. Fuzzyfication of Total bilirubin (j’). Fuzzy measure 1 0,95 0,90 0,85 0,80 0,75 0,70 0,65 0,60 0,55 0,50 Total bilirub- bin mg/dl (j’) 1,5 35 10 15 20 25 >30 Table 10. Fuzzyfication of Gamma GT (k’). Fuzzy measure 1 0,95 0,90 0,85 0,80 0,75 0,70 0,65 0,60 0,55 0,50 Gamma GT U/L (k’) 60 80 100 120 140 160 180 >200 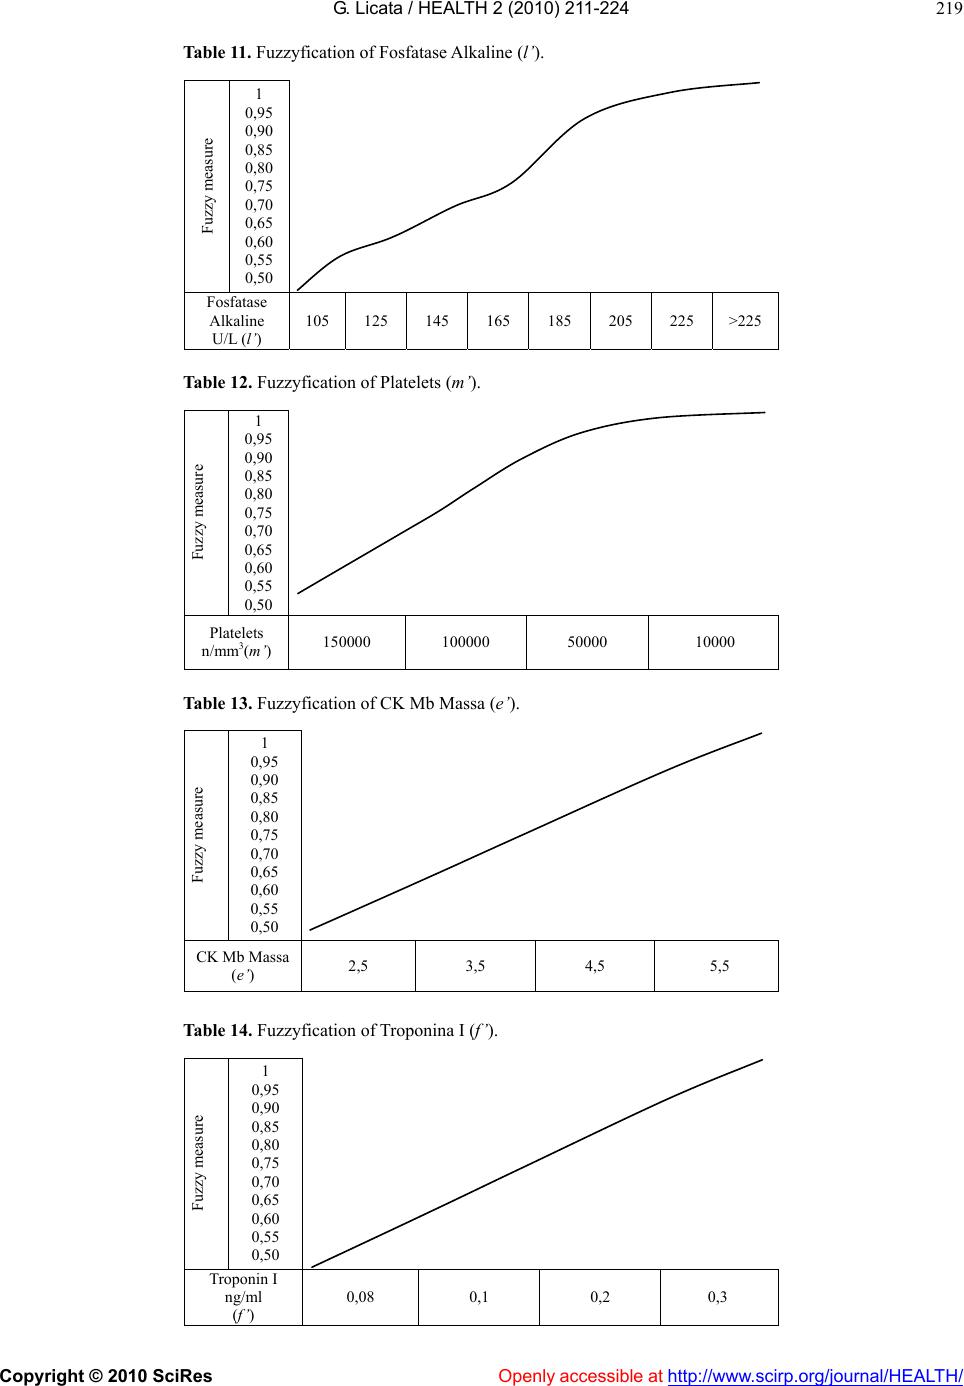 G. Licata / HEALTH 2 (2010) 211-224 Copyright © 2010 SciRes Openly accessible at http://www.scirp.org/journal/HEALTH/ 219 Table 11. Fuzzyfication of Fosfatase Alkaline (l’). Fuzzy measure 1 0,95 0,90 0,85 0,80 0,75 0,70 0,65 0,60 0,55 0,50 Fosfatase Alkaline U/L (l’) 105 125 145 165 185 205 225 >225 Table 12. Fuzzyfication of Platelets (m’). Fuzzy measure 1 0,95 0,90 0,85 0,80 0,75 0,70 0,65 0,60 0,55 0,50 Platelets n/mm3(m’) 150000 100000 50000 10000 Table 13. Fuzzyfication of CK Mb Massa (e’). Fuzzy measure 1 0,95 0,90 0,85 0,80 0,75 0,70 0,65 0,60 0,55 0,50 CK Mb Massa (e’) 2,5 3,5 4,5 5,5 Table 14. Fuzzyfication of Troponina I (f’). Fuzzy measure 1 0,95 0,90 0,85 0,80 0,75 0,70 0,65 0,60 0,55 0,50 Troponin I ng/ml (f’) 0,08 0,1 0,2 0,3 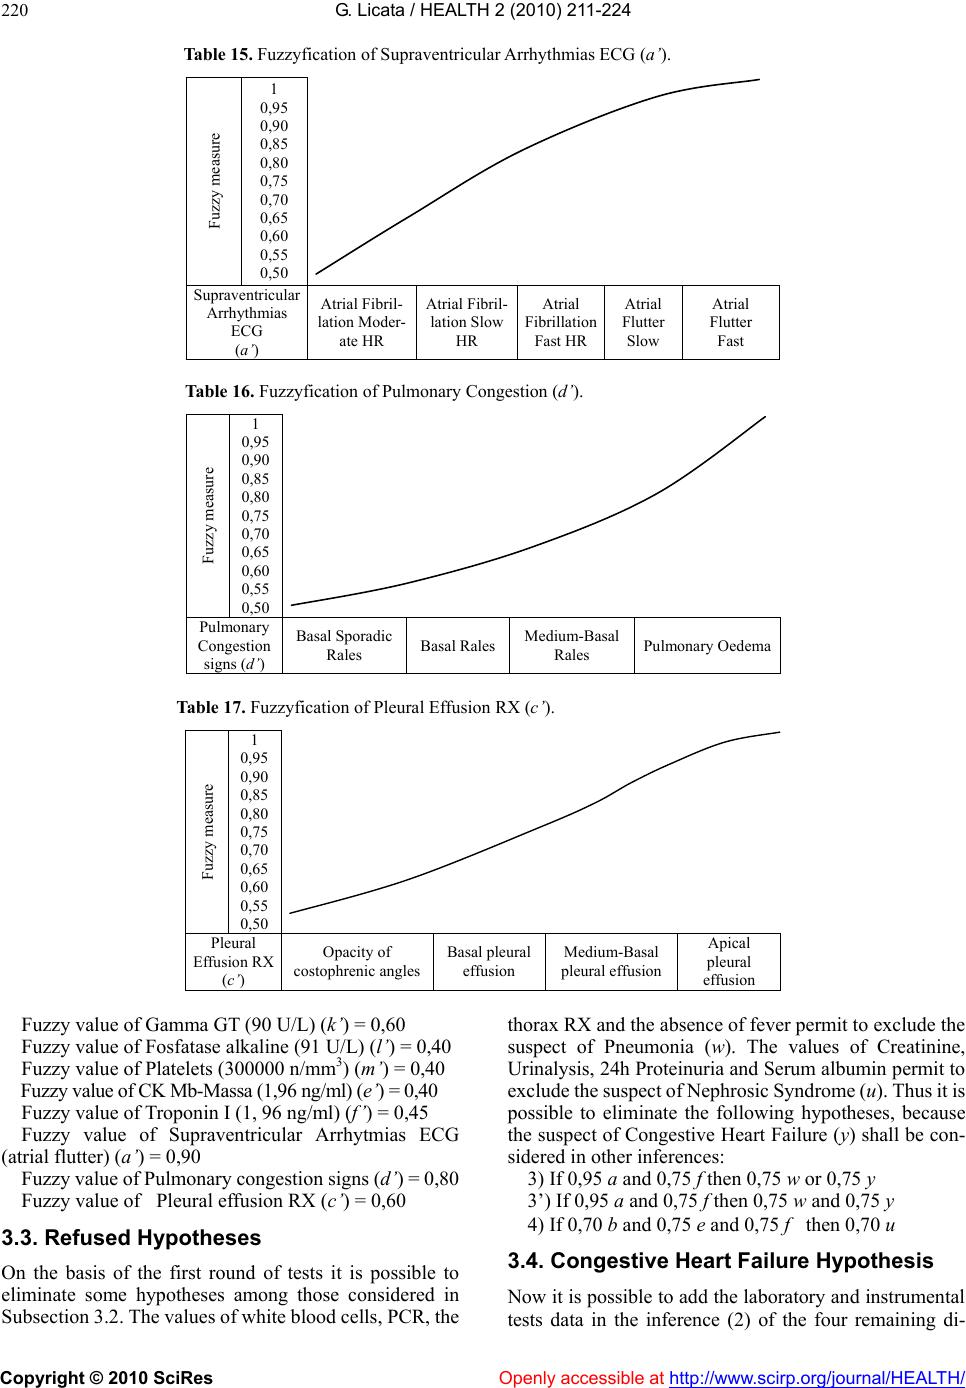 G. Licata / HEALTH 2 (2010) 211-224 Copyright © 2010 SciRes http://www.scirp.org/journal/HEALTH/ 220 Table 15. Fuzzyfication of Supraventricular Arrhythmias ECG (a’). Fuzzy measure 1 0,95 0,90 0,85 0,80 0,75 0,70 0,65 0,60 0,55 0,50 Supraventricular Arrhythmias ECG (a’) Atrial Fibril- lation Moder- ate HR Atrial Fibril- lation Slow HR Atrial Fibrillation Fast HR Atrial Flutter Slow Atrial Flutter Fast Table 16. Fuzzyfication of Pulmonary Congestion (d’). Fuzzy measure 1 0,95 0,90 0,85 0,80 0,75 0,70 0,65 0,60 0,55 0,50 Pulmonary Congestion signs (d’) Basal Sporadic Rales Basal RalesMedium-Basal Rales Pulmonary Oedema Table 17. Fuzzyfication of Pleural Effusion RX (c’). Fuzzy measure 1 0,95 0,90 0,85 0,80 0,75 0,70 0,65 0,60 0,55 0,50 Pleural Effusion RX (c’) Opacity of costophrenic angles Basal pleural effusion Medium-Basal pleural effusion Apical pleural effusion Fuzzy value of Gamma GT (90 U/L) (k’) = 0,60 Fuzzy value of Fosfatase alkaline (91 U/L) (l’) = 0,40 Fuzzy value of Platelets (300000 n/mm3) (m’) = 0,40 Fuzzy value of CK Mb-Massa (1,96 ng/ml) (e’) = 0,40 Fuzzy value of Troponin I (1, 96 ng/ml) (f’) = 0,45 Fuzzy value of Supraventricular Arrhytmias ECG (atrial flutter) (a’) = 0,90 Openly accessible at Fuzzy value of Pulmonary congestion signs (d’) = 0,80 Fuzzy value of Pleural effusion RX (c’) = 0,60 3.3. Refused Hypotheses On the basis of the first round of tests it is possible to eliminate some hypotheses among those considered in Subsection 3.2. The values of white blood cells, PCR, the thorax RX and the absence of fever permit to exclude the suspect of Pneumonia (w). The values of Creatinine, Urinalysis, 24h Proteinuria and Serum albumin permit to exclude the suspect of Nephrosic Syndrome (u). Thus it is possible to eliminate the following hypotheses, because the suspect of Congestive Heart Failure (y) shall be con- sidered in other inferences: 3) If 0,95 a and 0,75 f then 0,75 w or 0,75 y 3’) If 0,95 a and 0,75 f then 0,75 w and 0,75 y 4) If 0,70 b and 0,75 e and 0,75 f then 0,70 u 3.4. Congestive Heart Failure Hypothesis Now it is possible to add the laboratory and instrumental tests data in the inference (2) of the four remaining di- 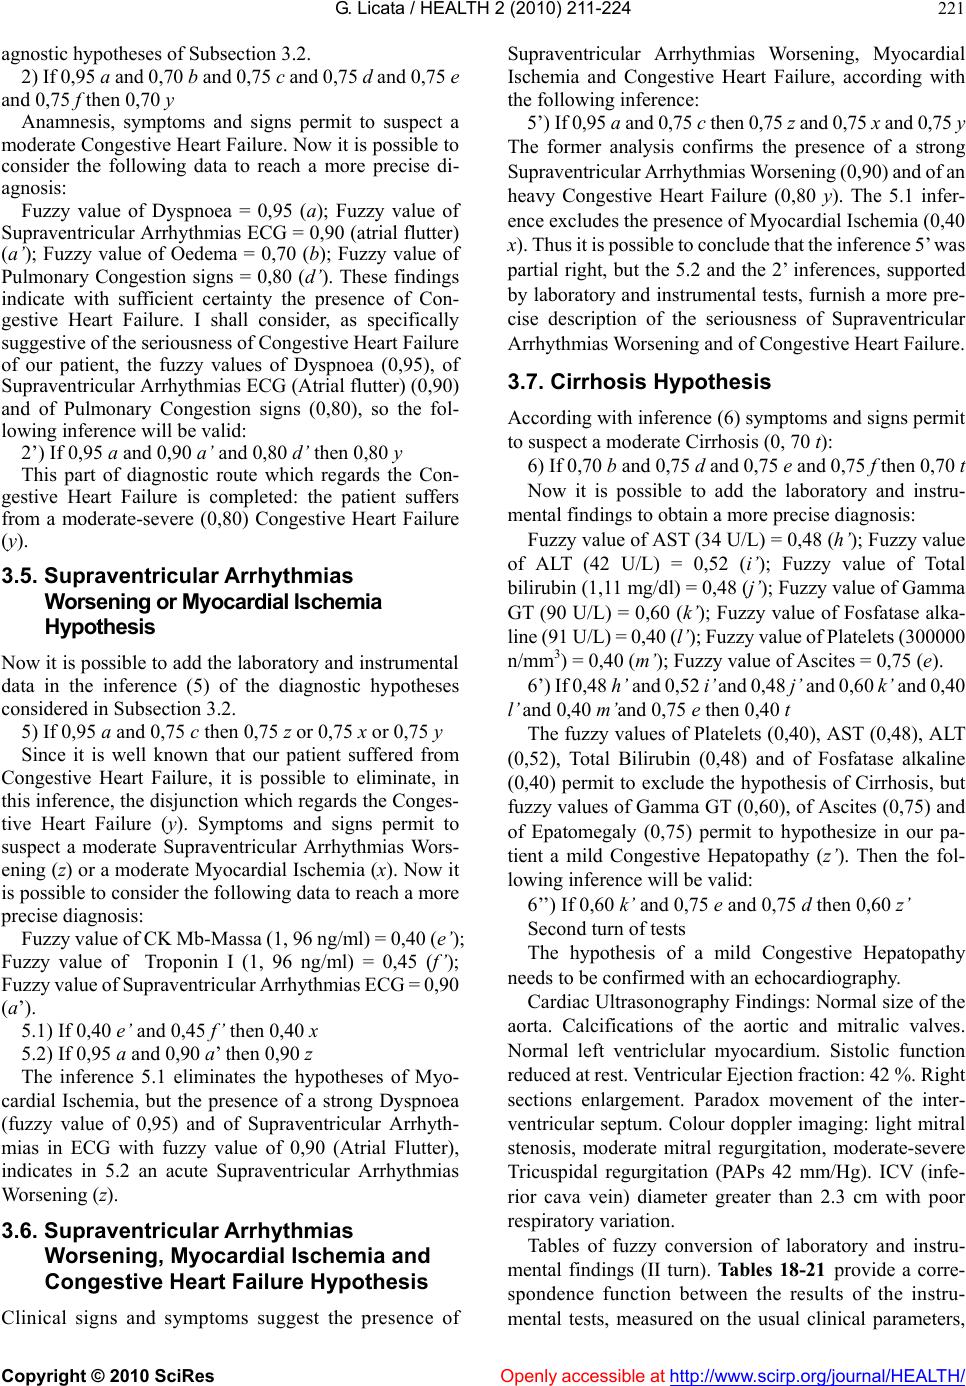 G. Licata / HEALTH 2 (2010) 211-224 Copyright © 2010 SciRes Openly accessible at http://www.scirp.org/journal/HEALTH/ 221 agnostic hypotheses of Subsection 3.2. 2) If 0,95 a and 0,70 b and 0,75 c and 0,75 d and 0,75 e and 0,75 f then 0,70 y Anamnesis, symptoms and signs permit to suspect a moderate Congestive Heart Failure. Now it is possible to consider the following data to reach a more precise di- agnosis: Fuzzy value of Dyspnoea = 0,95 (a); Fuzzy value of Supraventricular Arrhythmias ECG = 0,90 (atrial flutter) (a’); Fuzzy value of Oedema = 0,70 (b); Fuzzy value of Pulmonary Congestion signs = 0,80 (d’). These findings indicate with sufficient certainty the presence of Con- gestive Heart Failure. I shall consider, as specifically suggestive of the seriousness of Congestive Heart Failure of our patient, the fuzzy values of Dyspnoea (0,95), of Supraventricular Arrhythmias ECG (Atrial flutter) (0,90) and of Pulmonary Congestion signs (0,80), so the fol- lowing inference will be valid: 2’) If 0,95 a and 0,90 a’ and 0,80 d’ then 0,80 y This part of diagnostic route which regards the Con- gestive Heart Failure is completed: the patient suffers from a moderate-severe (0,80) Congestive Heart Failure (y). 3.5. Supraventricular Arrhythmias Worsening or Myocardial Ischemia Hypothesis Now it is possible to add the laboratory and instrumental data in the inference (5) of the diagnostic hypotheses considered in Subsection 3.2. 5) If 0,95 a and 0,75 c then 0,75 z or 0,75 x or 0,75 y Since it is well known that our patient suffered from Congestive Heart Failure, it is possible to eliminate, in this inference, the disjunction which regards the Conges- tive Heart Failure (y). Symptoms and signs permit to suspect a moderate Supraventricular Arrhythmias Wors- ening (z) or a moderate Myocardial Ischemia (x). Now it is possible to consider the following data to reach a more precise diagnosis: Fuzzy value of CK Mb-Massa (1, 96 ng/ml) = 0,40 (e’); Fuzzy value of Troponin I (1, 96 ng/ml) = 0,45 (f’); Fuzzy value of Supraventricular Arrhythmias ECG = 0,90 (a’). 5.1) If 0,40 e’ and 0,45 f’ then 0,40 x 5.2) If 0,95 a and 0,90 a’ then 0,90 z The inference 5.1 eliminates the hypotheses of Myo- cardial Ischemia, but the presence of a strong Dyspnoea (fuzzy value of 0,95) and of Supraventricular Arrhyth- mias in ECG with fuzzy value of 0,90 (Atrial Flutter), indicates in 5.2 an acute Supraventricular Arrhythmias Worsening (z). 3.6. Supraventricular Arrhythmias Worsening, Myocardial Ischemia and Congestive Heart Failure Hypothesis Clinical signs and symptoms suggest the presence of Supraventricular Arrhythmias Worsening, Myocardial Ischemia and Congestive Heart Failure, according with the following inference: 5’) If 0,95 a and 0,75 c then 0,75 z and 0,75 x and 0,75 y The former analysis confirms the presence of a strong Supraventricular Arrhythmias Worsening (0,90) and of an heavy Congestive Heart Failure (0,80 y). The 5.1 infer- ence excludes the presence of Myocardial Ischemia (0,40 x). Thus it is possible to conclude that the inference 5’ was partial right, but the 5.2 and the 2’ inferences, supported by laboratory and instrumental tests, furnish a more pre- cise description of the seriousness of Supraventricular Arrhythmias Worsening and of Congestive Heart Failure. 3.7. Cirrhosis Hypothesis According with inference (6) symptoms and signs permit to suspect a moderate Cirrhosis (0, 70 t): 6) If 0,70 b and 0,75 d and 0,75 e and 0,75 f then 0,70 t Now it is possible to add the laboratory and instru- mental findings to obtain a more precise diagnosis: Fuzzy value of AST (34 U/L) = 0,48 (h’); Fuzzy value of ALT (42 U/L) = 0,52 (i’); Fuzzy value of Total bilirubin (1,11 mg/dl) = 0,48 (j’); Fuzzy value of Gamma GT (90 U/L) = 0,60 (k’); Fuzzy value of Fosfatase alka- line (91 U/L) = 0,40 (l’ ); Fuzzy value of Platelets (300000 n/mm3) = 0,40 (m’); Fuzzy value of Ascites = 0,75 (e). 6’) If 0,48 h’ and 0,52 i’ and 0,48 j’ and 0,60 k’ and 0,40 l’ and 0,40 m’and 0,75 e then 0,40 t The fuzzy values of Platelets (0,40), AST (0,48), ALT (0,52), Total Bilirubin (0,48) and of Fosfatase alkaline (0,40) permit to exclude the hypothesis of Cirrhosis, but fuzzy values of Gamma GT (0,60), of Ascites (0,75) and of Epatomegaly (0,75) permit to hypothesize in our pa- tient a mild Congestive Hepatopathy (z’ ). Then the fol- lowing inference will be valid: 6’’) If 0,60 k’ and 0,75 e and 0,75 d then 0,60 z’ Second turn of tests The hypothesis of a mild Congestive Hepatopathy needs to be confirmed with an echocardiography. Cardiac Ultrasonography Findings: Normal size of the aorta. Calcifications of the aortic and mitralic valves. Normal left ventriclular myocardium. Sistolic function reduced at rest. Ventricular Ejection fraction: 42 %. Right sections enlargement. Paradox movement of the inter- ventricular septum. Colour doppler imaging: light mitral stenosis, moderate mitral regurgitation, moderate-severe Tricuspidal regurgitation (PAPs 42 mm/Hg). ICV (infe- rior cava vein) diameter greater than 2.3 cm with poor respiratory variation. Tables of fuzzy conversion of laboratory and instru- mental findings (II turn). Tables 18-21 provide a corre- spondence function between the results of the instru- mental tests, measured on the usual clinical parameters, 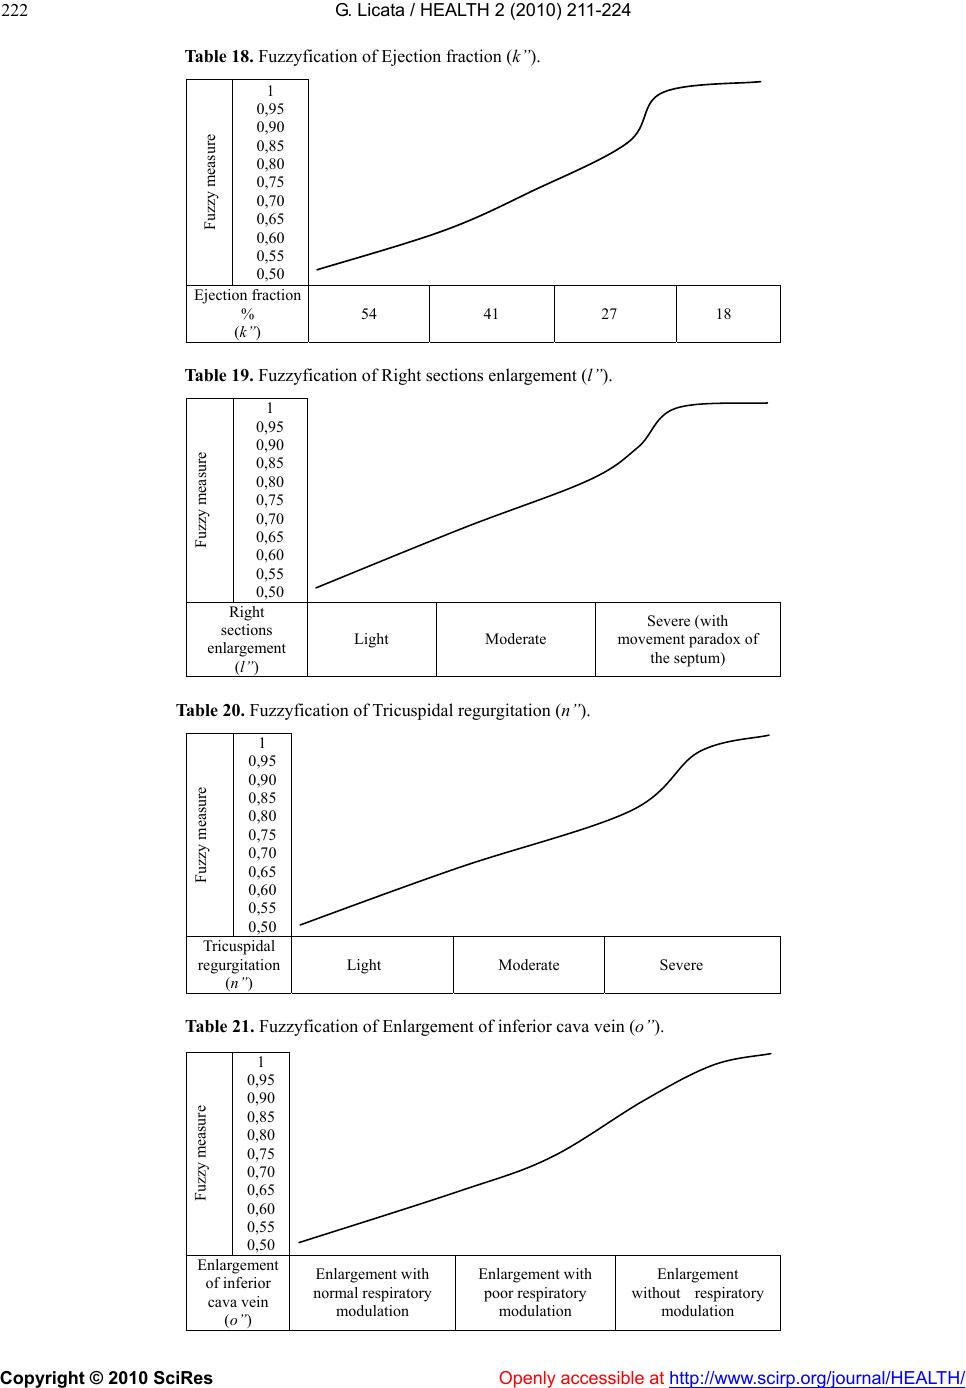 G. Licata / HEALTH 2 (2010) 211-224 Copyright © 2010 SciRes http://www.scirp.org/journal/HEALTH/ 222 Table 18. Fuzzyfication of Ejection fraction (k’’). Fuzzy measure 1 0,95 0,90 0,85 0,80 0,75 0,70 0,65 0,60 0,55 0,50 Ejection fraction % (k’’) 54 41 27 18 Table 19. Fuzzyfication of Right sections enlargement (l’’). Fuzzy measure 1 0,95 0,90 0,85 0,80 0,75 0,70 0,65 0,60 0,55 0,50 Right sections enlargement (l’’) Light Moderate Severe (with movement paradox of the septum) Table 20. Fuzzyfication of Tricuspidal regurgitation (n’’). Fuzzy measure 1 0,95 0,90 0,85 0,80 0,75 0,70 0,65 0,60 0,55 0,50 Tricuspidal regurgitation (n’’) Light Moderate Severe Table 21. Fuzzyfication of Enlargement of inferior cava vein (o’’). Fuzzy measure 1 0,95 0,90 0,85 0,80 0,75 0,70 0,65 0,60 0,55 0,50 Enlargement of inferior cava vein (o’’) Enlargement with normal respiratory modulation Enlargement with poor respiratory modulation Enlargement without respiratory modulation Openly accessible at  G. Licata / HEALTH 2 (2010) 211-224 Copyright © 2010 SciRes Openly accessible at http://www.scirp.org/journal/HEALTH/ 223 and the fuzzy values between 0 and 1 (degree of mem- bership to a fuzzy set). Defuzzification of data. The following values result from the conversion in defuzzyfied values of the results of instrumental tests (measured on the usual clinical pa- rameters) found in our patient, Maria C. Fuzzy value of Ejection fraction 42 % (k’’) = 0,60 Fuzzy value of Right sections enlargement (l’’) = 0,90 Fuzzy value of moderate-severe Tricuspidal regurgita- tion (n’’) = 0,80 Fuzzy value of Enlarged inferior cava vein with poor respiratory modulation (o’’) = 0,80 3.8. Congestive Hepatopathy Hypothesis Fuzzy values of Gamma GT = 0,60 (k’), of Ascites = 0,75 (e) and of Epatomegaly = 0,75 (d) permit to hypothesize in our patient a Congestive Hepatopathy (z’). Then the following inference will be valid: 6’’) If 0,60 k’ and 0,75 e and 0,75 d then 0,60 z’ Now it is possible to consider the following data to obtain a more precise diagnosis: Fuzzy values of Right Sections enlargement = 0,90 (l’’), moderate-severe Tricuspidal regurgitation = 0,80 (n’’), Enlarged inferior cava vein with poor respiratory modu- lation = 0,80 (o’’). Thus the following inference will be valid: 6’’’) If 0,90 l’’ and 0,80 n’’ and 0,80 o’’ then 0,80 z’ The fuzzy values of Right Sections enlargement = 0,90 (l’’), of moderate-severe Tricuspidal regurgitation = 0,80 (n’’) and of Enlarged inferior cava vein with poor respi- ratory modulation = 0,80 (o’’) permit the diagnosis of a moderate-severe (0,80) Congestive Hepatopathy (z’). 3.9. Other Findings The echocardiographic findings permit to confirm the Congestive Heart Failure with Congestive Hepatopathy and to establish a plausible pathophysiologic link between these two diseases. Fuzzy value of EF 42 % = 0,60 (k’’) confirms our diagnosis of Congestive Heart Failure, moreover all echocardiographic findings permit to affirm that the Congestive Heart Failure of our patient is a Global Congestive Heart Failure. Now it is possible to consider the following data to obtain a more precise diagnosis: Fuzzy value of Right sections enlargement = 0,90 (l’’) and Enlarged inferior cava vein with poor respiratory modulation = 0,80 (o’’). The following inference will be valid: 7) If 0,90 l’’ and 0,80 o’’ then 0,80 y C 0,80 z’ Where C indicates the causal relation between Con- gestive Heart Failure (y) and Congestive Hepatopathy (z’). Final diagnosis Maria C., affected by diabetes mellitus, Hypertension and Atrial fibrillation, was admitted to our unit because of dyspnoea, fatigue, leg oedema and abdominal enlargement. She suffers from the following diseases: 1) A moderate-severe (0,80) Global Congestive Heart Failure; 2) A severe (0,90) Worsening of the Supraventricular Arrhythmia (Atrial Flutter); 3) A moderate-severe (0,80) Congestive Hepatopathy; 4) A causal relation between Congestive Heart Failure and Congestive Hepatopathy. A moderate-severe (0,80) Congestive Heart Failure (CHF) is a condition in which the heart can no longer pump enough blood to the rest of the body. It is almost always a chronic, long-term condition, although it can sometimes develop suddenly. In our case, probably, the decompensed CHF (0,80) was caused by the onset worsening of the Supraventricular Arrhythmia (0,90). With heart failure, many organs don’t receive enough oxygen and nutrients, which damages them and reduces their ability to function properly. Decompensed right ventricular or global Heart Failure (0,80) causes trans- mission of elevated central venous pressures directly to the liver; venous congestion impedes efficient drainage of sinusoidal blood flow and sinusoidal stasis results in ac- cumulation of deoxygenated blood and, ultimately, in a moderate-severe (0,80) Congestive Hepatopathy and cardiac cirrhosis. As the heart’s pumping action is lost (as in our case), blood may go back up into other areas of the body, including: the liver (0,80 Congestive Hepatopathy), the gastrointestinal tract (0,75 Ascites) the extremities (0,70 leg oedema) and the lungs (0,95 Dyspnoea, 0,60 Pleural Effusion and 0,80 Pulmonary Congestion Signs). 4. CONCLUSIONS Is fuzzy logic an improvement of probabilistic logic for clinical diagnosis? In what sense is it an improvement? The success of fuzzy diagnosis in its application to a real clinical case shows that fuzzy diagnosis is an improve- ment of probabilistic logic. The accuracy of final diagno- sis, with pathophysiological explanation within the de- scription of the causes, of sings and of symptoms, is a proof that fuzzy logic describes the pathological phe- nomena with a precision that probabilistic diagnosis cannot reach. Nevertheless, fuzzy diagnosis seems to be impossible without the contribution of probabilistic rea- soning. Indeed the physician, in the differential diagnosis, chooses the hypotheses to follow on the basis of prob- ability. The differential diagnoses of Subsection 3.1 ob- tain their precision with the quantitative inferences of fuzzy logic, but the preference of some diseases more than others, is probabilistic. Finally, it is now possible to an- swer to the question on the relation between probabilistic and fuzzy logic in the diagnostic algorithm. At the be- ginning of diagnosis, on the basis of signs, symptoms and anamnesis, a probabilistic reasoning must lead the re- search, while, in the progress of diagnosis, the more and  G. Licata / HEALTH 2 (2010) 211-224 Copyright © 2010 SciRes Openly accessible at http://www.scirp.org/journal/HEALTH/ 224 more rich plenty of data requires the use of fuzzy infer- ences. In this way it is possible to see that some mean- ingful fuzzy values (laboratory and instrumental data) are able to address the probabilistic choice of the diseases to consider. At the end of diagnostic process the fuzzy in- ferences can identify the nature and the seriousness of diseases found. Thus, fuzzy logic is not a substitute of probabilistic logic, but its natural complement. REFERENCES [1] Finetti, B. de (1989) La logica dell’incerto, A Cura Di M. Mondadori, Il Saggiatore, Milano. [2] Kosko, B. (1993) Fuzzy thinking: the new science of fuzzy logic, Hyperion, New York. [3] Sugeno, M. (1977) Fuzzy measures and fuzzy integrals: A survey, in fuzzy automata and decision processes, M.M. Gupta et al., North Holland, New York, 89-102. [4] Dubois, D. and Prade, H. (1980) Fuzzy sets and systems: Theory and applications, Academic Press. [5] Yager, R. (1980) On a general class of fuzzy connectives, Fuzzy Sets and Systems, 4, 235-242. [6] Hajek, P. (2006) Fuzzy logic, Voice of Stanford Encyclo- Pedia of Philosophy.
|