Paper Menu >>
Journal Menu >>
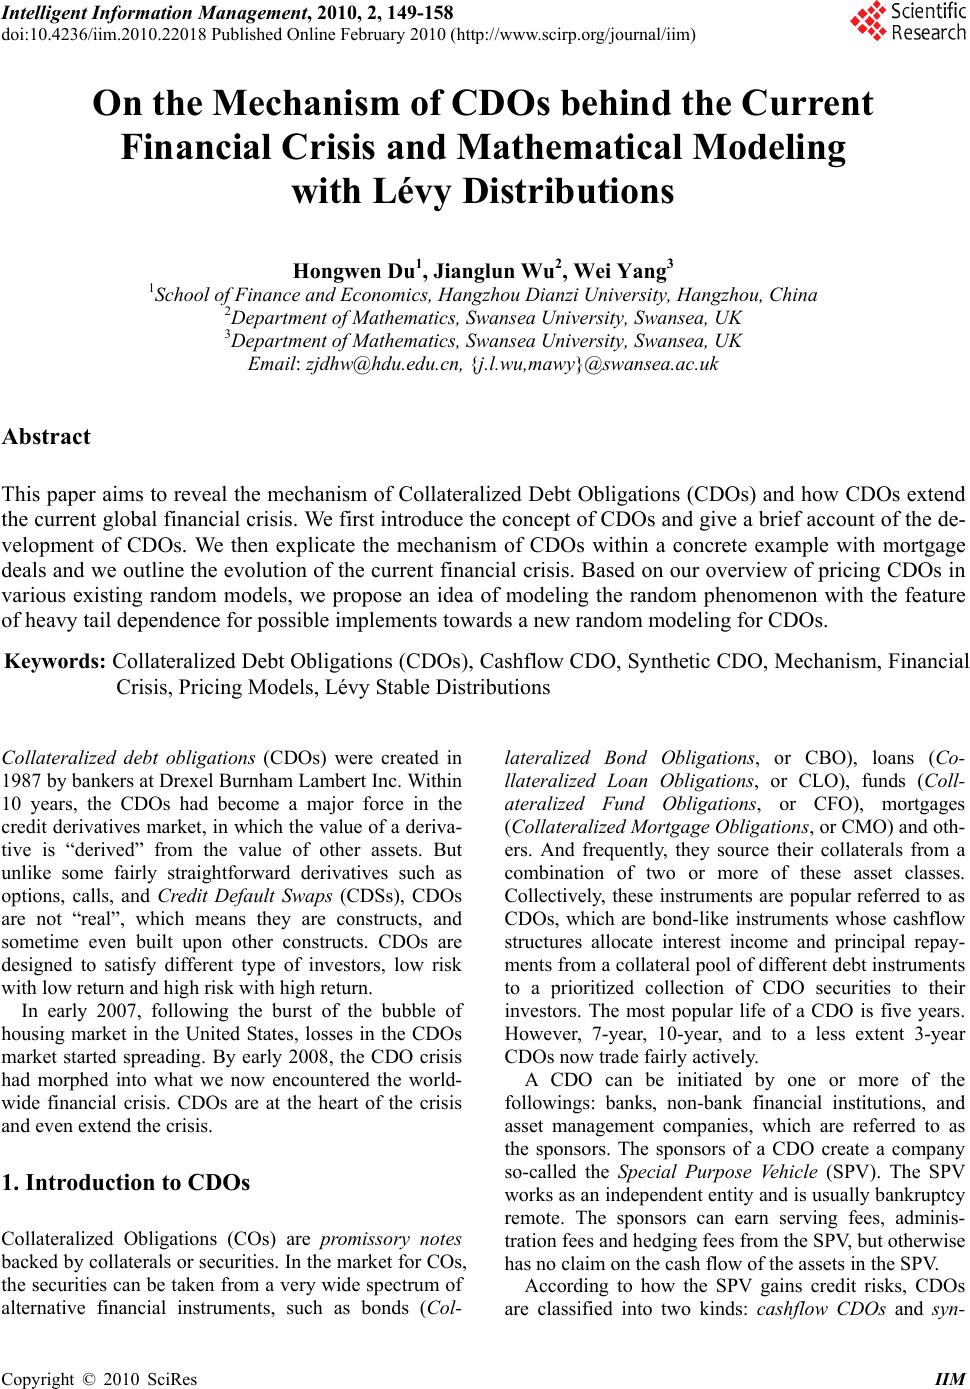 Intelligent Information Management, 2010, 2, 149-158 doi:10.4236/iim.2010.22018 Published Online February 2010 (http://www.scirp.org/journal/iim) Copyright © 2010 SciRes IIM On the Mechanism of CDOs behind the Current Financial Crisis and Mathematical Modeling with Lévy Distributions Hongwen Du1, Jianglun Wu2, Wei Yang3 1School of Finance and Economics, Hangzhou Dianzi University, Hangzhou, China 2Department of Mathematics, Swansea University, Swansea, UK 3Department of Mathematics, Swansea University, Swansea, UK Email: zjdhw@hdu.edu.cn, {j.l.wu,mawy}@swansea.ac.uk Abstract This paper aims to reveal the mechanism of Collateralized Debt Obligations (CDOs) and how CDOs extend the current global financial crisis. We first introduce the concept of CDOs and give a brief account of the de- velopment of CDOs. We then explicate the mechanism of CDOs within a concrete example with mortgage deals and we outline the evolution of the current financial crisis. Based on our overview of pricing CDOs in various existing random models, we propose an idea of modeling the random phenomenon with the feature of heavy tail dependence for possible implements towards a new random modeling for CDOs. Keywords: Collateralized Debt Obligations (CDOs), Cashflow CDO, Synthetic CDO, Mechanism, Financial Crisis, Pricing Models, Lévy Stable Distributions Collateralized debt obligations (CDOs) were created in 1987 by bankers at Drexel Burnham Lambert Inc. Within 10 years, the CDOs had become a major force in the credit derivatives market, in which the value of a deriva- tive is “derived” from the value of other assets. But unlike some fairly straightforward derivatives such as options, calls, and Credit Default Swaps (CDSs), CDOs are not “real”, which means they are constructs, and sometime even built upon other constructs. CDOs are designed to satisfy different type of investors, low risk with low return and high risk with high return. In early 2007, following the burst of the bubble of housing market in the United States, losses in the CDOs market started spreading. By early 2008, the CDO crisis had morphed into what we now encountered the world- wide financial crisis. CDOs are at the heart of the crisis and even extend the crisis. 1. Introduction to CDOs Collateralized Obligations (COs) are promissory notes backed by collaterals or securities. In the market for COs, the securities can be taken from a very wide spectrum of alternative financial instruments, such as bonds (Col- lateralized Bond Obligations, or CBO), loans (Co- llateralized Loan Obligations, or CLO), funds (Coll- ateralized Fund Obligations, or CFO), mortgages (Collateralized Mortgage Obligations, or CMO) and oth- ers. And frequently, they source their collaterals from a combination of two or more of these asset classes. Collectively, these instruments are popular referred to as CDOs, which are bond-like instruments whose cashflow structures allocate interest income and principal repay- ments from a collateral pool of different debt instruments to a prioritized collection of CDO securities to their investors. The most popular life of a CDO is five years. However, 7-year, 10-year, and to a less extent 3-year CDOs now trade fairly actively. A CDO can be initiated by one or more of the followings: banks, non-bank financial institutions, and asset management companies, which are referred to as the sponsors. The sponsors of a CDO create a company so-called the Special Purpose Vehicle (SPV). The SPV works as an independent entity and is usually bankruptcy remote. The sponsors can earn serving fees, adminis- tration fees and hedging fees from the SPV, but otherwise has no claim on the cash flow of the assets in the SPV. According to how the SPV gains credit risks, CDOs are classified into two kinds: cashflow CDOs and syn- 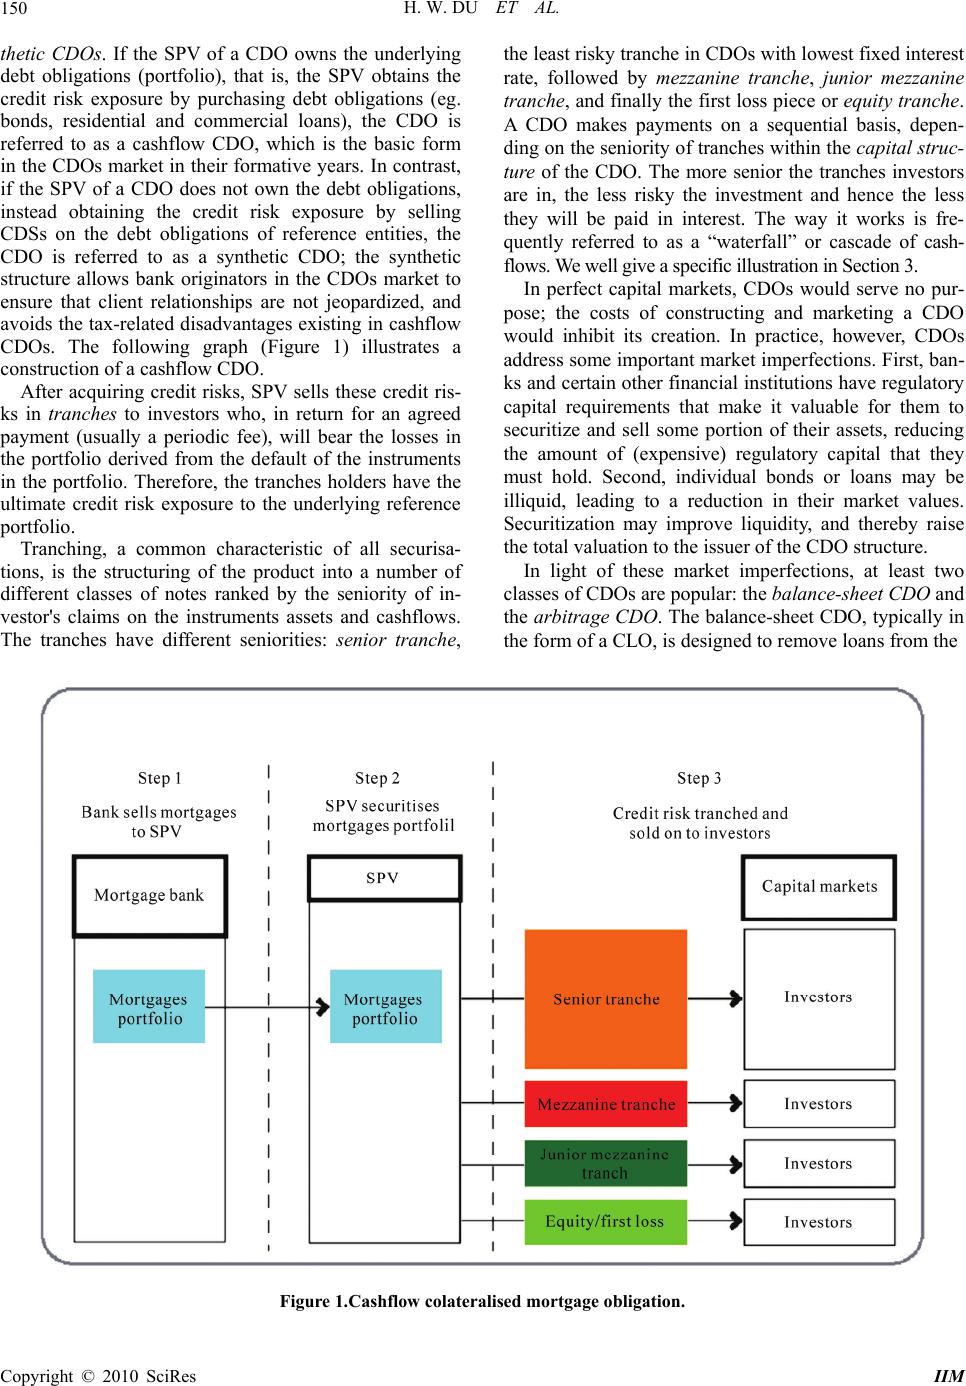 H. W. DU ET AL. 150 thetic CDOs. If the SPV of a CDO owns the underlying debt obligations (portfolio), that is, the SPV obtains the credit risk exposure by purchasing debt obligations (eg. bonds, residential and commercial loans), the CDO is referred to as a cashflow CDO, which is the basic form in the CDOs market in their formative years. In contrast, if the SPV of a CDO does not own the debt obligations, instead obtaining the credit risk exposure by selling CDSs on the debt obligations of reference entities, the CDO is referred to as a synthetic CDO; the synthetic structure allows bank originators in the CDOs market to ensure that client relationships are not jeopardized, and avoids the tax-related disadvantages existing in cashflow CDOs. The following graph (Figure 1) illustrates a construction of a cashflow CDO. After acquiring credit risks, SPV sells these credit ris- ks in tranches to investors who, in return for an agreed payment (usually a periodic fee), will bear the losses in the portfolio derived from the default of the instruments in the portfolio. Therefore, the tranches holders have the ultimate credit risk exposure to the underlying reference portfolio. Tranching, a common characteristic of all securisa- tions, is the structuring of the product into a number of different classes of notes ranked by the seniority of in- vestor's claims on the instruments assets and cashflows. The tranches have different seniorities: senior tranche, the least risky tranche in CDOs with lowest fixed interest rate, followed by mezzanine tranche, junior mezzanine tranche, and finally the first loss piece or equity tranche. A CDO makes payments on a sequential basis, depen- ding on the seniority of tranches within the capital struc- ture of the CDO. The more senior the tranches investors are in, the less risky the investment and hence the less they will be paid in interest. The way it works is fre- quently referred to as a “waterfall” or cascade of cash- flows. We well give a specific illustration in Section 3. In perfect capital markets, CDOs would serve no pur- pose; the costs of constructing and marketing a CDO would inhibit its creation. In practice, however, CDOs address some important market imperfections. First, ban- ks and certain other financial institutions have regulatory capital requirements that make it valuable for them to securitize and sell some portion of their assets, reducing the amount of (expensive) regulatory capital that they must hold. Second, individual bonds or loans may be illiquid, leading to a reduction in their market values. Securitization may improve liquidity, and thereby raise the total valuation to the issuer of the CDO structure. In light of these market imperfections, at least two classes of CDOs are popular: the balance-sheet CDO and the arbitrage CDO. The balance-sheet CDO, typically in the form of a CLO, is designed to remove loans from the Figure 1.Cashflow colateralised mortgage obligation. Copyright © 2010 SciRes IIM 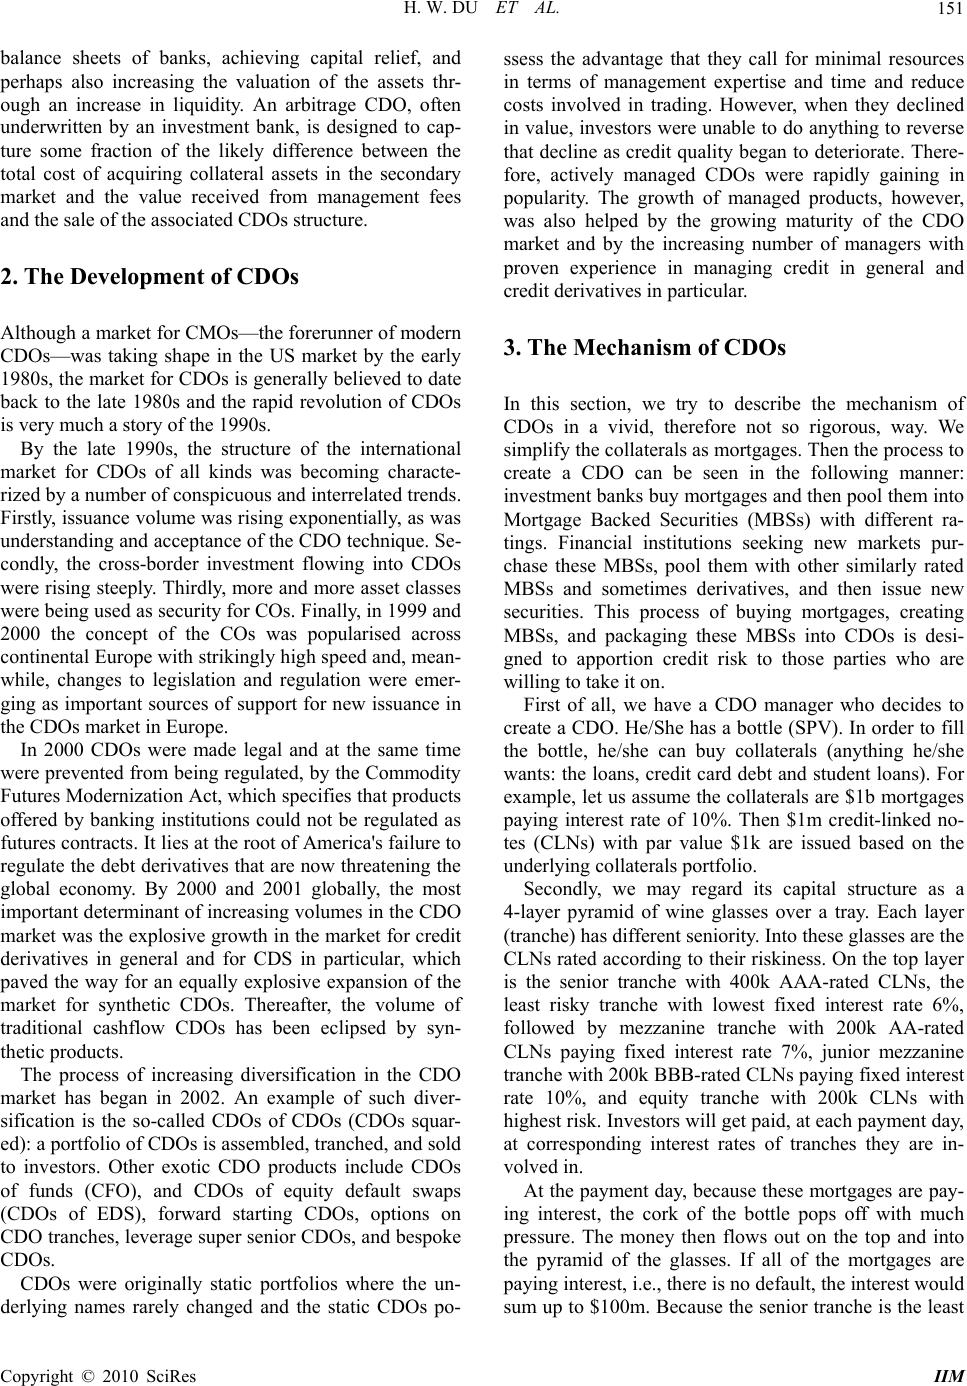 H. W. DU ET AL. 151 balance sheets of banks, achieving capital relief, and perhaps also increasing the valuation of the assets thr- ough an increase in liquidity. An arbitrage CDO, often underwritten by an investment bank, is designed to cap- ture some fraction of the likely difference between the total cost of acquiring collateral assets in the secondary market and the value received from management fees and the sale of the associated CDOs structure. 2. The Development of CDOs Although a market for CMOs—the forerunner of modern CDOs—was taking shape in the US market by the early 1980s, the market for CDOs is generally believed to date back to the late 1980s and the rapid revolution of CDOs is very much a story of the 1990s. By the late 1990s, the structure of the international market for CDOs of all kinds was becoming characte- rized by a number of conspicuous and interrelated trends. Firstly, issuance volume was rising exponentially, as was understanding and acceptance of the CDO technique. Se- condly, the cross-border investment flowing into CDOs were rising steeply. Thirdly, more and more asset classes were being used as security for COs. Finally, in 1999 and 2000 the concept of the COs was popularised across continental Europe with strikingly high speed and, mean- while, changes to legislation and regulation were emer- ging as important sources of support for new issuance in the CDOs market in Europe. In 2000 CDOs were made legal and at the same time were prevented from being regulated, by the Commodity Futures Modernization Act, which specifies that products offered by banking institutions could not be regulated as futures contracts. It lies at the root of America's failure to regulate the debt derivatives that are now threatening the global economy. By 2000 and 2001 globally, the most important determinant of increasing volumes in the CDO market was the explosive growth in the market for credit derivatives in general and for CDS in particular, which paved the way for an equally explosive expansion of the market for synthetic CDOs. Thereafter, the volume of traditional cashflow CDOs has been eclipsed by syn- thetic products. The process of increasing diversification in the CDO market has began in 2002. An example of such diver- sification is the so-called CDOs of CDOs (CDOs squar- ed): a portfolio of CDOs is assembled, tranched, and sold to investors. Other exotic CDO products include CDOs of funds (CFO), and CDOs of equity default swaps (CDOs of EDS), forward starting CDOs, options on CDO tranches, leverage super senior CDOs, and bespoke CDOs. CDOs were originally static portfolios where the un- derlying names rarely changed and the static CDOs po- ssess the advantage that they call for minimal resources in terms of management expertise and time and reduce costs involved in trading. However, when they declined in value, investors were unable to do anything to reverse that decline as credit quality began to deteriorate. There- fore, actively managed CDOs were rapidly gaining in popularity. The growth of managed products, however, was also helped by the growing maturity of the CDO market and by the increasing number of managers with proven experience in managing credit in general and credit derivatives in particular. 3. The Mechanism of CDOs In this section, we try to describe the mechanism of CDOs in a vivid, therefore not so rigorous, way. We simplify the collaterals as mortgages. Then the process to create a CDO can be seen in the following manner: investment banks buy mortgages and then pool them into Mortgage Backed Securities (MBSs) with different ra- tings. Financial institutions seeking new markets pur- chase these MBSs, pool them with other similarly rated MBSs and sometimes derivatives, and then issue new securities. This process of buying mortgages, creating MBSs, and packaging these MBSs into CDOs is desi- gned to apportion credit risk to those parties who are willing to take it on. First of all, we have a CDO manager who decides to create a CDO. He/She has a bottle (SPV). In order to fill the bottle, he/she can buy collaterals (anything he/she wants: the loans, credit card debt and student loans). For example, let us assume the collaterals are $1b mortgages paying interest rate of 10%. Then $1m credit-linked no- tes (CLNs) with par value $1k are issued based on the underlying collaterals portfolio. Secondly, we may regard its capital structure as a 4-layer pyramid of wine glasses over a tray. Each layer (tranche) has different seniority. Into these glasses are the CLNs rated according to their riskiness. On the top layer is the senior tranche with 400k AAA-rated CLNs, the least risky tranche with lowest fixed interest rate 6%, followed by mezzanine tranche with 200k AA-rated CLNs paying fixed interest rate 7%, junior mezzanine tranche with 200k BBB-rated CLNs paying fixed interest rate 10%, and equity tranche with 200k CLNs with highest risk. Investors will get paid, at each payment day, at corresponding interest rates of tranches they are in- volved in. At the payment day, because these mortgages are pay- ing interest, the cork of the bottle pops off with much pressure. The money then flows out on the top and into the pyramid of the glasses. If all of the mortgages are paying interest, i.e., there is no default, the interest would sum up to $100m. Because the senior tranche is the least Copyright © 2010 SciRes IIM  H. W. DU ET AL. 152 risky, it gets paid first ($24m). After the senior tranche gets filled up first, the mezzanine tranche ($14m) and then the junior mezzanine tranche ($20m) get filled up in turn. Equity tranche on the bottom is still filled up with payment of $42m, resulting in up to 21% return rate. (cf. Figure 2 below) However, if defaults happen among these mortgages in the bottle, the cashflow of interest would decrease, for instance, let us say only $50m interests are paid (cf. Figure 3 below). Figure 2. Cashflow of a CDO under no defaults. Figure 3. Cashflow of a CDO under 50% defaults. Copyright © 2010 SciRes IIM  H. W. DU ET AL. 153 In this situation, the senior tranche still gets paid in full first ($24m); mezzanine tranche get paid $14m; yet the junior mezzanine tranche only gets paid $12m gene- rating 6% return rate less then 10% as expected; nothing can be paid to the equity tranche holders. If we complicate the situation further by thinking of another manager who also decides to create a CDO. Instead of filling the bottle with mortgages, he decides to fill with these MBSs (the first CDO). The second manager then takes the glasses from the bottom layer (equity tranche) in the previous CDO. In the boom, it will be no problem whenever everyone is paying their mortgages in the first bottle and these glasses are ge- nerating payment in payment day. Both pyramids of glasses are full. However, with 50% defaults, the bottom glasses in the first pyramid are not filled up. At payment day of the second CDO, the cork pops off and generates zero. In this case, even nothing is filled at the top glasses of the second CDO, they are still rated AAA, as if they were safe as the original assets. In the situation that housing market persists weak and people default or stop paying mortgages, there will be less and less money come out from the first bottle into the pyramid of glasses, and less and less money these AAA highly rated securities in the second CDO would make. Thousands of millions of dollars have been invested into this kind of secondary CDOs. Similarly, a third CDO can be created, which repa- ckage MBSs in the first and second CDO. Then, a fourth, a fifth, , and so on. We can easily imagine the much more complicated situation if we refer to the volume of the CDOs market. Many investment banks are involved in the enormous web by the CDOs contracts. This is the right problem. Investors have packed a lot of funds with these securities which are now not paying anything and liable never to pay anything again. Many financial situations start to teeter because of being tied in numbers of contracts. They cannot unravel these deals. One failure in the web starts to drag down the rest of the system and suck people down in the end. Nobody knows how big it is, how far it is and who are actually involved. We only find out whenever a company began to collapse, suddenly, the second finds itself was dragged with it and then the third, the forth and so on. That's the situation we are exactly in today. 4. The Current Financial Crisis The current unprecedented financial crisis started from the US subprime mortgage financial crisis, and spreaded and accelerated by the securitisation of subprime mort- gages into credit derivatives, especially into kinds of CDOs. As the crisis develops, the real economy has been been obviously seen severely affected since late 2008. Alongside the stock bubble of mid-1990s, the US housing bubble grew up and began to burst in early 2007 as the building boom led to so much over-supply that house prices could no longer be supported, which evo- lved into the so-called US subprime mortgage financial crisis. The over expansion of credit in US housing market led to losses by financial institutions. Initially the companies affected were those directly involved in home cons- truction and mortgage lending such as the Northern Rock and Countrywide Financial. Take Northern Rock, a ma- jor British bank, as an example. It raises most of the money, which it provides for mortgages via the whole- sale credit market, primarily by selling the debt on in the form of bonds. Following the widespread losses made by investors in the subprime mortgage market, these banks and investors have become wary of buying mortgage debt, including Northern Rock's. The highly leveraged nature of its business led the bank to request security from the Bank of England. News of this lead to investors panic and a bank run in mid-September 2007. Northern Rock's problems proved to be an early indication of the severe troubles that would soon befall other banks and financial institutions. The crisis then began to affect general availability of credit to non-housing related businesses and to large financial institutions not directly connected with mor- tgage lending. It is the “securitisation” process, which spreads the current crisis. Many subprime mortgages were securitised and sold to investors using asset-backed securities (ABSs). It has been estimated that 54% of subprime mortgages were securitised in 2001 and this rose to 75% in 2006 [1]. At the heart of the portfolios of many financial institutions were investors whose assets had been derived from bundled home mortgages. In early 2007, when defaults were rising in the mor- tgage market, New York's Wall Street began to feel the first tremors in the CDOs world. Hedge fund managers, commercial and investment banks, and pension funds, all of which had been big buyers of CDOs, found them- selves landed in trouble, as many CDOs included deri- vatives that were built upon mortgages—including risky, subprime mortgages. More importantly, the mathematical models that were supposed to protect investors against risk weren’t working. The complicating matter was that there was no market on which to sell the CDOs. CDOs are not traded on exchanges and even not really stru- ctured to be traded at all. If one had a CDO in his/her portfolio, then there was not much he/she could do to unload it. The CDO managers were in a similar bind. As fear began to spread, the market for CDOs' underlying assets also began to disappear. Suddenly it was impo- ssible to dump the swaps, subprime-mortgage derivatives, and other securities held by the CDOs. Copyright © 2010 SciRes IIM  H. W. DU ET AL. 154 In March 2008, slightly more than a year after the first indicator of troubles in the CDO market, Bear Stearns, which was one of Wall Street's biggest and most pres- tigious firms and which had been engaged in the secu- ritisation of mortgages, fell prey and was acquired by JP Morgan Chase through the deliberate assistance from the US government. By the middle of 2008, it became clear that no one was safe; everyone—even those who had never invested in anything—would wind up paying the price. On September 15, 2008, the 158 year-old Lehman Brothers filed for Chapter 11 bankruptcy protection. The collapse of Lehman Brothers is the largest investment bank failure since Drexel Burnham Lambert in 1990 and triggered events that seemed unthinkable a year before: the high volatility of worldwide financial institutions, massive state-funded bailouts of some of the world's leading financial institutions and the disappearance of investment banks. The 94 year-old Merrill Lynch accepted a purchase offer by Bank of America for approximately US$ 50 billion, a big drop from a year-earlier market valuation of about US$ 100 billion. A credit rating downgrade of the large insurer American International Group (AIG) led to a rescue agreement on September 16, 2008 with the Federal Reserve Bank for a $ 85 billion dollar secured loan facility, in exchange for a warrants for 79.9% of the equity of AIG. Even, in January 2009, HBOS, a banking and insurance group in UK, was taken over by Lloyds TSB Banking Group. The crisis is now much far beyond the virtual economy, the real economy has been severely affected. The global economy is in the midst of a deep downturn. The dra- matic intensification of the financial crisis has generated historic declines in consumer and business confidence, steep falls in household wealth, and severe disruptions in credit intermediation. In the last quarter of 2008, industrial production has fallen precipitously across both advanced and emerging economies, declining by some 15%–20% and merchan- dise exports have fallen by some 30%–40%, at an annual rate. Official figures show that the Britain industrial production dived at record speed, underlying how hard the global downturn has hit producers and exporters: manufacturing outputs dropped by 2.9% in January, 2009, taking annual rate of decline to 12.8%, which is the biggest decline since January, 1981; broader industrial productions, including mining and utilities, are now also falling at an annual rate of 11.4%, again the worst since 1981. Labor markets are weakening rapidly, particularly in those advanced economies. In February, 2009, the US unemployment rate rose to 8.1%, the highest in more than 25 years and more layoffs are on the way; the Britain unemployment rate rose to 6.3%, up 1.1% on 2008, and the Euro unemployment rate rose to 8.2%, the highest level in over 2 years. Despite production cut-backs by OPEC, oil prices have declined by nearly 70% since their July 2008 peak. Similarly, metals prices are now around 50% below their March 2008 peaks. Food prices have eased 35% from their peak, reflecting not only deteriorating global cyc- lical conditions, but also favorable harvests. Clearly, the global economy faces a contraction in ov- erall Gross Domestic Product (GDP) for the first time since the Second World War, as claimed by Dominique Strauss-Kahn, the head of the International Monetary Fund (IMF). 5. Mathematical Challenges in Modeling the Mechanism of CDOs The investment banks presented CDOs as investments in which, actually, the key factors were not the underlying assets, rather the use of mathematical calculations to create and distribute the cash flows. In other words, the basis of a CDO was not a mortgage, a bond or even a derivative, but the metrics and algorithms of quants and traders. In particular, the CDO market skyrocketed in 2001 with the invention of a formula called the Gaussian Copula, which made it easier to price CDOs quickly. But what seemed to be the great strength of CDOs—complex formulas that protected against risk while generating high returns—turned out to be flawed. Normally financial institutions do not trade instru- ments unless they have satisfactory models for valuing them. What is surprising about the financial crisis is that financial institutions were prepared to trade senior tranches of an ABS (i.e., an asset-backed security) or an ABS CDO (an instrument in the synthetic CDOs market) without a model [1]. The lack of a model makes risk management almost impossible and causes problems when the instrument ceases to be rated. Because models were not developed, the key role of correlation in valuing ABSs and (particularly) ABS CDOs was not well understood. Many investors and analysts assumed that CDOs were diversified, and hence made less risky, due to the large number of individual bonds that might underlie a given deal. In fact, the investments within the CDOs turned out to be more highly correlated than expected. Pricing a CDO is mainly to find the appropriate spread for each tranche and its difficulty lies in how to estimate the default correlation in formulating models that fit market data. With the empirical evidence of the existence of mean reversion phenomena in efficient credit risk markets, mean-reverting type stochastic differential equations are considered (cf. e.g. [2]). In addition, the CDOs market has seen the phenomenon of heavy tail dependence in a portfolio, which draws the attention to use modeling with heavy tail phenomenon as a feature. Besides, the efficiency in calibrating pricing models to Copyright © 2010 SciRes IIM  H. W. DU ET AL. 155 market prices should be paid much attention. A well- calibrated and easily implemented model is the right goal. The market standard model is the so-called one factor Gaussian copula model. Its origins can be found in [3,4]. The assumptions of the one factor Gaussian copula model about the characteristics of the underlying portfolio simplify the analytical derivation of CDOs premiums but are not very realistic. Thereafter more and more extensions have been proposed to pricing CDOs: homogeneous infinite portfolio is extended to homogen- eous finite portfolio, and then to heterogeneous finite portfolio which represents the most real case; multi- factor models are considered other than one factor model; Gaussian copula is replaced by alternative probability distribution functions; the assumptions of constant defau- lt probability, constant default correlation and determi- nistic loss given default are relaxed and stochastic ones are proposed which incorporate dynamics into pricing models. In one line of thinking, to relax the assumption of Gaussian distribution in the one factor Gaussian copula model, student-t copula [5–12], double-t copula [13,14], Clayton copula [12,15–20], Archimedian copula [21,22], Marshall Olkin copula [23–26] are studied. And default correlations are made stochastic and correlated with the systematic factor in [27,28] to relax the assumption that default correlations are constant through time and independent of the firms default probabilities. Hull and White propose the implied copula method in [29]. In the other line of thinking, many stochastic processes are applied in CDOs pricing models to describe the de- fault dependence. Markov chains are used to represent the distance to default of single obligor (eg. [30,31]). Then correlation among obligors is introduced with nonrecom- bining trees [30] or via a common time change of affine type [31]. Some researchers include jumps in CDOs pricing mo- del. Duffie and Garleanu [32], for example, propose an approach based on affine processes with both a diffusion and a jump components. To improve tractability, Chapo- vsky, Rennie and Tavares [33] suggest a model in which default intensities are modeled as the the sum of a compensated common random intensity driver with trac- table dynamics (e.g. the Cox-Ingersoll-Ross model (or CIR model in short) with jumps) and a deterministic name-depended function. Motivated by the possibility that price processes could be pure jump, several authors have focused their att- ention on pure jump models in the Lévy class. Firstly, we have the Normal Inverse Gaussian (NIG) model of Barndorff-Nielsen [34], and its generalisation to the generalised hyperbolic class by Eberlein, Keller, and Prause [35]. Kalemanova, Schmid and Werner [36] and Guégan and Houdain [37] work with NIG factor model. Secondly, we have the symmetric Variance Gamma (VG) model studied by Madan and Seneta [38] and its asy- mmetric extension studied by Madan and Milne [39], Madan, Carr, and Chang [40]. Baxter [41] introduces the B-VG model where has both a continuous Brownian motion and a discontinuous variance—Gamma jump terms. Finally, we have the model developed by Carr, Geman, Madan, and Yor (acronym: CGMY) [42], which further generalises the VG model. Most of these models are special cases of the generic one-factor Lévy model supposed in [43]. Lévy models bring more flexibility into the dependence structure and allow tail dependence. Besides default dependence, the recovery rate is also an important variable in pricing CDOs. Empirical reco- very rate distributions in [44] have high variance and the certainty with which one can predict recovery is quite low. One undisputed fact about recovery rates is that average recovery rates tend to be inversely related to default rates: in a bad year, not only are there many defaults, but recoveries are also low. The loss process models involve the development of a model for the evolution of the losses on a portfolio. Graziano and Rogers [45] provide semi-analytic formulas via Markov chain and Laplace transform techniques which are both fast and easy to implement. In [46], Schoenbucher deri- ves the loss distribution of the portfolio from the tran- sition rates of an auxiliary time-inhomogeneous Markov chain and stochastic evolution of the loss distribution is obtained by equipping the transition rates with stochastic dynamics. Other loss process can be found in [47] where discuss a dynamic discrete-time multi-step Markov loss model and in [48] where loss follows a jump process. 6. Modeling Heavy Tail Phenomena by Lévy Distributions From the mathematical view point, we see the highly complexity and chaotic dynamics in the system of CDOs, and, especially, the phenomenon of heavy tail depend- ence. In literatures, researchers have investigated quite a lot of models in pricing CDOs, but seldom incorporate Lévy stable distributions to represent the heavy tail dependence in the modeling. In this final section, we shall explicate and suggest an idea about applying Lévy stable distributions in pricing CDOs. Historically, the application of probability distribu- tions in mathematical modeling for the real world problems started with the use of Gaussian distributions to express errors in measurement. Concurrently with this, mathematical statistics emerged. The mean of a Gaussian distribution traditionally represents the most probable value for the actual size and the variance of it is related to the errors of the measurement. The whole distribution is in fact a prediction which is easy to check, since it was Copyright © 2010 SciRes IIM 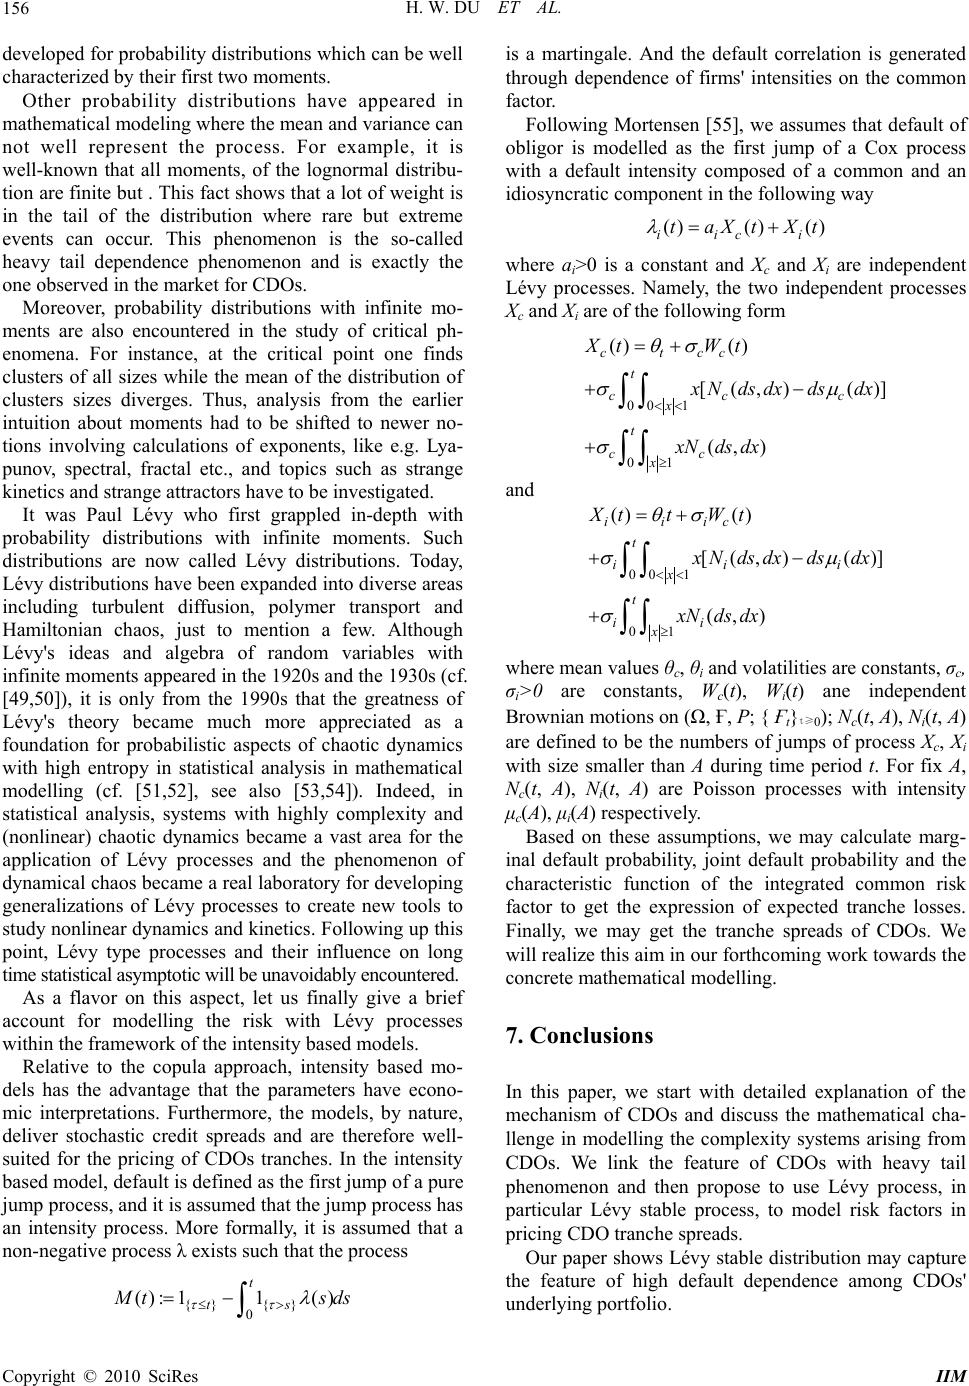 H. W. DU ET AL. 156 developed for probability distributions which can be well characterized by their first two moments. Other probability distributions have appeared in mathematical modeling where the mean and variance can not well represent the process. For example, it is well-known that all moments, of the lognormal distribu- tion are finite but . This fact shows that a lot of weight is in the tail of the distribution where rare but extreme events can occur. This phenomenon is the so-called heavy tail dependence phenomenon and is exactly the one observed in the market for CDOs. Moreover, probability distributions with infinite mo- ments are also encountered in the study of critical ph- enomena. For instance, at the critical point one finds clusters of all sizes while the mean of the distribution of clusters sizes diverges. Thus, analysis from the earlier intuition about moments had to be shifted to newer no- tions involving calculations of exponents, like e.g. Lya- punov, spectral, fractal etc., and topics such as strange kinetics and strange attractors have to be investigated. It was Paul Lévy who first grappled in-depth with probability distributions with infinite moments. Such distributions are now called Lévy distributions. Today, Lévy distributions have been expanded into diverse areas including turbulent diffusion, polymer transport and Hamiltonian chaos, just to mention a few. Although Lévy's ideas and algebra of random variables with infinite moments appeared in the 1920s and the 1930s (cf. [49,50]), it is only from the 1990s that the greatness of Lévy's theory became much more appreciated as a foundation for probabilistic aspects of chaotic dynamics with high entropy in statistical analysis in mathematical modelling (cf. [51,52], see also [53,54]). Indeed, in statistical analysis, systems with highly complexity and (nonlinear) chaotic dynamics became a vast area for the application of Lévy processes and the phenomenon of dynamical chaos became a real laboratory for developing generalizations of Lévy processes to create new tools to study nonlinear dynamics and kinetics. Following up this point, Lévy type processes and their influence on long time statistical asymptotic will be unavoidably encountered. As a flavor on this aspect, let us finally give a brief account for modelling the risk with Lévy processes within the framework of the intensity based models. Relative to the copula approach, intensity based mo- dels has the advantage that the parameters have econo- mic interpretations. Furthermore, the models, by nature, deliver stochastic credit spreads and are therefore well- suited for the pricing of CDOs tranches. In the intensity based model, default is defined as the first jump of a pure jump process, and it is assumed that the jump process has an intensity process. More formally, it is assumed that a non-negative process λ exists such that the process {}{ } 0 ():11( ) t ts M ts is a martingale. And the default correlation is generated through dependence of firms' intensities on the common factor. Following Mortensen [55], we assumes that default of obligor is modelled as the first jump of a Cox process with a default intensity composed of a common and an idiosyncratic component in the following way ()() () iic i taXtXt where ai>0 is a constant and Xc and Xi are independent Lévy processes. Namely, the two independent processes Xc and Xi are of the following form 00 1 01 () () [(,)()] (, ) ctcc t cc c x t cc x Xt Wt x Ndsdx dsdx xNds dx and 00 1 01 () () [(,) ()] (, ) iiic t ii i x t ii x Xtt Wt x Ndsdx dsdx xNds dx where mean values θc, θi and volatilities are constants, σc, σi>0 are constants, Wc(t), Wi(t) ane independent Brownian motions on (Ω, Ғ, P; { Ғt}t≥0); Nc(t, A), Ni(t, A) are defined to be the numbers of jumps of process Xc, Xi with size smaller than A during time period t. For fix A, Nc(t, A), Ni(t, A) are Poisson processes with intensity μc(A), μi(A) respectively. Based on these assumptions, we may calculate marg- inal default probability, joint default probability and the characteristic function of the integrated common risk factor to get the expression of expected tranche losses. Finally, we may get the tranche spreads of CDOs. We will realize this aim in our forthcoming work towards the concrete mathematical modelling. 7. Conclusions In this paper, we start with detailed explanation of the mechanism of CDOs and discuss the mathematical cha- llenge in modelling the complexity systems arising from CDOs. We link the feature of CDOs with heavy tail phenomenon and then propose to use Lévy process, in particular Lévy stable process, to model risk factors in pricing CDO tranche spreads. ds Our paper shows Lévy stable distribution may capture the feature of high default dependence among CDOs' underlying portfolio. Copyright © 2010 SciRes IIM  H. W. DU ET AL. 157 8. Acknowledgments We would like to thank Claire Geleta of Deutsche Bank Trust Company Americas at Los Angeles for useful conversation regarding to CDOs. We also thank the referee for constructive comments on our previous ma- nuscript. 9. References [1] J. Hull, “The credit crunch of 2007: What went wrong? Why? What lessons can be learned?” Working Paper, University of Toronto, 2008. [2] J. L.Wu and W. Yang, “Pricing CDO tranches in an intensity-based model with the mean-reversion app- roach,” Working Paper, Swansea University, 2009. [3] O. Vasicek, “Probability of loss on a loan portfolio,” Working Paper, KMV (Published in Risk, December 2002 with the title Loan Portfolio Value), 1987. [4] D. X. Li, “On default correlation: A Copula approach,” Journal of Fixed Income, Vol. 9, No. 4, pp. 43–54, 2000. [5] L. Andersen, J. Sidenius, and S. Basu, “All your hedges in one basket,” Risk, pp. 67–72, 2003. [6] S. Demarta and A. J. McNeil, “The t copula and related copulas,” International Statistical Review, Vol. 73, No. 1, pp. 111–129, 2005. [7] P. Embrechts, F. Lindskog, and A. McNeil, “Modelling dependence with Copulas and applications to risk mana- gement,” In Handbook of Heavy Tailed Distributions in Finance, edited by S. Rachev, Elsevier, 2003. [8] R. Frey and A. J. McNeil, “Dependent defaults in models of portfolio credit risk,” Journal of Risk, Vol. 6, No. 1, pp. 59–92, 2003. [9] A. Greenberg, R. Mashal, M. Naldi, and L. Schloegl, “Tuning correlation and tail risk to the market prices of liquid tranches,” Lehman Brothers, Quantitative Research Quarterly, 2004. [10] R. Mashal and A. Zeevi, “Inferring the dependence stru- cture of financial assets: Empirical evidence and imp- lications,” Working paper, University of Columbia, 2003. [11] R. Mashal, M. Naldi, and A. Zeevi, “On the dependence of equity and asset returns,” Risk, Vol. 16, No. 10, pp. 83–87, 2003. [12] L. Schloegl and D. O’Kane, “A note on the large homo- geneous portfolio approximation with the student-t Co- pula,” Finance and Stochastics, Vol. 9, No. 4, pp. 577– 584, 2005. [13] J. Hull and A. White, “Valuation of a CDO and an n-th to default CDS without Monte Carlo simulation,” Journal of Derivatives, Vol. 12, No. 2, pp. 8–23, 2004. [14] A. Cousin and J. P. Laurent, “Comparison results for credit risk portfolios,” Working Paper, ISFA Actuarial School, University of Lyon and BNP-Paribas, 2007. [15] P. Schönbucher and D. Schubert, “Copula dependent default risk in intensity models,” Working Paper, Bonn University, 2001. [16] J. Gregory, and J. P. Laurent, “I will survive,” Risk, Vol. 16, No. 6, pp. 103–107, 2003. [17] E. Rogge and P. Schönbucher, “Modelling dynamic port- folio credit risk,” Working Paper, Imperial College, 2003. [18] D. B. Madan, M. Konikov, and M. Marinescu, “Credit and basket default swaps,” The Journal of Credit Risk, Vol. 2, No. 2, 2006. [19] J. P. Laurent and J. Gregory, “Basket default swaps, CDOs and factor copulas,” Journal of Risk, Vol. 7, No. 4, pp. 103–122, 2005. [20] A. Friend and E. Rogge, “Correlation at first sight,” Eco- nomic Notes, Vol. 34, No. 2, pp. 155–183, 2005. [21] P. Schönbucher, “Taken to the limit: Simple and not- so-simple loan loss distributions,” Working Paper, Bonn University, 2002. [22] T. Berrada, D. Dupuis, E. Jacquier, N. Papageorgiou, and B. Rémillard, “Credit migration and basket derivatives pricing with copulas,” Journal of Computational Finance, Vol. 10, pp. 43–68, 2006. [23] D. Wong, “Copula from the limit of a multivariate binary model,” Working Paper, Bank of America Corporation, 2000. [24] Y. Elouerkhaoui,. “Credit risk: Correlation with a diffe- rence,” Working Paper, UBS Warburg, 2003. [25] Y. Elouerkhaoui, “Credit derivatives: Basket asympto- tics,” Working Paper, UBS Warburg, 2003. [26] K. Giesecke, “A simple exponential model for dependent defaults,” Journal of Fixed Income, Vol. 13, No. 3, pp. 74–83, 2003. [27] L. Andersen and J. Sidenius, “Extensions to the Gaussian copula: Random recovery and random factor loadings,” Journal of Credit Risk, Vol. 1, No. 1, pp. 29–70, 2005. [28] L. Schloegl, “Modelling oorrelation skew via mixing Copula and uncertain loss at default,” Presentation at the Credit Workshop, Isaac Newton Institute, 2005. [29] J. Hull and A. White, “Valuing credit derivatives using an implied copula approach,” Journal of Derivatives, Vol. 14, No. 2, pp. 8–28, 2006. [30] C. Albanese, O. Chen, A. Dalessandro, and A. Vidler, “Dynamic credit correlation modeling,” Working Paper, Imperial College, 2005. [31] T. R. Hurd and A. Kuznetsov, “Fast CDO computations in affine Markov chains models,” Working Paper, McMaster University, 2006. [32] D. Duffie and N. Gârleanu, “Risk and valuation of collateralized debt obligations,” Financial Analysts Jour- nal, Vol. 57, No. 1, pp. 41–59, 2001. [33] A. Chapovsky, A. Rennie and P. A. C. Tavares, “Sto- chastic intensity modeling for structured credit exotics,” Working paper, Merrill Lynch International, 2006. Copyright © 2010 SciRes IIM  H. W. DU ET AL. Copyright © 2010 SciRes IIM 158 [34] O. E. Barndorff-Nielsen, “Processes of normal inverse Gaussian type,” Finance and Stochastics, Vol. 2, No. 1, pp. 41–68, 1998. [35] E. Eberlein, U. Keller and K. Prause, “New insights into smile, mispricing and value at risk,” Journal of Business, Vol. 71, No. 3, pp. 371–406, 1998. [36] A. Kalemanova, B. Schmid and R. Werner, “The Normal Inverse Gaussian distribution for synthetic CDO pricing,” Journal of Derivatives, Vol. 14, No. 3, pp. 80–93, 2007. [37] Guégan and Houdain, “Collateralized debt obligations pricing and factor models: A new methodology using Normal Inverse Gaussian distributions,” Note the rech- erche IDHE-MORA, ENS Cachan, No. 007-2005, 2005. [38] D. B. Madan and E. Seneta, “The Variance Gamma (V.G.) model for share market returns,” Journal of Business, Vol. 63, No. 4, pp. 511–24, 1990. [39] D. B. Madan and F. Milne, “Option pricing with V.G. martingale components,” Mathematical Finance, Vol. 1, No. 4, pp. 39–55, 1991. [40] D. B. Madan, P. Carr and E. C. Chang, “The variance gamma process and option pricing,” European Finance Review, Vol. 2, No. 1, pp. 79–105, 1998. [41] M. Baxter,. “Lévy process dynamic modeling of single- name credits and CDO tranches,” Working Paper, Nomu- ra International, 2006. [42] P. Carr, H. Geman, D. Madan, and M. Yor, “The fine structure of asset returns: An empirical investigation,” Journal of Business, Vol. 75, No. 2, pp. 305–332, 2002. [43] H. Albrecher, S. A. Landoucette, and W. Schoutens, “A generic one-factor Lévy model for pricing synthetic CDOs,” In: Advances in Mthematical Fiance, R. J. Elliott et al. (eds.), Birkhäuser, Boston, 2007. [44] Gupton and Stein, “Losscalc: Moody's model for pre- dicting loss given default(LGD),” Working Paper, Moody’s Investor sevices, 2002. [45] G. Graziano and L. C. G. Rogers, “A dynamic approach to the modeling of correlation credit derivatives using markov chains,” Working Paper, University of Cambridge, 2005. [46] P. Schönbucher, “Portfolio losses and the term structure of loss transition rates: A new methodology for the pri- cing portfolio credit derivatives,” Working Paper, ETH Zurich, 2006. [47] M. Walker, “Simultaneous calibration to a range of portfolio credit derivatives with a dynamic discrete-time multi-step loss model,” Working Paper, University of Toronto, 2007. [48] F. Longstaff and A. Rajan, “An empirical analysis of the pricing of collateralized debt obligations,” Journal of Finance, Vol. 63, No. 2, pp. 529–563, 2008. [49] P. Lévy, “Calcul des probabilités,” Gauther-Villars, 1925. [50] P. Lévy, “Théorie de l'addition des variables aléatoires,” Gauther-Villars, 1937. [51] G. Samorodnitsky and M. S. Taqqu, “Stable non-Gau- ssian random processes: Stochastic models with infinite variance,” Chapman and Hall/CRC, Boca Raton, 1994. [52] M. F. Shlesinger, G. M. Zaslavsky, and U. Frisch (Eds.), “Lévy flights and related topics in physics,” Lecture Notes in Physics, Vol. 450, Springer-Verlag, Berlin, 1995. [53] B. Mandelbrot, “The Pareto-Lévy law and the distribution of income,” International Economic Review, Vol. 1, pp. 79–106, 1960. [54] V. M. Zolotarev, “One-dimensional stable distributions,” American Mathematical Society, R. I. Providence, 1986. [55] A. Mortensen, “Semi-analytical valuation of basket credit derivatives in intensity-based models,” Journal of Deri- vatives, Vol. 13, No. 4, pp. 8–26, 2006. |