Paper Menu >>
Journal Menu >>
 Intelligent Information Management, 2010, 2, 120-133 doi:10.4236/iim.2010.22015 Published Online February 2010 (http://www.scirp.org/journal/iim) Copyright © 2010 SciRes IIM Text Extraction in Complex Color Document Images for Enhanced Readability P. Nagabhushan, S. Nirmala Department of Studies in Computer Science, University of Mysore, Mysore, India Email: pnagabhushan@compsci.uni-mysore.ac.in, nir_shiv_200 2@yahoo.co.in Abstract Often we encounter documents with text printed on complex color background. Readability of textual con- tents in such documents is very poor due to complexity of the background and mix up of color(s) of fore- ground text with colors of background. Automatic segmentation of foreground text in such document images is very much essential for smooth reading of the document contents either by human or by machine. In this paper we propose a novel approach to extract the foreground text in color document images having complex background. The proposed approach is a hybrid approach which combines connected component and texture feature analysis of potential text regions. The proposed approach utilizes Canny edge detector to detect all possible text edge pixels. Connected component analysis is performed on these edge pixels to identify can- didate text regions. Because of background complexity it is also possible that a non-text region may be iden- tified as a text region. This problem is overcome by analyzing the texture features of potential text region corresponding to each connected component. An unsupervised local thresholding is devised to perform fore- ground segmentation in detected text regions. Finally the text regions which are noisy are identified and re- processed to further enhance the quality of retrieved foreground. The proposed approach can handle docu- ment images with varying background of multiple colors and texture; and foreground text in any color, font, size and orientation. Experimental results show that the proposed algorithm detects on an average 97.12% of text regions in the source document. Readability of the extracted foreground text is illustrated through Opti- cal character recognition (OCR) in case the text is in English. The proposed approach is compared with some existing methods of foreground separation in document images. Experimental results show that our approach performs better. Keywords: Color Document Image, Complex Background, Connected Component Analysis, Segmentation of Text, Texture Analysis, Unsupervised Thresholding, OCR 1. Introduction Most of the information available today is either on pa- per or in the form of still photographs, videos and elec- tronic medium. Rapid development of multimedia tech- nology in real life has resulted in the enhancement of the background decoration as an attempt to make the docu- ments more colorful and attractive. Presence of uniform or non-uniform background patterns, presence of multi- ple colors in the background, mix up of foreground text color with background color in documents make the documents more attractive but deteriorates the readability. Some of the examples are advertisements, news paper articles, decorative postal envelopes, magazine pages, decorative letter pads, grade sheets and story books of children. Further, the background patterns opted in the preparation of power point slides appear to be attractive but cause difficulty in reading the contents during pres- entation on the screen. These compel to devise methods to reduce the adverse effect of background on the fore- ground without losing information in the foreground. There are many applications in document engineering in which automatic detection and extraction of fore- ground text from complex background is useful. These applications include building of name card database by extracting name card information from fanciful name cards, automatic mail sorting by extracting the mail ad- dress information from decorative postal envelopes [1]. If the text is printed on a clean background then certainly OCR can detect the text regions and convert the text into ASCII form [2]. Several commercially available OCR products perform this; however they result in low recog- nition accuracy when the text is printed against shaded and/or complex background.  P. NAGABHUSHAN AND S. NIRMALA 121 The problem of segmentation of text information from complex background in document images is difficult and still remains a challenging problem. Development of a generic strategy or an algorithm for isolation of fore- ground text in such document images is difficult because of high level of variability and complexity of the back- ground. In the past, many efforts were reported on the foreground segmentation in document images [3–16]. Thresholding is the simplest method among all the methods reported on extraction of foreground objects from the background in images. Sezgin and Sankur [14] carried out an exhaustive survey of image thresholding methods. They categorized the thresholding methods according to the information they are exploiting, such as histogram shape based methods, clustering based meth- ods, entropy based methods, object-attributes based methods, spatial methods and local methods. The choice of a proper algorithm is mainly based on the type of im- ages to be analyzed. Global thresholding [7,11] tech- niques extract objects from images having uniform background. Such methods are simple and fast but they cannot be adapted in case the background is non uniform and complex. Local thresholding methods are window based and compute different threshold values to different regions in the image [8,14] using local image statistics. The local adaptive thresholding approaches are also window based and compute threshold for each pixel us- ing local neighborhood information [9,13]. Trier and Jain [17] evaluated 11 popular local thresholding methods on scanned documents and reported that Niblack’s method [9] performs best for OCR. The evaluation of local methods in [17] is in the context of digit recognition. Sauvola and Pietikainen [13] proposed an improved ver- sion of Niblack method especially for stained and badly illuminated document images. The approaches proposed in [9,13] are based on the hypothesis that the gray values of text are close to 0 (black) and background pixels are close to 255 (white). Leedham et al. [8] evaluated the performance of five popular local thresholding methods on four types of “difficult” document images where con- siderable background noise or variation in contrast and illumination exists. They reported that no single algo- rithm works well for all types of image. Another draw- back of local thresholding approaches is that the proc- essing cost is high. Still there is a scope to reduce the processing cost and improve the results of segmentation of foreground text from background by capturing and thresholding the regions containing text information. Often we encounter the documents with font of any color, size and orientation. Figure 1 shows some sample color document images where the foreground text varies in color, size and orientation. Conventional binarization methods assume that the polarities of the foreground and background intensity are known apriori; but practically it is not possible to know foreground and background color intensity in advance. This drawback of conventional thresholding methods call for specialized binarization. Text-regions in a document image can be detected ei- ther by connected component analysis [3,18] or by tex- ture analysis method [1,19]. The connected component based methods detect the text based on the analysis of ( a ) ( b ) ( c ) ( d ) Figure 1. Color documents with printed text of different size, color and orientation. the geometrical arrangement of the edges [16] that com- pose the characters. They are simple to implement and detect text at faster rate but are not very robust for text localization and also result in false text regions for im- ages having complex background. Pietik¨ainen and Okun [12] used edge detectors to extract the text from docu- ment images. Their method fails in extracting the tilted text lines and erroneously classifies the textured back- ground as text. Chen et al. [3] proposed a method to de- tect the vertical and horizontal edges in an image. They used different dilation operators for these two kinds of edges. Real text regions are then identified using support vector machine. The method lacks in detecting text tilted in any orientation. Zhong et al. [18] used edge informa- tion to detect the text lines. Their method deals with complex color images pretty well but restricted to certain size constraints on characters. The texture based methods detect the text regions based on the fact that text and background have different textures [1]. In [19] it is as- sumed that text is aligned horizontally or vertically and text font size is in limited range. The method proposed in [19] uses texture features to extract text but fails in case Copyright © 2010 SciRes IIM 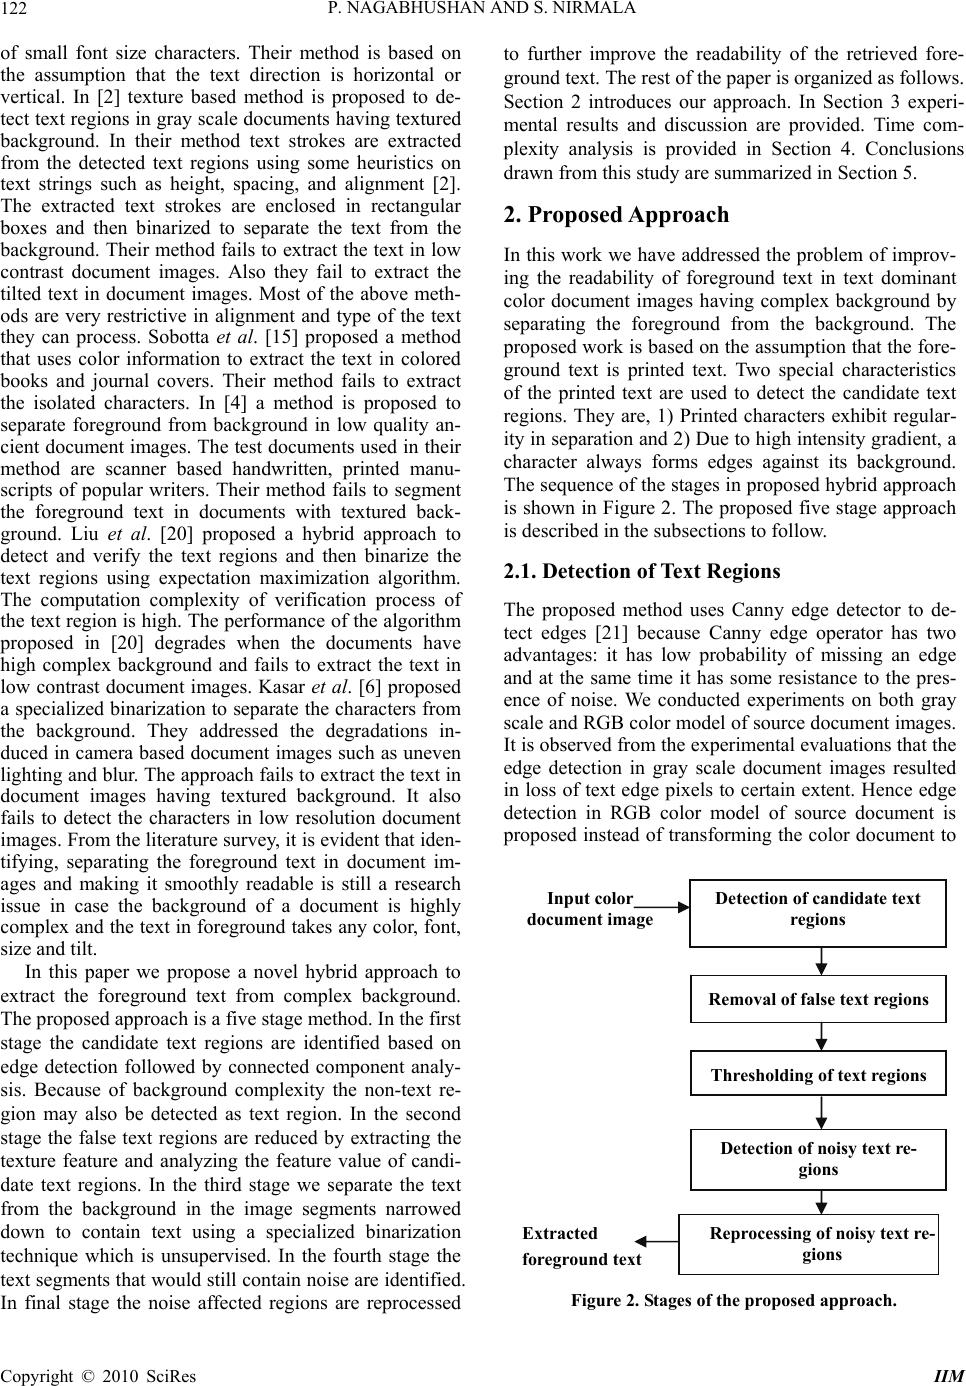 P. NAGABHUSHAN AND S. NIRMALA 122 of small font size characters. Their method is based on the assumption that the text direction is horizontal or vertical. In [2] texture based method is proposed to de- tect text regions in gray scale documents having textured background. In their method text strokes are extracted from the detected text regions using some heuristics on text strings such as height, spacing, and alignment [2]. The extracted text strokes are enclosed in rectangular boxes and then binarized to separate the text from the background. Their method fails to extract the text in low contrast document images. Also they fail to extract the tilted text in document images. Most of the above meth- ods are very restrictive in alignment and type of the text they can process. Sobotta et al. [15] proposed a method that uses color information to extract the text in colored books and journal covers. Their method fails to extract the isolated characters. In [4] a method is proposed to separate foreground from background in low quality an- cient document images. The test documents used in their method are scanner based handwritten, printed manu- scripts of popular writers. Their method fails to segment the foreground text in documents with textured back- ground. Liu et al. [20] proposed a hybrid approach to detect and verify the text regions and then binarize the text regions using expectation maximization algorithm. The computation complexity of verification process of the text region is high. The performance of the algorithm proposed in [20] degrades when the documents have high complex background and fails to extract the text in low contrast document images. Kasar et al. [6] proposed a specialized binarization to separate the characters from the background. They addressed the degradations in- duced in camera based document images such as uneven lighting and blur. The approach fails to extract the text in document images having textured background. It also fails to detect the characters in low resolution document images. From the literature survey, it is evident that iden- tifying, separating the foreground text in document im- ages and making it smoothly readable is still a research issue in case the background of a document is highly complex and the text in foreground takes any color, font, size and tilt. In this paper we propose a novel hybrid approach to extract the foreground text from complex background. The proposed approach is a five stage method. In the first stage the candidate text regions are identified based on edge detection followed by connected component analy- sis. Because of background complexity the non-text re- gion may also be detected as text region. In the second stage the false text regions are reduced by extracting the texture feature and analyzing the feature value of candi- date text regions. In the third stage we separate the text from the background in the image segments narrowed down to contain text using a specialized binarization technique which is unsupervised. In the fourth stage the text segments that would still contain noise are identified. In final stage the noise affected regions are reprocessed to further improve the readability of the retrieved fore- ground text. The rest of the paper is organized as follows. Section 2 introduces our approach. In Section 3 experi- mental results and discussion are provided. Time com- plexity analysis is provided in Section 4. Conclusions drawn from this study are summarized in Section 5. 2. Proposed Approach In this work we have addressed the problem of improv- ing the readability of foreground text in text dominant color document images having complex background by separating the foreground from the background. The proposed work is based on the assumption that the fore- ground text is printed text. Two special characteristics of the printed text are used to detect the candidate text regions. They are, 1) Printed characters exhibit regular- ity in separation and 2) Due to high intensity gradient, a character always forms edges against its background. The sequence of the stages in proposed hybrid approach is shown in Figure 2. The proposed five stage approach is described in the subsections to follow. 2.1. Detection of Text Regions The proposed method uses Canny edge detector to de- tect edges [21] because Canny edge operator has two advantages: it has low probability of missing an edge and at the same time it has some resistance to the pres- ence of noise. We conducted experiments on both gray scale and RGB color model of source document images. It is observed from the experimental evaluations that the edge detection in gray scale document images resulted in loss of text edge pixels to certain extent. Hence edge detection in RGB color model of source document is proposed instead of transforming the color document to Input color document image Detection of candidate text regions Removal of false text regions Thresholding of text regions Detection of noisy text re- gions Reprocessing of noisy text re- gions Extracted foreground text Figure 2. Stages of the proposed approach. Copyright © 2010 SciRes IIM 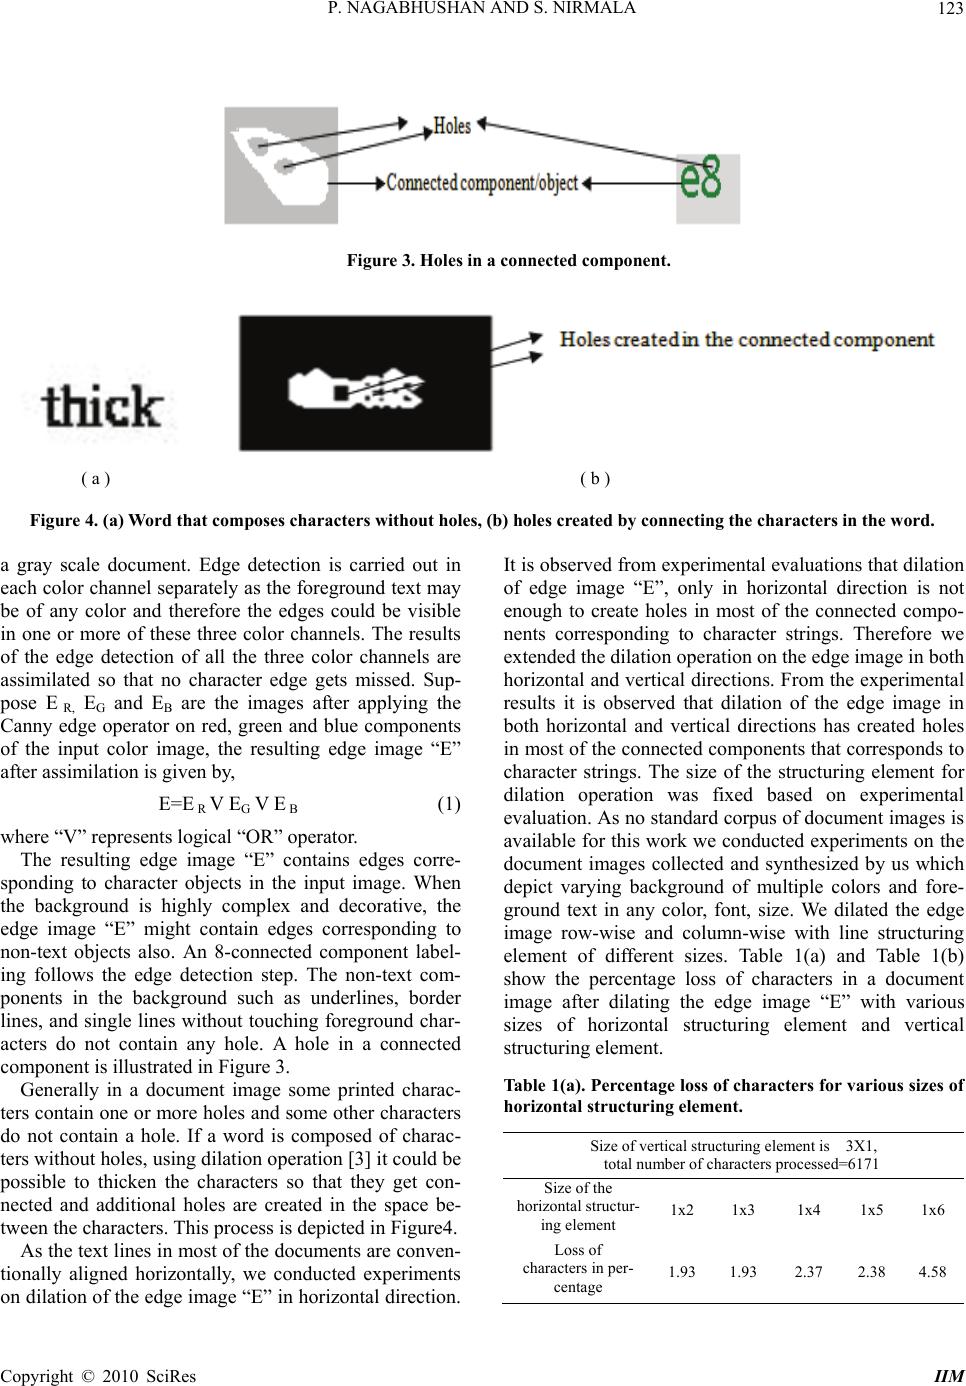 P. NAGABHUSHAN AND S. NIRMALA Copyright © 2010 SciRes IIM 123 Figure 3. Holes in a connected component. ( a ) ( b ) Figure 4. (a) Word that composes characters without holes, (b) holes created by connecting the characters in the word. a gray scale document. Edge detection is carried out in each color channel separately as the foreground text may be of any color and therefore the edges could be visible in one or more of these three color channels. The results of the edge detection of all the three color channels are assimilated so that no character edge gets missed. Sup- pose E R, E G and EB are the images after applying the Canny edge operator on red, green and blue components of the input color image, the resulting edge image “E” after assimilation is given by, E=E R V EG V E B (1) where “V” represents logical “OR” operator. The resulting edge image “E” contains edges corre- sponding to character objects in the input image. When the background is highly complex and decorative, the edge image “E” might contain edges corresponding to non-text objects also. An 8-connected component label- ing follows the edge detection step. The non-text com- ponents in the background such as underlines, border lines, and single lines without touching foreground char- acters do not contain any hole. A hole in a connected component is illustrated in Figure 3. Generally in a document image some printed charac- ters contain one or more holes and some other characters do not contain a hole. If a word is composed of charac- ters without holes, using dilation operation [3] it could be possible to thicken the characters so that they get con- nected and additional holes are created in the space be- tween the characters. This process is depicted in Figure4. As the text lines in most of the documents are conven- tionally aligned horizontally, we conducted experiments on dilation of the edge image “E” in horizontal direction. It is observed from experimental evaluations that dilation of edge image “E”, only in horizontal direction is not enough to create holes in most of the connected compo- nents corresponding to character strings. Therefore we extended the dilation operation on the edge image in both horizontal and vertical directions. From the experimental results it is observed that dilation of the edge image in both horizontal and vertical directions has created holes in most of the connected components that corresponds to character strings. The size of the structuring element for dilation operation was fixed based on experimental evaluation. As no standard corpus of document images is available for this work we conducted experiments on the document images collected and synthesized by us which depict varying background of multiple colors and fore- ground text in any color, font, size. We dilated the edge image row-wise and column-wise with line structuring element of different sizes. Table 1(a) and Table 1(b) show the percentage loss of characters in a document image after dilating the edge image “E” with various sizes of horizontal structuring element and vertical structuring element. Table 1(a). Percentage loss of characters for various sizes of horizontal structuring element. Size of vertical structuring element is 3X1, total number of characters processed=6171 Size of the horizontal structur- ing element 1x2 1x3 1x4 1x5 1x6 Loss of characters in per- centage 1.931.93 2.37 2.384.58 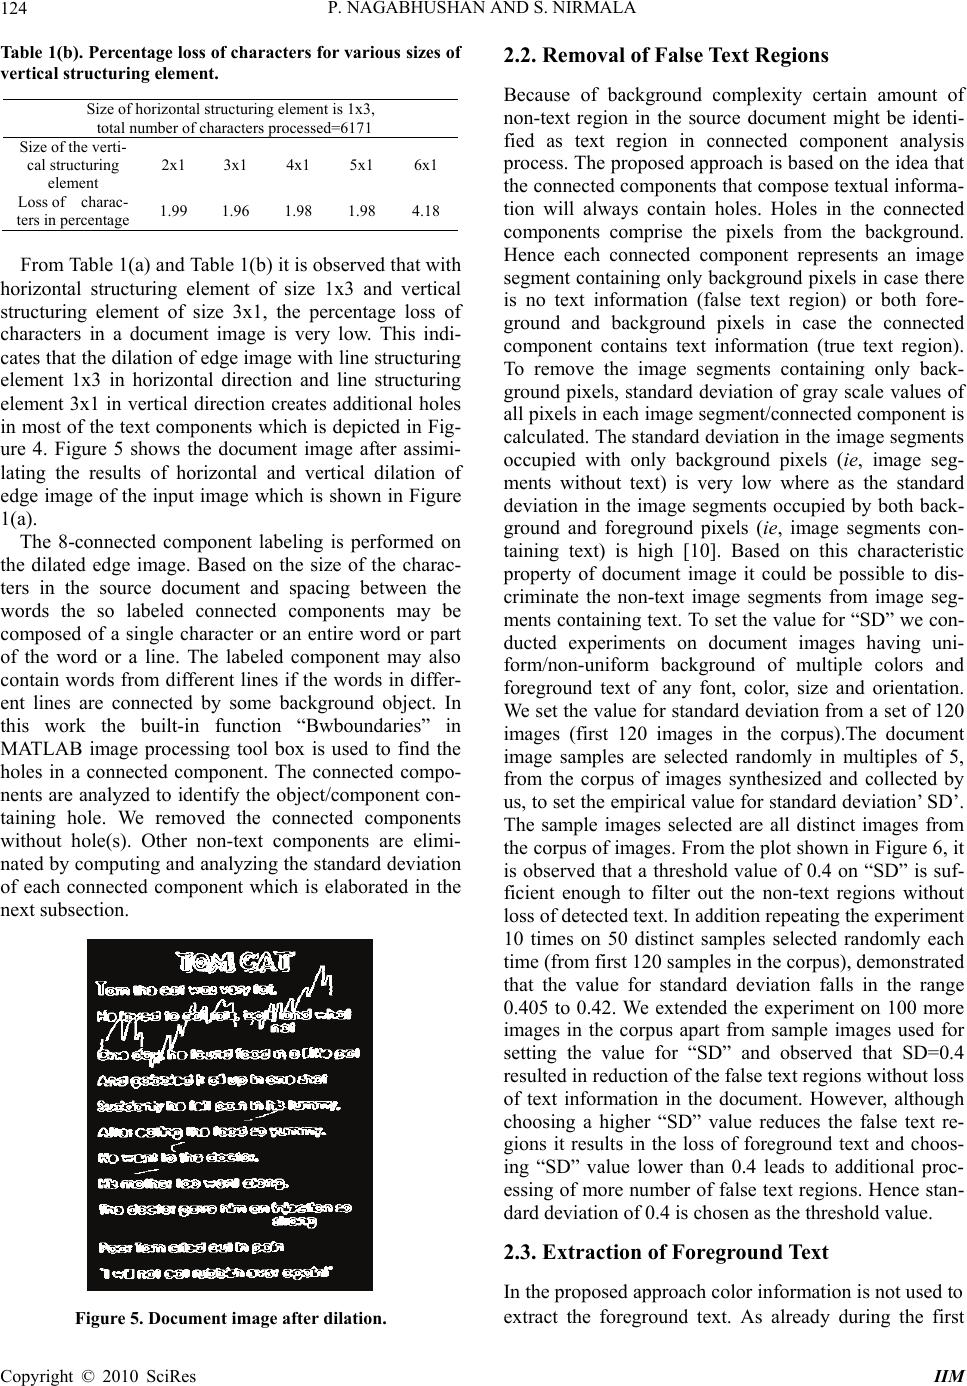 P. NAGABHUSHAN AND S. NIRMALA 124 Table 1(b). Percentage loss of characters for various sizes of vertical structuring element. Size of horizontal structuring element is 1x3, total number of characters processed=6171 Size of the verti- cal structuring element 2x1 3x1 4x1 5x1 6x1 Loss of charac- ters in percentage 1.99 1.96 1.98 1.98 4.18 From Table 1(a) and Table 1(b) it is observed that with horizontal structuring element of size 1x3 and vertical structuring element of size 3x1, the percentage loss of characters in a document image is very low. This indi- cates that the dilation of edge image with line structuring element 1x3 in horizontal direction and line structuring element 3x1 in vertical direction creates additional holes in most of the text components which is depicted in Fig- ure 4. Figure 5 shows the document image after assimi- lating the results of horizontal and vertical dilation of edge image of the input image which is shown in Figure 1(a). The 8-connected component labeling is performed on the dilated edge image. Based on the size of the charac- ters in the source document and spacing between the words the so labeled connected components may be composed of a single character or an entire word or part of the word or a line. The labeled component may also contain words from different lines if the words in differ- ent lines are connected by some background object. In this work the built-in function “Bwboundaries” in MATLAB image processing tool box is used to find the holes in a connected component. The connected compo- nents are analyzed to identify the object/component con- taining hole. We removed the connected components without hole(s). Other non-text components are elimi- nated by computing and analyzing the standard deviation of each connected component which is elaborated in the next subsection. Figure 5. Document image after dilation. 2.2. Removal of False Text Regions Because of background complexity certain amount of non-text region in the source document might be identi- fied as text region in connected component analysis process. The proposed approach is based on the idea that the connected components that compose textual informa- tion will always contain holes. Holes in the connected components comprise the pixels from the background. Hence each connected component represents an image segment containing only background pixels in case there is no text information (false text region) or both fore- ground and background pixels in case the connected component contains text information (true text region). To remove the image segments containing only back- ground pixels, standard deviation of gray scale values of all pixels in each image segment/connected component is calculated. The standard deviation in the image segments occupied with only background pixels (ie, image seg- ments without text) is very low where as the standard deviation in the image segments occupied by both back- ground and foreground pixels (ie, image segments con- taining text) is high [10]. Based on this characteristic property of document image it could be possible to dis- criminate the non-text image segments from image seg- ments containing text. To set the value for “SD” we con- ducted experiments on document images having uni- form/non-uniform background of multiple colors and foreground text of any font, color, size and orientation. We set the value for standard deviation from a set of 120 images (first 120 images in the corpus).The document image samples are selected randomly in multiples of 5, from the corpus of images synthesized and collected by us, to set the empirical value for standard deviation’ SD’. The sample images selected are all distinct images from the corpus of images. From the plot shown in Figure 6, it is observed that a threshold value of 0.4 on “SD” is suf- ficient enough to filter out the non-text regions without loss of detected text. In addition repeating the experiment 10 times on 50 distinct samples selected randomly each time (from first 120 samples in the corpus), demonstrated that the value for standard deviation falls in the range 0.405 to 0.42. We extended the experiment on 100 more images in the corpus apart from sample images used for setting the value for “SD” and observed that SD=0.4 resulted in reduction of the false text regions without loss of text information in the document. However, although choosing a higher “SD” value reduces the false text re- gions it results in the loss of foreground text and choos- ing “SD” value lower than 0.4 leads to additional proc- essing of more number of false text regions. Hence stan- dard deviation of 0.4 is chosen as the threshold value. 2.3. Extraction of Foreground Text I n the proposed approach color information is not used to e xtract the foreground text. As already during the first Copyright © 2010 SciRes IIM  P. NAGABHUSHAN AND S. NIRMALA Copyright © 2010 SciRes IIM 125 Figure 6. Plot showing the number of training sample images versus the SD value for no loss of textual information. scale intensity values (gray value near to 0 for fore- ground pixels and gray value 255 for background pixels) are assigned to pixels in the output image. Irrespective of the foreground text color and background color we pro- duced black characters on uniform white background by suitably thresholding each image segment containing text and producing the corresponding output image segment Obw using the logic as given by, stage of our approach the evidences of textual edges have been drawn from intensity values of each color channel (RGB model). Also it is computationally inexpensive to threshold the gray scale of the image segment corre- sponding to the connected component by tightly encap- sulating the segment. Figure 7 illustrates background and foreground pixels in a connected component. In each connected component average gray scale intensity value of foreground pixels and average gray scale intensity value of the background pixels are computed. thresholdyxIif thresholdyxIif OVVif bwbf ),(255 ),(10 Suppose “m” and “s” are mean and standard deviation of gray scale intensities in an image segment corre- sponding to a connected component with hole(s), the threshold value for that segment is derived automatically from the image data as given in [9], thresholdyxIif thresholdyxIif OVVifbwbf),(255 ),(10 Irrespective of the foreground text color and back- ground color the extracted characters are produced in black color on uniform white background for the purpose of improving the readability of the document contents. The resulting image might contain noise in the form of false foreground. This needs reprocessing of the resulting image to further improve the readability of document contents by OCR. threshold=m-k*s (2) where (k) is a control parameter and value of (k) is de- cided based on the average gray scale intensity value of foreground pixels and average gray scale intensity value of background pixels. Suppose “Vf” is average gray scale intensity value of foreground pixels and “Vb” is average gray scale intensity value of background pixels. We con- ducted experiments on document images with varying background and foreground text of different colors. From experimental evaluations it is observed that choosing k=0.05 for Vf >Vb and k=0.4 for Vf ≤Vb results in a better threshold value. In this work to discriminate foreground pixels from background pixels two contrast gray 2.4. Detection of Noisy Text Regions Detection of text areas/segments that need further proc- essing is performed using a simple method. The main idea is based on the fact that the text areas that still con- tain noise include more black pixels on an average in comparison to other text areas/segments. The image is divided into segments of variable sizes; each segment corresponds to one connected component. In each image segment that contains text the density of black pixels, f(S) is computed. Suppose b(S) is frequency of black pixels in an image segment “S” and area(S) is area of image- segment “S”, the density of black pixels in “S” is given by, f(S)= b(S)/area(S) (3) Figure 7. Illustration of foreground and background pixels in a connected component. The segments that satisfy the criterion f(S)>c*d, are  P. NAGABHUSHAN AND S. NIRMALA 126 selected for reprocessing, where “d” is the average den- sity of black pixels of all the image segments containing text. The parameter “c” determines the sensitivity of de- tecting noisy text regions. High value of “c” results in less text segments to be reprocessed. Low value of “c” results in more text segments to be reprocessed which would include the text segments in which noise is al- ready removed. Figure 8 shows the noisy areas to be re- processed for different values of “c”. Optimal value for parameter “c” is selected based on higher character (or word) recognition rate after reprocessing noisy text re- gions in the output document image. We conducted ex- periments on the document images which we collected and synthesized. Table 2 shows the character and word recognition rates in percentage for various values of “c”. It is observed from Table 2 that character (or word) rec- ognition rate is high for value of c<=0.5. Also it is seen from Figure 8 that number of components to be reproc- essed will be less as the value of “c” increases. So 0.5 is chosen as optimal value for parameter c. 2.5. Reprocessing of Noisy Text Regions The selected text segments containing noise in the form of false foreground pixels are reprocessed. Repeating the stage-1 on these text segments leads into text segments of smaller size. These segments are thresholded in the next stage. Since only few text segments are reprocessed instead of all the detected and verified text segments, the computation complexity of the stage-4 reduces substan- tially. In fact, the entire approach can be proposed to be iterative if it is required; but we observed that repeating stage-1 and stage-3 once on noisy regions is more than sufficient which in turn reduces the time complexity of extracting the foreground text from complex background in document images. Figure 9 shows the results at each stage in the proposed approach. 3. Results and Discussions 3.1. Experimental Results Since no standard corpus of document images is avail- able for this work we created a collection of images by scanning the pages from magazines, story books of chil- dren, newspapers, decorative postal envelopes and invi- tation cards. In addition, one more dataset of synthesized images which are of low resolution is created by us. The details of documents in the corpus of images used for testing our proposed algorithm are depicted in Table 3. The number of document images in our datasets is 220 and they are of different resolutions (96x96 DPI, 100x100 DPI, 150x150 DPI and 200x200 DPI). The output image is obtained by depositing the black charac- ters on the white background, irrespective of the back- ground and foreground color in the original document. The performance of text region detection is evaluated in terms of Recall (correct detects/(correct detects + missed detects)) and Precision (correct detects/(correct detects+ false alarms)). Recall is inversely proportional to missed detects whereas Precision is inversely proportional to false alarms. Missed detects indicates number of text regions incorrectly classified as non text and false alarms indicates number of non-text regions incorrectly classi- fied as text regions. Table 4 shows the average value of precision and recall in percentage for document images in the corpus. (a) (b) (c) Figure 8. Noisy text segments selected based on value of c: (a) c=0.5 (b) c=1.0 (c) c=1.5. Table 2. Character and word recognition rates for various values of “c”. c<0.5 c=0.5 c=1.0 c=1.5 Character recognition rate ( % ) 82.93 82.93 81.26 80.98 Word recognition rate ( % ) 71.33 71.33 70.10 67.38 Copyright © 2010 SciRes IIM  P. NAGABHUSHAN AND S. NIRMALA 127 Input image (a) (b) (c) (d) (e) Figure 9. Result at each stage using proposed algorithm. (a) candidate text regions, (b) verified text regions, (c) extracted foreground text with noisy areas, (d) detection of noisy text segments (c=0.5), (e) extracted foreground text after reprocessing noisy text segments. The proposed approach focuses on documents with English as text medium because we could quantify the performance of the improvement in the readability of document images by employing an OCR. Reading of the extracted text for documents in English as text medium is evaluated on Readiris 10.04 pro OCR. Readiris OCR converts the input document image to binary form before recognizing the characters. The Readiris 10.04 pro OCR can tolerate a skew of 0.5 degrees on foreground text. Readability of the segmented foreground text is evalu- ated in terms of character and word recognition rates. OCR results for document images with printed English text are tabulated in Table 5. From Table 5 it is seen that average recognition rate at character level is higher compared to word level. Observations from the experimental evaluation are as Copyright © 2010 SciRes IIM  P. NAGABHUSHAN AND S. NIRMALA 128 Table 3. Details of document collection used for this work. Document types Language Background complexity Foreground complexity 1) Pages from Magazines 2) Pages from Story books of children 3) Postal envelopes 4) Articles from newspapers 5) Power point slides 6) Journal cover pages 7) Invitation cards Mainly in Eng- lish. Also in other languages 1) Uniform patterned back- ground 2) Non uniform patterned background 3) Background designs from Microsoft power point 4) Single and multicolored background 1) Single colored and mul- ticolored text 2) Text tilted in any orien- tation 3) Text of varying sizes 4) Foreground with dense text and sparse text Table 4. Results showing text region detection. Documents in English language Documents in Kannada language Documents in Malayalam language Number of samples 180 30 10 Total number of characters 31784 4710 1068 Total number of words 6354 1200 317 Recall ( % ) 97.06 96.26 100 Precision ( % ) 96.78 95.1 90.23 Number of characters (or words) correctly recognized Character (or word) recognition rate= Total number of characters (or words) in source document image Table 5. OCR results for English documents. Average Recognition Rates (%) Original document Processed document After further processing the noisy areas in the processed document Character level 42.99 80.31 82.93 Word level 36.47 67.55 71.33 follows: For some document images the readability by the OCR without using our approach is 100% and the same is maintained even after applying our approach. [The proposed approach has not deteriorated the readability!]. For rest of the documents due to high complexity of the background the readability through OCR is very low or even nil. After applying our approach the readability of document contents by OCR is improved to nearly 100%. From Table 5 it is evident that the word and character recognition rates are enhanced after applying our ap- proach. Further, it can be noted that readability is further improved after reprocessing the noisy areas in the output document images. Many times the text lines in a document are tilted /rotated as an attempt to make the contents of the docu- ment more attractive. We extended our approach to ex- tract the foreground text in document images with text lines tilted in any orientation. From experimental results it is evident that dilation of the edge image “E” in hori- zontal and vertical direction is sufficient to identify the text regions in document images having tilted text lines. Sample document images with foreground text lines ti- tled in any orientation and the corresponding results are shown in Figure 10. For documents with English as medium of text, we were able to quantify the enhanced readability through OCR and for documents in other languages we verified the extracted foreground text by visual inspection of output images, which indicates successful segmentation of foreground text from complex background. Figure 11 shows results of the proposed approach for documents in Malayalam and Kannada languages. 3.2. Discussions Results of the proposed approach are compared with results of some existing methods of foreground separa- tion in document images [6,9,13]. For a sample text rich document image and sparse text document image the output images obtained from the proposed method and other methods [6,9,13] are shown in Figure 12(a) and Figure 12(b) respectively. From visual inspection of the results shown in Figure 12(a) and Figure 12(b) it is observed that, Niblack method fails to separate the foreground from complex background. Kasar method resulted in loss of foreground text information. Even though Sauvola method extracted foreground text, it introduced lot of noise compared to proposed method. Copyright © 2010 SciRes IIM  P. NAGABHUSHAN AND S. NIRMALA 129 (a) (b) Figure 10. Document images with tilted foreground text: (a) Input color image, (b) Output image. (a) (b) (c) (d) Figure 11. Results of the proposed approach: (a,c) Input color images, (b,d) Output images. Copyright © 2010 SciRes IIM  P. NAGABHUSHAN AND S. NIRMALA 130 Input color image Niblack method Sauvola method Kasar method Proposed method Figure 12(a). Comparison of results of foreground text separation from complex background in text rich document image. Input color image Niblack method Sauvola method Kasar method Proposed method Figure 12(b). Comparison of results of foreground text separation from complex background in postal document image. Copyright © 2010 SciRes IIM  P. NAGABHUSHAN AND S. NIRMALA Copyright © 2010 SciRes IIM 131 We created 20 ground truth images by selecting com- plex textures from Microsoft power point designs. On one set of 10 different backgrounds with varying com- plexities the same textual content of 540 characters is superimposed. Similarly on another set of 10 images created, each is superimposed with the same postal ad- dress shown in Figure 12(b). The outcome of the ex- periments on these ground truth images is shown in Ta- ble 6. As the output image produced by Niblack is too noisy the amount of characters recognized by OCR is very less. Kasar method fails to detect the foreground characters in document images having textured back- ground which resulted in loss of text information present in the foreground of the input document image. This leads to very low character recognition accuracy by OCR. As the output images produced by Niblack, Sauvola and Kasar methods are noisier compared to the proposed method the amount of characters recognized by OCR is low which is evident from Table 6. These existing meth- ods do not perform well when documents have tex- tured/patterned background. This drawback is overcome by the proposed method. Yet in another experiment, a set of 10 typical document images from the corpus were tested with Niblack, Sauvola, Kasar and proposed method. The readability of extracted foreground text is evaluated on Readiris pro 10.04 OCR. The number of characters recognized by OCR is described in Table 7. Our approach successfully separates the foreground in document images which are of low resolution and free from degradations such as blur, uneven lighting, and wavy patterned text. From Table 7 it is evident that our approach performs well for complex background color document images compared to the methods [6,9,13] and leads to higher character recognition accuracy through OCR. One advantage of proposed method over the existing conventional approaches is it successfully extracts the foreground text without a prior knowledge of foreground and background polarities. Another advantage over ex- isting methods is it is less expensive as it detects the im- age segments containing text and extracts the text from detected text segments without using the color informa- tion. The approach is independent of medium of fore- ground text as it works on edge information. 4. Time Complexity Analysis Suppose size of the document image is MxN. Accord- ingly the size of RGB color image is 3xMxN. So the total number of pixels in input color image I is 3xMxN. The time complexity of the proposed algorithm in order notation is O(N2) if M=N. For the purpose of profiling Table 6. Details of Foreground text extraction results on ground truth images by OCR. Niblack method Sauvola me- thod Kasar method Proposed method Image type Number of characters CRR (%) CRR (%) CRR (%) CRR (%) Text rich document 540 27.89 89.63 76.33 98.53 Postal document 50 8.60 58.00 27.00 83.00 CRR–Average Character Recognition Rate when output image is OCRed. Table 7. OCR based recognition of characters: Details for 10 test images with complex background. Niblack method Sauvola method Kasar method Proposed method Source of the document image Number of char- acters NCR (%) NCR (%) NCR (%) NCR (%) News paper 483 0 13.66 70.39 97.52 News paper 300 20 99.66 94.00 98.33 Magazine 144 0 0 0 92.36 Invitation card 748 0 98.93 95.45 95.32 Story book 300 0 96.66 44.66 98.66 Story book 440 0 99.09 51.59 99.55 Story book 139 0 97.12 73.38 100 Synthesized image 398 0 0 3.52 93.72 Postal doc. 47 0 0 51.06 100 Postal doc. 50 0 0 0 82 Average 305 2 50.51 48.41 95.75 NCR–Number of characters recognized by OCR.  P. NAGABHUSHAN AND S. NIRMALA 132 Figure 13. Plot showing execution time of each stage in proposed approach. we have kept the size of all the test document images uniform (350x600 pixels). Postal document images con- tain text in sparse i.e., only printed postal address, on an average of 45 characters. Text rich document images contain text in dense, on an average of 200 characters. The algorithm was executed on a Intel(R) Core(TM) 2 Duo CPU, 2.20GHz, 1GB RAM. It is observed that total time needed to extract the foreground text is high for text rich document images compared to sparse text document images. Time needed to process the document depends on the amount of text in the foreground of the source document image. The total time of the entire process includes the time of I/O operations of document images also. Figure 13 shows the plot of execution time of each stage of the proposed approach for document images with varying density of textual information. 5. Conclusions and Future Work In this paper a hybrid approach is presented for extrac- tion of foreground text from complex color document images. The proposed approach combines connected component analysis and texture feature analysis to detect the segments of image containing text. An unsupervised local thresholding method is used to extract the fore- ground text in segments of image containing textual in- formation. A simple and computationally less expensive method for texture analysis of image segments is pro- posed for reduction of false text regions. We have not used color information in extracting the text since in the first stage of our approach the evidence of all textual edges comes from intensity values in each color channel (RGB model) and this makes computations inexpensive. Threshold value to separate the foreground text is de- rived from the image data and does not need any manual tuning. The proposed algorithm detects on an average 97.12% of text regions in source document image. The shortcomings of the proposed approach are 1) it fails to separate the foreground text when the contrast between the foreground and background is very poor 2) it fails to detect single letter word which neither contains a hole nor creates a hole by the dilation. The algorithm has so far been tested on text dominant documents only which are scanned from news papers, magazines, story books of children, postal envelopes. Also we tested the proposed approach on synthesized images. The behavior of the documents containing graphic objects in foreground is considered as future extension of the present work. Design of post processing steps to recover the missed single character words with- out holes is another future direction of the current study. 6. References [1] A. K. Jain and S. K. Bhattacharjee, “Address block loca- tion on envelopes using Gabor filters,” Pattern Recogni- tion, Vol. 25, No 12, pp. 1459–1477, 1992. [2] V. Wu, R. Manmatha, and E. M. Riseman, “Textfinder: An automatic system to detect and recognize text in im- ages,” IEEE PAMI, Vol. 21, No. 11, pp. 1224–1229, 1999. [3] D. Chen, H. Bourland, and J. P. Thiran, “Text identifica- tion in complex background using SVM,” Proceedings of the IEEE Computer Society Conference on Computer Vi- sion and Pattern Recognition, pp. 621–626, 2001. [4] U. Garain, T. Paquet, and L. Heutte, “On foreground- background separation in low quality document images,” International Journal of Document Analysis and Recogni- tion, Vol. 8, No. 1, pp. 47–63, 2006. [5] H. Hase, M. Yoneda, S. Tokai, J. Kato, and C. Y. Suen, “Color segmentation for text extraction,” IJDAR, Vol. 6, No. 4, pp. 271–284, 2003. [6] T. Kasar, J. Kumar, and A. G. Ramakrishnan, “Font and background color independent text binarization,” Pro- ceedings of 2nd International Workshop on Camera Based Document Analysis and Recognition, pp. 3–9, 2007. Copyright © 2010 SciRes IIM  P. NAGABHUSHAN AND S. NIRMALA 133 [7] E. Kavallieratou and E. Stamatatos, “Improving the qual- ity of degraded document images,” Proceedings of 2nd International Conference on Document Image Analysis for Libraries, pp. 340–349, 2006. [8] G. Leedham, Y. Chen, K. Takru, J. H. N. Tan, and L. Mian, “Comparison of some thresholding algorithms for text/background segmentation in difficult document im- ages,” Proceedings of 7th International Conference on Document Analysis and Recognition, pp. 859–864, 2003. [9] W. Niblack, “An introduction to image processing,” Pren- tice Hall, Englewood Cliffs, 1986. [10] S. Nirmala, P. Nagabhushan, “Isolation of foreground- text in document images having known complex back- ground,” Proceedings of 2nd International Conference on Cognition and Recognition, pp. 99–106, 2008. [11] N. Otsu, “A threshold selection method from gray level histograms,” IEEE Transactions on Systems, Man & Cy- bernetics, Vol. 9, No. 1, pp. 62–66, 1979. [12] M. Pietikäinen and O. Okun, “Text extraction from grey scale page images by simple edge detectors,” Proceedings of the 12th Scandinavian Conference on Image Analysis (SCIA), pp. 628–635, 2001. [13] J. Sauvola and M. Pietikäinen, “Adaptive document image binarization,” Pattern Recognition, Vol. 33, No. 2, pp. 225–236, 2000. [14] M. Sezgin and B. Sankur, “Survey over image threshold- ing techniques and quantitative performance evaluation,” Journal of Electronic Imaging, Vol. 13, No. 1, pp. 146– 165, 2004. [15] K. Sobottka, H. Kronenberg, T. Perroud, and H. Bunke, “Text extraction from colored book and journal covers,” IJDAR, Vol. 2, No. 4, pp. 163–176, 1999. [16] C. L. Tan and Q. Yaun, “Text extraction from gray scale document image using edge information,” Sixth Interna- tional Conference on Document Analysis and Recogni- tion, pp. 302–306, 2001. [17] O. D. Trier and A. K. Jain, “Goal directed evaluation of binarization methods,” IEEE PAMI, Vol. 17, No. 12, pp. 1191–1201, 1995. [18] Y. Zhong, K. Karu, and A. K. Jain, “Locating text in complex color images,” Pattern Recognition, Vol. 28, No. 10, pp. 1523–1536, 1995. [19] K. I. Kim, K. Jung, and H. J. Kim, “Texture based ap- proach for text detection in images using support vector machines and continuously adaptive mean shift algo- rithm,” IEEE Transactions on Pattern Analysis and Ma- chine Intelligence, Vol. 25, No. 12, pp. 1631–1639, 2003. [20] Y. Liu, S. Goto, and T. Ikenaga, “A robust algorithm for text detection in color images,” Proceedings of Eighth International Conference on Document Analysis and Recognition, pp. 399–403, 2005. [21] Z. Wang, Q. Li, S. Zhong, and S. He, “Fast adaptive threshold for Canny edge detector,” Proceedings of the SPIE, pp. 501–508, 2005. Copyright © 2010 SciRes IIM |