iBusiness
Vol.3 No.2(2011), Article ID:5461,9 pages DOI:10.4236/ib.2011.32029
Using Deductions from Assessment Studies towards Furtherance of the Academic Program: An Empirical Appraisal of Institutional Student Course Evaluation
![]()
1Office of President, University of Dammam, Dammam, Saudi Arabia; 2Deanship of Quality and Academic Accreditation (DQAA), University of Dammam, Dammam, Saudi Arabia.
Email: dwivedi7@hotmail.com
Received April 4th, 2011; revised May 7th, 2011; accepted May 20th, 2011.
Keywords: Academic Program, Course Evaluation Survey, Likert Type Item, High Quality Performance, Acceptable Performance, Improvement Required Performance
ABSTRACT
The regular evaluation of ongoing activities under academic programs is required evidence towards academic development. Indeed, such evaluations generally involve data collection on a Likert type item as one (strongly disagree) to five (strongly agree). While using arithmetic mean in item by item analysis to derive inferences, as adopted by the National Commission for Assessment and Academic Accreditation (NCAAA), two issues occurred to us, its accuracy as well as usefulness. We took initiatives to also use more appropriate and useful measures to deal with the ordinal scale involved in such data. Surprisingly, a review showed a mixed practice. This article aims to describe and advocate the need of focusing more on such appropriate practices. Such practice extends many-fold benefits: 1) theoretical appropriateness, 2) accuracy in results and related inferences, 3) ease of understanding, 4) useful clues regarding academic improvements, and 5) optimum use of allocated resources.
1. Introduction
1.1. Background
The inferences drawn from analytical results of regular evaluations of academic activities are among the evidence required by academic developers. All institutions, including those having accredited academic programs, must continue with such evaluations, deriving useful clues to sustain quality academic programs. This paper briefly revisits the types of data generated, and argues for appropriate approach in order to derive accurate and un-ambiguous inferences.
Such evaluations generally employ data collection through surveys, using semi-structured questionnaires which are a mix of mostly closed—(items) and a few open-ended questions. Despite the occasional contrary view [1], this practice is worldwide. Examples are seven universities: [2-8]. Here, only issues related to items are addressed.
While developing guidelines for effective evaluation process, three major issues have been listed, viz: accuracy, ease of understanding of produced results, and regular evaluation of the evaluation system [9-12]. Two significant barriers to the effective use of evaluation systems have been reported [13], viz: poor presentation of evaluation data, and their informed interpretation. However, debate on the analysis and related inference appears to lack reference to fundamental considerations in statistics.
Course evaluation questionnaires include items on different aspects such as start of the course, its instructor, department, and overall satisfaction with the course quality. Therefore, item by item analysis can provide valuable inputs to administrators, faculty and students for related academic developments [13].
The arithmetic mean of scores to derive inferences from item by item analysis has been adopted by many institutions, including the National Commission for Academic Accreditation and Assessment [NCAAA], Saudi Arabia. According to related literature review, it is an on-going research and analysis practice [14]. Some universities [4,5,15] use the mean with standard deviation[SD]. Others use it without SD [3,16], sometime also include point wise percentage distribution of students. In order to emphasize appropriate and accurate use of deductions from evaluation studies, we thought it worthwhile to raise two issues. First, inappropriateness of its use, and second, its lack of contribution to applied implications.
To achieve academic development, traditional practice has been to support academic staff [17]. Current practice involves students directly, or, at least listens to their voices on issues related to enhancement and advancement of learning [18-22]. In this regard, course evaluation survey (CES) is one of the important common evaluations by the students [13]. To achieve academic accreditation by the NCAAA, our university has adopted this as an integral part of ongoing evaluation processes.
For institutions looking for enhanced quality in higher education, this paper describes and advocates appropriate approaches to item by item analysis of “Likert type items” while characterizing their assessment data. We outline two added merits: ease of understanding, and clarity towards related outcomes of academic improvements.
1.2 Content Organization
The content organization of the article involves various sections. The next Section 2 “Items and Generated Data” provides information on items in used CES questionnaire and type of collected data. The Section 3 “Appropriate analytical approach” describes issues related to analytical methods of such data. The Section 4 “Exploratory Analysis” presents description of used data and analytical methods. Fifth section, “Results” describes detail results. Sixth section “Authentication of Results” speaks about dissemination of results. Next section “Summary and Conclusions” mainly points out the issues related to implications of considering these analytical methods. The next section relates to acknowledgements. Finally, in the end, references are also listed.
2. Items and Generated Data
All items in the CES questionnaire are typically “Likert type item”, usually having five or seven points [13]. These points indicate the degree of agreement with a statement, in ascending order. The CES questionnaire being used currently at this university has 24 Likert type items (Appendix 1), with five points on each item:
1 = Strongly Disagree 2 = Disagree 3 = True Sometimes 4 = Agree 5 = Strongly Agree A Likert type item has an ordinal scale. A Likert scale consists of many Liket type items measured on the same number of agreement grades [23]. The addition of agreement scores on all such Likert type items in an evaluation questionnaire results in data on a Likert scale, also sometime termed as “summative scale” [15]. One must distinguish between “Likert type item” and “Likert scale”, to be more appropriate in analysis and related inferences. This article addresses issues related to only “Likert type item”.
3. Appropriate Analytical Approach
The use of analytical methods to evaluate a data set should not be guided merely by the observation that “everyone is using it” [14,23]. To be theoretically appropriate, analysis of data is driven by its scales of measurement [24]. Because of the interval scale [25], the Likert scales might be appropriately analyzed using parametric approach (e.g. mean, standard deviation).
However, analysis of a Likert type item is more appropriate when non-parametric approach (e.g. median, quartiles, percentiles) is used. Otherwise it can be deceptive. Indeed, like us, other universities [2,5] have adopted the non-parametric analysis of data on Likert type item. This is sometimes reported along with mean ([5]; and others).
In addition to the above theoretical context, as correctly pointed out by Gob et al., [25], the method for analyzing such evaluation data must include problem solving potential: clarity, exactness, informational value, simplicity and availability. In contrast with parametric approach, non-parametric approach demonstrates these attributes.
Furthermore, parametric approach can distort inference. For an item, the mean of strong disagreements to strong agreements will provide a misleading impression of average agreement. Also, bearing in view the range of the highest possible attainable score, an item having fewer grading points is expected to produce slightly higher mean scores than one having more points [15].
On the other hand, consideration of a grade point(s) as median, quartile, or cumulative percentage with specific grade points will provide more clarity regarding even the threshold of agreement. Informational value of this approach is intuitively better than that of mean. Thus, for the academic developers, the non-parametric approach makes it possible to have clearer understanding of results, and, to derive instant clues to guide future planning.
For quality practice in continuing academic development, the required evidence must be supported by the latest evaluation results. For this, the used analytical methods must be not only theoretically robust but also demonstrate problem solving potential. We emphasize the value of adopting appropriate approaches in analysis of evaluation data, and, their additional benefits. Five of these benefits are: 1) appropriateness in application, 2) accuracy in results and related inferences, 3) ease of understanding, 4) distortion free useful clues for academic improvements, and 5) optimize the use of allocated resources for quality in higher education.
In order to develop and sustain high quality academic programs, institutions must inculcate competitiveness. Genuine comparability must be ensured across the institution. For this, one must adopt and universally use an appropriate practice on evaluation results. This option will be more useful for institutions trying to develop a sustainable system to achieve academic accreditation.
To support our argument, we used exploratory analytical results of CES data from one of our colleges. Further, we reviewed the use of three non-parametric measures that provide clues to administrators and faculty, to continue working with an enhanced target for quality in their courses. To derive more accurate and meaningful inferences from any evaluation, as an effort to improve quality of evidence, it is equally important to plan, and occasionally modify the evaluation process objectively.
4. Analytical Methods
4.1. Data
We have considered available CES data for three first year courses of our B. Sc. Nursing program 2008-2009. They showed broad range of observed ratings, viz: applied medical physics (better), bioethics in nursing (moderate) and chemistry (poor). Their CES coverage of students was 99% (112/113); 98% (113/115); and 100% (111/111) respectively. This coverage was more than two-thirds of the class, ensuring adequate representativeness of students’ evaluation data [26]. The analysis was carried out on the available complete responses.
4.2. Analytical Methods
We used one parametric and three non-parametric measures discussed in the preceding sections [25]:
4.2.1. Parametric Approach
Arithmetic mean. As a convention prescribed by NCAAA, mean agreement by the students for each item, was calculated. The performance of each of the 24 items was then expressed in three bands:
3.6 & Above—High Quality 2.6 - 3.6—Acecptable Less than 2.6—Improvement Required Arithmetic mean is inappropriate for analysis of Likert type item. It is influenced by extreme values of evaluation scores. Because of commonly observed skewness in such data, it is likely to provide underestimation, or overestimation of the results. Hence, if performance grading is based on this score alone, it is also expected to be underestimated, or, overestimated. Furthermore, for an item, the mean of strong disagreements to strong agreements will provide a misleading impression of average agreement. In summary, its meaning neither conveys clarity nor does it support ease of understanding by the academic developers.
4.2.2. Non-Parametric Approach
To cope with inappropriateness of using parametric approach, as well as to discuss added merits in the use of non-parametric approach, following three measures are used:
Median. This measure for an item implies that at least 50% of the students selected that score or higher scores for the corresponding item. Although negligible, if a fraction is encountered, it is rounded off for more clarity to non-statisticians. Considering ultimate goal that at least 50% students reach agreement score 4 or 5 for each item, using the students’ median agreement score, the performance of each item is described in three bands:
| 4 & 5 | High quality |
| 3 | Acceptable |
| 1 & 2 | Improvement required |
In contrast to performance grading based on mean score, the median facilitates understanding by the academic developers.
First quartile. On the lines of median, this implies that at least 75% of the students selected that score or higher scores for the corresponding item. If a fraction is encountered, it may be rounded off. To ensure higher quality, instead of targeting a minimum of 50%, an institution may target enhanced levels of agreement (satisfaction) as at least 75%. Considering ultimate goal that at least 75% students reach satisfaction score 4 or 5 for each item, performance of each item using first quartile is also described:
| 4 & 5 | High quality |
| 3 | Acceptable |
| 1 & 2 | Improvement required |
Its understanding by academic developers is also easy and useful for future improvements. Compared with median, it can identify additional areas for further academic improvements.
Cumulative percentage. As adopted by us and also considered by some global reputed institutions, a cumulative percentage of students with score 4 or 5 itself is listed for each item. To ensure further quality, an enhanced level of students’ satisfaction is now re-set higher as at least 80%, instead of earlier 75%. With the ultimate goal that at least 80% of students reach satisfaction score 4 or 5 for each item, using the listed cumulative percentage itself, performance of each item is described in three bands:
| 80 & above | High quality |
| 60 - 80 | Acceptable |
| Less than 60 | Improvement required |
The cumulative percentage has four advantages. Compared with both median and first quartile, it is a straight forward measure, and clearer to non-statisticians. Thirdly, compared with to first quartile, it can yield additional areas for the attention of academic developers. Finally, for each item, it will help in quantifying increment/decrement in its performance over a period of time.
4.2.3. Pooled Analyses
In the formative stages of academic development, as true for our university, all 24 items are considered to be equally important. Further, each of the courses (3 in this exploration) requires the same level of attention in an academic program (24 × 3 = 72 items). As a pooled result at course level, as well as program level, the distribution of respective total items in relation to levels of performance as per thresholds considered under each of the four measures is considered to discuss comparative results. To emphasize the usefulness of this approach, they are depicted in a figure.
5. Results
The item-by-item analytical results were generated for each course (Table 1), using mean, as well as median, first quartile and cumulative percentage. Although not indicated in this article (Table 1), to ensure swift grasp by administrators, faculty and students, we described performance grading of each item by three colors: gold for high quality, green for acceptable, and red for further improvements required. The pooled results in terms of distribution of total items in relation to their respective performance grading were also considered (not tabulated). Authentication of the results was also achieved through discussion with college administration, and faculty. These are briefly described in successive sections.
5.1. Parametric Approach
Mean
Based on students’ mean agreement score (Table 1), the performance grading of items revealed that the course “applied medical physics” attained high quality performance for all 24 items. Course “bioethics in nursing” required further improvement in all areas (24 items) that currently have acceptable performance. On the other hand, course “chemistry” required improvement in all 24 items, holding the present level of performance as “improvement required”. Also, considering the students’ overall average agreement (item 24), the observations made regarding all three courses remained the same.
One can speculate as follows. Because of considered performance grading levels in terms of mean scores, if inappropriate use of the mean provides an overestimation, then the performance level of related item is more likely to shift towards higher level. When it involves underestimation, the performance level of that item is likely to shift towards lower level. In summary, the correct picture is more likely to be distorted. As a result, this may lead the inappropriate policy implications.
Its literal understanding for an item is not meaningful. For example, regarding students’ overall mean agreement (item 24) for “bioethics in nursing”, the mean of strong disagreements to strong agreements creates a misleading impression of average agreement as 2.7 (Table 1). Literally, average agreement lies between disagreement and true sometimes. Often, its meaning is obscure. Being in the range of 2.6 to 3.6, performance grading of this item emerges as acceptable. This result might have been driven by an overestimation of mean agreement. Thus, the mean fails to support ease of understanding by the academic developers. In summary, mean agreement is neither helpful in its understanding nor in deriving instant clues to guide future improvement.
To conclude, in addition to theoretical compulsion, considering these thoughts also as logical and reasonable, one ought to choose and use one of the non-parametric measures instead of the mean score.
5.2. Non-Parametric Approach
5.2.1. Median
Using this measure, an item being graded as either 4 or 5 by at least 50% of students (Table 1), is considered as high quality performance. The considered performance grading based on median agreement score, compared to mean score, coincidently provided almost identical result. For example, the courses with high, acceptable, and improvement required performances remained the same. Interestingly, from improvement policy point of view, the mean and median provided similar clues. Although it
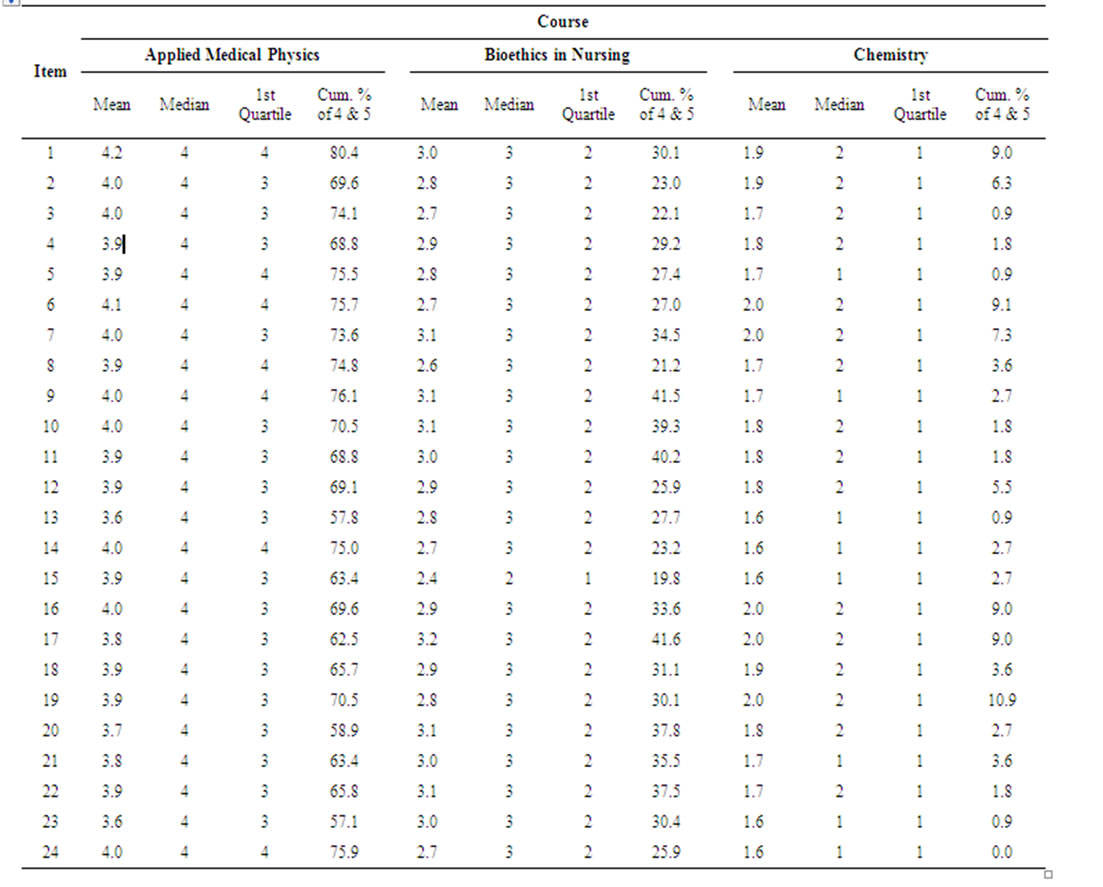
Table 1. Evaluation results of three selected courses.
may not be always true, at this juncture, this may be also seen as a further convincing evidence for the academic developers to shift towards the theoretically appropriate median score, as well as its proposed grading criteria for such evaluation data, instead of the theoretically inappropriate “mean score” and related grading criteria.
In contrast to the mean, its literal understanding is meaningful. For example, regarding students’ overall average agreement (item 24) for “bioethics in nursing”median average of strong disagreements to strong agreements provides a clear impression of agreement as 3 (Table 1). Literally, median agreement is “true sometimes”. At least 50% of students have agreement score as 3 or higher. Further, with median score as 3, performance grading of this item comes as acceptable. Accordingly, it does not distort the findings. In summary, in addition to its theoretical appropriateness, median agreement supports its ease of understanding by the academic developers as well as in deriving instant clues to guide future improvement.
5.2.2. First Quartile
Using this measure, an item being graded as either 4 or 5 by at least 75% students, is considered as high quality performance (Table 1). The considered performance grading based on first quartile score reveals that almost three fourths of items (17 out of 24) under “applied medical physics” declines from high quality to acceptable performance. Further, all the 24 items under “bioethics in nursing” decline from acceptable performance to improvements required. Instead of 50% in case of median, with enhanced target of satisfaction by 75% students, the course “bioethics in nursing” also demands full attention. Intuitively, all the items related to “chemistry” still require full attention.
Like the median score, for an item, literal understanding of first quartile is meaningful. Thus, regarding students’ overall average agreement (item 24) for bioethics in nursing, first quartile also provides a clear impression of agreement as 2 (Table 1). Literally, average agreement comes as disagree. At least 75% of students have agreement score as 2 or higher. Further, performance grading of respective item comes as improvement required. In addition to its theoretical appropriateness, it does not distort the findings. Also, it has ease of understanding by the academic developers as well as helps in deriving instant clues to guide for future improvements.
5.2.3. Cumulative Percentage
To gain further improvements in course quality, grading of an item as 4 or 5 by at least 80% of students (Table 1) is considered as high performance. In comparison to earlier considered non-paramedic measures, further enhancement in quality’s target helps in identifying additional areas for attention from academic developers. For example, under “applied medical physics”, apart form first item, all the items now need further attention (20 with acceptable performance level, and, the remaining three with improvement required level). The other two courses will still need full attention.
Even in comparison with median and first quartile, the literal understanding of cumulative percentage is straight forward, meaningful and exact, in addition to its theoretical appropriateness. For example, regarding students’ overall average agreement (item 24) for “bioethics in nursing”, cumulative percentage provides an exact agreement by only 25.9 % students (Table 1). Being less than 60%, performance grading of this item emerges as improvement required. Accordingly, there is no scope of distortion in the findings. Also, cumulative percentage makes it possible to derive instant clues to guide future improvement.
5.3. Pooled Results
Although not tabulated here, to derive further clues at course level, percentage distribution of 24 items in relation to considered performance grading under each used measure was seen separately for each of the three courses. Likewise, to derive clues at program level, an overall distribution of 72 items was also considered. These results in general reveal that, as the threshold of high quality performance ( % of students grading the item as 4 or 5) increases, % of total items with high quality performance moves from 100 down to 4 for applied medical physics, and, from 34 to 1 for overall. For the other two courses, as observed under performance grading based on mean score, every time % of items with high quality performance remains zero. Further, % of items with acceptable performance goes up from zero to 83 for applied medical physics, and from 33 to 28 overall. Also, % of items with improvement required goes up from zero to 13 for applied medical physics, zero to 100 for bioethics in nursing, and, from 33 to 71 overall. Again, for chemistry, as observed under performance grading based on mean score, % of items with improvement required assessment remains 100 every time.
These results, especially under non-parametric approach, depicted in Figure 1 clearly emphasize again that increased thresholds regarding higher quality performance will help in identifying additional areas that have priority for future improvement. Irrespective of high performance threshold, the course chemistry requires full attention in all respects from their present assessment level “improvements required” to “acceptable” followed by “acceptable” to “high quality”. Further, to achieve high performance threshold as 75% or 80%, another course, bioethics in nursing also needs almost the same level of attention. In order to make 75% or more students satisfied, even under the course applied medical physics, the majority of the items (71%) also require further improvement.
In a logical manner, the items with improvement required level need to be first raised to the level of acceptable performance. Likewise, as a next step, the items with acceptable performance level need to be raised further to the level of high performance. As an effort to continuously pursue sustainable quality in academic development, the sequence of additional clues based on these analytical results also suggest the need of sequential adoption of all the three non-parametric measures.
The overall results further support the need to attract attention of administrators and faculty to pursue further improvement regarding quality courses in particular and quality academic development in general. The presentation of results in this format before administrators, faculty and students are expected to have an added merit in terms of its effectiveness regarding required understand ing and clarity on initiatives for future improvement.
6. Authentication
The CES results were first discussed, without concealing identity of courses, with the college administration (dean and director for quality and planning). Overall, they agreed with the presented course-specific observations. In comparison to performance grading based on mean agreement score, they found better understanding of these results when median, first quartile and cumula-
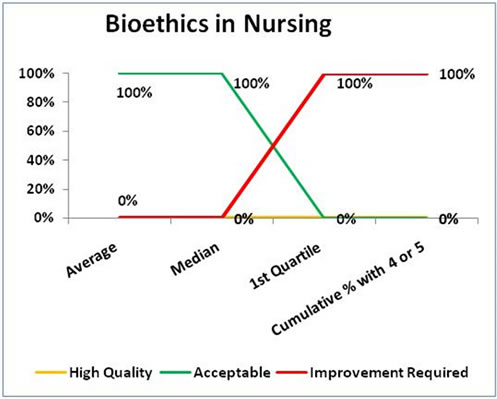
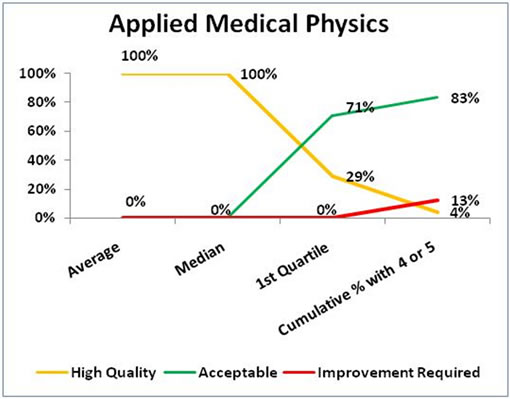
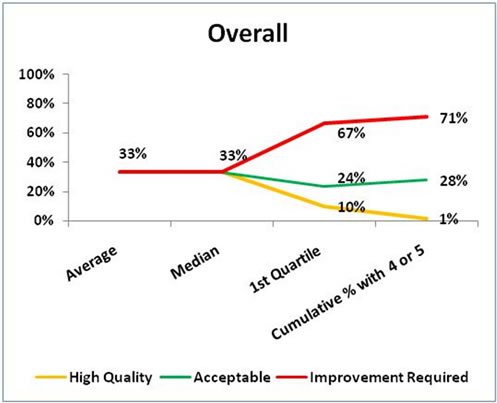
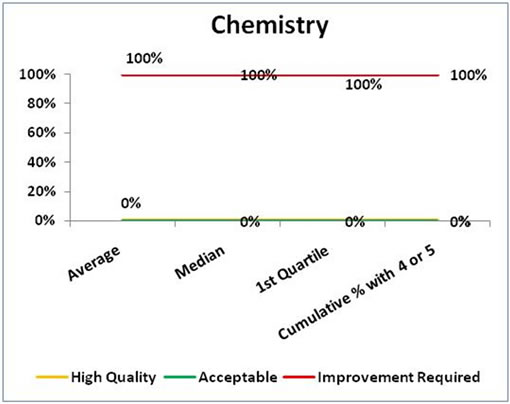
Figure 1. Percentage distribution of items in relation to performance grading.
tive percentage were used. Their usefulness in future planning was equally expressed. They also opined that use of cumulative percentage was straight forward. To their understanding too, its use will be helpful in future monitoring of related progress over a period of time (i.e. time series).
To ensure its positive impact for further improvement, it was agreed that the results related to an individual course, would be shared one-to-one with concerned faculty in disclosed manner by the dean and respective chairperson. It will be made amply clear to all concerned faculty that these observations by the students are designed to aid further improvement. They should not be taken as criticism.
The presentation of these results without identity of courses was also made to course co-coordinators, and faculty, but still waiting for students. They also appreciated and supported the views already expressed by the college administration, especially regarding understanding of the results and their usefulness for future improvement.
7. Summary and Conclusions
The authors have sought to present and reflect on a process of analysis of, and inference from student evaluation data. We aim to maximize appropriateness in dealing with analysis of such data and its usefulness in deriving clues for future improvement. Our primary intention was to develop an analytical strategy which would be uniformly adopted by university colleges as well as administrative units. It aimed to discourage the use of theoretically inappropriate approach, and, also to encourage use of comparatively appropriate approach regarding itemby-item analysis of evaluation data collected on Likert type item. We emphasize that analytical approach to deal with data on Likert type item will not remain same as used in case of dealing with data on Likert scales (simultaneous considerations of a group of Likert type items).
We took help of exploratory analysis of course evaluation survey data of three selected courses in the BSc. Nursing program of the university that demonstrated varying levels of performance. For an item, inappropriately taking the arithmetic mean (parametric approach) of one to five agreement scores (strongly disagree to strongly agree), distorts the existing picture related to that item. Also, it complicates the understanding because of taking mean of strongly disagree to strongly agree.
In contrast, non-parametric approach (median, first quartile and cumulative percentage with score 4 or 5) appropriately makes the understanding much easier, and, implications straight forward. For instance, once percentage of students who are satisfied (agree and strongly agree) with an item is known, to achieve desired high quality performance for that item, the required increase in percentage of such students can be readily derived.
As an added merit, it can help in monitoring quality over a period of time through changed increment or decrement in this percentage. For instant clues, to ensure enhanced understanding as well as usefulness to academic developers, we describe performance levels in color code: high quality as gold, acceptable as green and improvements required as red. Also, presentation of comparative distribution of total items in relation to various performances grading under non-parametric approach further provides additional requirements to achieve related high quality.
In summary, in contrast with the use of parametric approach and related performance grading, the use of non-parametric measures (median, first quartile and cumulative percentage) and related performance grading will ensure theoretically appropriate practice to carry out item by item analysis of evaluation data. It will also help in deriving accurate and meaningful clues for the academic developers. Furthermore, their better understanding will contribute towards related quality improvement. Also, in the process, intuitively it will ensure optimum use of allocated resources. In other words, use of the resources may easily be prioritized for courses involving relatively high proportion of items with lower performance levels.
While discussing issues related to deductions from assessment studies involving Likert type items, we have mainly focused on course evaluation surveys and related exploratory results. These points remain valid to any assessment study involving such items and related itemby-item analysis.
Our observations in this regard are expected to be useful in reminding a larger group of evaluators and researchers in this area about what constitutes good practice. Any constructive queries or comments in this regard may be further helpful. Although issues addressed here seem to be fundamental and well-known, their universal adoption can help to develop various components in a sustainable system for academic development.
8. Acknowledgements
The authors are thankful to the then Dean, College of Nursing; and his colleagues from Quality & Planning Unit, College of Nursing, for their help & cooperation in data collection. Also, helps from Mr. R. Somasundaram, Deanship of Quality & Academic Accreditation (DQAA), UoD, in this regard are duly acknowledged. They are equally thankful to Mr Royes Joseph, DQAA, UoD, for his help in analysis and for typing of the manuscript. Finally, they also thank to all students for their mature, balanced and objective response.
REFERENCES
- R. E. Wright, “Student Evaluations of Faculty: Concerns Raised in the Literature, and Possible Solutions,” College Student Journal, Vol. 40, No. 2, 2006, pp. 417-422.
- Monash University, “Course Experience Questionnaire (CEQ), Management Quality Unit (MQU),” Monash University, 2010. http://opq.edu.au/ mqu/evaluations/ags/ceq.html
- Stanford University, “Interpreting and Working with Your Course Evaluations. The Counter for Teaching and Learning,” 2010. http://ctl.stanford. edu/interpret.pdf
- The University of Sydney, “Reading the Student Course Experience Questionnaire Report,” Institute for Teaching & Learning, 2010. http://www.itl.usyd. edu.au/sceq/reading 1.htm
- The Australian National University, “Course Program Experience Questionnaire 2009,” 2010. http://unistats.anu.edu.au/Pubs/Suveys/CEQ/2009%20CEQ%20-%20All%20Coursework.pdf
- McGill University, “Course Evaluation Questionnaires,” Teaching and Learning Services, 2010. http://www.mcgill.ca/tls/courseevalutions/questionnaires/
- Princeton University, “Mid-Semester Course Evaluations,” The McGraw Center for teaching and learning, 2010. http://www.princeton.edu/mcgraw/library/for-faculty/midcourseevals/Student-Rating-Form.pdf
- University of Washington, “Understanding IAS Course Summary Reports,” Office of Educational Assessmen, 2010. http://www.washington.edu.au/oea/service/course_eval/uw_seattle/course_reports.html
- J. Franklin, “Interpreting the Numbers: Using a Narrative to Help Others Read Student Evaluations of Your Teaching Accurately,” In: K. G. Lewis, Ed., Techniques and Strategies for Interpreting Student Evaluations (Special Issues), New Directions for Teaching and Learning, Vol. 87, 2001, pp. 85-100.
- M. Theall and J. Franklin, “Looking for Bias in All the Wrong Places: A Search for Truth or a Witch Hunt in Student Ratings of Instruction?” In: M. Theall, P. C Abrami and L. A. Mets Eds., The Student Ratings Debate: Are They Valid? How Can We Best Use Them? (Special Issue), New Directions for Institutional Research, Vol. 109, 2001, pp. 45-46.
- M. Theall, “Students Ratings: Myths vs. Research Evidence (2002),” 2008. http://studentratigs.byu.edu/info/faculty/myths.asp
- F. Zableta, “The Use and Misuse of Student Evaluations of Teaching,” Teaching in Higher Education, Vol. 12, No. 1, 2007, pp. 55-76. doi:10.1080/13562510601102131
- P. Gravestock and E. Gregor-Greenleaf, “Student Course Evaluations: Research, Models and Trend,” Higher Education Quality Council of Ontario, Toronto, 2008.
- J. Carifio and R. J. Perla, “Ten Common Misunderstandings, Misconceptions, Persistent Myths and Urban Legends about Likert Scales and Likert Response Formats and Their Antidotes,” Journal of Social Sciences, Vol. 3, No. 3, 2007, pp. 106-116. doi:10.3844/jssp.2007.106.116
- Wikipedia, “Likert Scale,” 2010. http://en.wikipedia.org/wiki/likert_scale
- The George Washington University, “Course Evaluation,” 2010. http://extend.unb.ca /oalp/ oalp_course_eval.php
- M. Healey, K. M. O’Connor and P. Broadfoot, “Refelction on Engaging Student in the Process and Product of Strategy Development for Learning, Teaching, and Assessmen: An Institutional Case Study,” International Journal for Academic Development, Vol. 15, No.1, 2010, pp. 19-32. doi:10.1080/13601440903529877
- F. Campbell, J. Eland, A. Rumpus and R. Shacklock, “Hearing the Students Voice Involving Students in Curriculum Design and Development,” 2009. http://www2.napier.ac.uk/studentvoices/curriculum downloadStudentVoice2009_final .pdf
- J. Case, “Alienation and Engagement: Exploring Students’ Experiences of Studying Engineering,” Teaching in Higher Education, Vol. 12, No. 1, 2007, pp. 119-133. doi:10.1080/13562510601102354
- K. A. Dufy and P. A. O’Neill, “Involving Students in Staff Development Activities,” Medical Teacher, Vol. 25, No. 2, 2003, pp. 191-194. doi:10.1080/0142159031000092616
- M. Fuller, J. Georgeson, M. Healey, A. Hurst, S. Ridell, H. Roberts and E. Weedon, “Enhancing the Quality and Outcomes of Disabled Students’ Learning in Higher Education,” Routledge, London, 2009.
- M. Yorke and B. Longden, “The First-Year Experience of Higher Education in the UK,” Higher Education Academy, York, 2008.
- K. Grace-Martin, “Can Likert Scale Data ever be Continuous?” 2010. http://www.articlealley. com/print_670606_22.html
- K. R. Sundaram, S. N. Dwivedi, and V. Sreenivas, “Medical Statistics: Principles & Methods,” BI Publications Pvt. Ltd., New Delhi, 2009.
- R. Gob, C. McCollin and M. F. Rmalhoto, “Ordinal Methodology in the Analysis of Likert Scales,” Qualilty & Quantity, Vol. 41, No. 5, 2007, pp. 601-626. doi:10.1007/s11135-007-9089-z
- W. E. Cashin, “Students Do Rate Different Academic Fields Differently,” In: M. Theall and J. Franklin, Eds., Student Ratings of Instruction: Issues for Improving Practice (Special Issues), New Directions for Teaching and Learning, Vol. 43, 1990, 113 -121.