Health
Vol.6 No.15(2014), Article
ID:48948,10
pages
DOI:10.4236/health.2014.615235
Profiles of HIV-Affected Households in Ghana
Amos Laar1*, Daniel Fiaveh2, Matilda Laar3, Sandra Boatemaa4, James Abugri5, Angela El-Adas6, Richard Amenyah6, Kyeremeh Atuahene6, Andrew Anthony Adjei7, Isabella Quakyi8
1Department of Population, Family, & Reproductive Health, School of Public Health, University of Ghana, Accra, Ghana
2Centre for Gender Studies and Advocacy, University of Ghana, Accra, Ghana
3School of Dietetics and Human Nutrition, McGill University, Montreal, Canada
4Regional Institute for Population Studies, University of Ghana, Accra, Ghana
5Department of Applied Chemistry and Biochemistry, Faculty of Applied Sciences, University for Development Studies, Navrongo Campus, Tamale, Ghana
6Ghana AIDS Commission, Accra, Ghana
7Department of Pathology, Korle-Bu Teaching Hospital, College of Health Sciences, University of Ghana, Accra, Ghana
8Department of Biological, Environmental, and Occupational Sciences, School of Public Health, University of Ghana, Accra
Email: *aklaar@yahoo.com
Copyright © 2014 by authors and Scientific Research Publishing Inc.
This work is licensed under the Creative Commons Attribution International License (CC BY).
http://creativecommons.org/licenses/by/4.0/


Received 15 June 2014; revised 30 July 2014; accepted 14 August 2014
ABSTRACT
Background: To contribute to a fuller appreciation of Ghana’s HIV epidemic, this paper presents various profiles of the Ghanaian HIV-affected household. To comprehensively tackle the HIV epidemic in Ghana, the profiles would provide stakeholders with ready information for policy formulation. Methods: We used data from a nationally representative survey that measured livelihood activities, household asset wealth, household composition, health, and nutrition variables of 1745 HIV-affected households. From these emerged various profiles. Results: About 50% of the households are headed by females. Households headed by men have an average size of three members, compared to two for female-headed households. There are far more AIDS widows than widowers. The annual death rate among the surveyed households was about 1000 per 100,000- households. Relatively more deaths occurred in male-headed households. Two-thirds of the households were asset poor. Various coping strategies were instituted by the households in reaction to threat of food insecurity. The national prevalence of chronic energy deficiency is 16%. Conclusions: Our data show that age of household head, hosting of a chronically ill member, and average size of household differed by sex of household head. The annual death rate of 1000 per 100,000 households is very high.
Keywords:HIV-Affected Households, Profiles, HIV, Ghana

1. Introduction
For close to three decades, the HIV epidemic in Ghana has been recognized as a critical public health issue [1] . Ghana’s response to HIV in the late 1980s was to manage it as yet another disease; this was directed by Ministry of Health (MoH). This response led to the establishment of the National AIDS Control Programme (NACP) in 1987. Thirteen years later, the complex nature of the epidemic compelled Ghana to adopt a multi-sectoral approach and a decentralized coordination system for its HIV response. This led to the establishment of the Ghana AIDS Commission (GAC) in 2000. The GAC spearheaded the development of the National Strategic Framework (NSF) I to guide the National Response from 2003-2005 and a NSF II, which guided Ghana’s response from 2006-2010 [2] . Ghana’s response over the years has centered on three thematic areas: prevention, treatment and care, and mitigation of socio-economic effects of HIV.
The HIV epidemic in Ghana continues to be a generalized one. However, the annual HIV sentinel surveillance reports suggest a downward trend in HIV prevalence: from a 3.6% in 2003, it saw a marginal reduction to 3.2% in 2006 and a further reduction to 2.2% in 2008. The prevalence in years 2010 and 2011 was 2.0%; this has since reduced to 1.5% in 2012 [3] . The total number of infected adults was estimated in 2010 to be 225,478 including 30,439 children. There were a total of 12,077 new infections in 2011 compared to 14,165 new infections in 2010 [2] . The estimated annual AIDS deaths for 2010 and 2011 were 17,230 and 15,263 respectively (GAC, 2012). While the overall HIV prevalence rate seems to be stabilizing in Ghana, there are considerable variations by geographic region, and urban-rural residence [3] . Such variability in prevalence may also have disparate impacts on affected households. In Ghana and other African countries, rural households have been shown to be the most burdened by HIV [4] [5] .
Earlier studies have clarified how HIV and AIDS affect household economy and wealth [6] -[8] . Chronic adult HIV morbidity causes loss of productivity due to absenteeism, inability to work and the loss of the primary sources of household income. The loss in household income is accompanied by increase in household expenditure on HIV-related out-of-pocket needs, food and other bills [5] . These and the high dependency ratios in household as a result of chronic morbidity or death could have a telling effect on household asset wealth and financial instability. It is therefore reasonable to argue that the health status of the family as an unit, is affected by HIV and AIDS. Health impacts on HIV-affected households include loss of labor time, funeral and medical bills [6] [7] . It has previously been shown that, HIV/AIDS often exacerbates economic and social vulnerability [7] [9] . Households affected by HIV have a higher prevalence of food insecurity and macro and micronutrient deficiencies [10] -[12] . In Ghana for example, food insecurity is a major problem among the general population [13] . The problem is worst among HIV-affected households. Using data from a nationally representative survey involving 1745 HIV-affected households, we present the socio-demographic profiles, family headship dynamics, health profiles, household asset wealth, and livelihood strategies of the Ghanaian HIV-affected household.
2. Methods
2.1. Design and Methodology
The sampling procedure of this national representative cross-sectional survey is detailed elsewhere [14] . Respondents were sampled from all of the ten regions in Ghana. Regional sample sizes were adjusted according to the size of each region in terms of number of persons living with HIV (PLHIV), and the proportion of PLHIV treated at different periods (pre 2007; 2008; and post 2009). This manuscript is based on a total of 1745 questionnaires representing 1745 HIV-affected households, which were retained after data cleaning. PLHIVs from selected households were approached to schedule household interviews using the assessment questionnaire. Interviews took place in the interviewee’s home.
2.2. Assessment of Coping Strategies
To explore the concept of coping, a simple numeric score, referred to as coping strategy index (CSI) is constructed using a series of questions about how households cope with a shortfall in food for consumption. The variables considered address the recurrent situation faced by the household, and the coping strategies adopted to deal with food insecurity. The variables include limiting portion size at mealtimes, reducing number of meals eaten per day, skipping an entire day’s meal, borrowing food or relying on help from friends or relatives, relying on less expensive or less preferred foods, hunting/gathering unusual types or amounts of wild food, harvesting immature crops (e.g. green maize) and sending household members to eat elsewhere. The frequency of a household using one or more of these strategies in order to have access to food three months preceding the survey was documented.
2.3. Computation of Household Asset Wealth
Asset wealth was assessed in the survey through questions on the type of asset owned by the household—these assets fall into two general categories, one describing the standard of living of the household (assets such as chairs, tables), and the other associated with income earning possibilities (items such as pop-corn machines, telephone booths or hairdryers etc.). Households were split into three broad classes, according to how many different types of asset they own—“asset poor”; “asset medium”; and “asset rich”.
2.4. Computation of Effective Dependency Rate
The effective dependency rate measures the share of total household members that is below or above working age plus those of working age who are chronically ill. For every household, the numbers of these three categories of members were subtracted from the total household size and expressed as a percentage. It is worthy of note that this does not address the actual employment status of the members.
2.5. Ethical Considerations
This study protocol was reviewed and approved by the Ghana Health Service Ethical Review Committee to ensure that the study adhered to both local and international standards for protecting the rights and safety of human subjects in research. Informed consent was obtained from all participants after the objectives and the methodology of the study was explained to them. In addition, participants were assured of privacy and confidentiality.
3. Result
3.1. Demographic Profiles and Household Composition
The majority of the respondents were females (75%). The proportion of female-headed HIV-infected households is almost equal to male-headed households although there are notable regional variations. The average size of households differed by household headship. Those headed by men had on average three members, compared to two for female-headed households. Forty-one percent of respondents are married, 15% are divorced, and 20% are widowed. About 40% have attained at least high school education (Table 1).
3.2. Sources of Livelihood, Household Asset Wealth, and Effective Dependency Rate
The main sources of household income are from petty trading, cash crop production, skilled trade and casual labor. Other sources include remittances and income from wage employment. About two-thirds of HIV affected households were asset poor. With the exception of Central region with an asset poor rate of 37%, all other regions recorded higher proportions of asset poor households; these ranged from 72% - 90% (Table 1).
The national effective dependency rate of 48.5% does not compare with dependency rates of some of the regions. Northern region has the highest proportion of effective dependents per household (75%). The Eastern region was the second highest with an effective dependent ratio of 65%. The Central, Upper east, Upper west, and Western regions each recorded a rate close to the national average. The national capital (Greater Accra region) recorded the lowest number of effective dependents per household—40% (data not shown).
3.3. Nutrition Profile: Chronic Energy Deficiency (BMI wang#Bracket## 18.5 kg/m2)
The study measured chronic energy deficiency in adults in HIV affected households using body mass index

Table 1 . Socio-demographics, and other attributes of household members (n = 1745).
1Male-headed households have an average household size of 2.0, while female-headed households had an average of 3.0; 286% of the 356 widowed were females (widows); 14% were males (widowers).
(BMI). Chronic energy deficiency is highest in the Central Region (27.5%). The Upper East region has the lowest proportion of chronic energy deficient members. Regional distribution of the main respondents in state of chronic energy deficiency is shown in Table1
3.4. Age of Household Head by Sex and Region and Household Level Morbidity, Mortality, Orphanhood
The age structure of household heads differed by region. Most noticeable is the relative concentration of young male heads in Central region. Almost three out of four household heads in this region were aged 20 - 39 years (Table 2). The Western region has the youngest age structure of household heads. About 16% of households in the western region were headed by teenagers compared to 5.4% in the Central region. In the other 10 regions, no clear relationship existed between age, sex and household headships (Table 2).
A little over 5% of all households reported at least one chronically ill member with the Central and Upper West regions recording the higher proportions. There is no observed predominance of chronic illness by sex of household head (Table 2).
The annual death rate is about one thousand per 100,000-households with larger proportions of the deaths recorded in male-headed households (Table 2). Less than 2% of HIV affected households have at least one orphan although differences emerged by regions (Table 2). In the Ashanti, Upper West, Upper East, and Northern regions, for example, the proportion of households with orphans are greater compared to the national average of 1.1%. The Upper East region recorded the highest prevalence households with orphans (9.3%). Over all, the proportion of households that are orphaned is higher among female-headed (Table 2).
3.5. Coping Strategies Instituted by HIV-Affected Households
Our data show that households affected by food insecurity employ short-term different behavioral responses (food consumption coping strategies) to manage food shortages in the household. The frequency with which households adopted various coping strategies ranged from 5.6% to 61.3% (Figure 1). The three most important coping strategies used by households to cushion food insufficiency were limiting portion size (61.3%), reducing number of meals per day (59.5%) and relying on less expensive foods (56.2%). Conversely, the least employed strategies included household member going begging (5.6%), eating elsewhere (6.7%) and harvesting immature crop (7.6%). It is worth noting that most households do not use a single strategy, but a combination of strategies.
3.6. Antiretroviral Therapy Uptake by Qualified Household Members
The survey collected data on antiretroviral therapy uptake by qualified household members. Nationally, majority of the HIV-positive persons on therapy initiated treatment between years 2007-2010. Over 80 percent of the HIV-positive persons in the households surveyed indicated that they always took the correct number of pills; took their medicine at the right time; and took their medicine with the appropriate food (Figure 2). Those who
Table 2 . Age of household head by sex and region and household level morbidity, mortality, and orphanhood.
M = male headed households; F = female headed households.
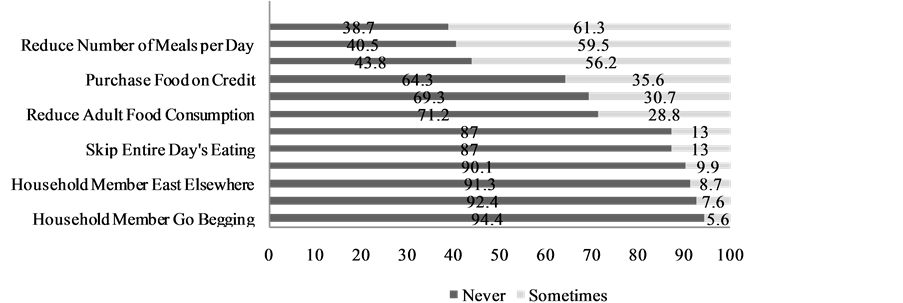
Figure 1. Coping strategies instituted by household affected by HIV. Legend: Explores the concept of coping. Prevalence of various short-term different behavioral responses (food consumption coping strategies) in response to threat of, or actual food insecurity are presented. The strategies range limiting portion size at mealtimes (61.3%) to sending household members to go begging (5.6%).
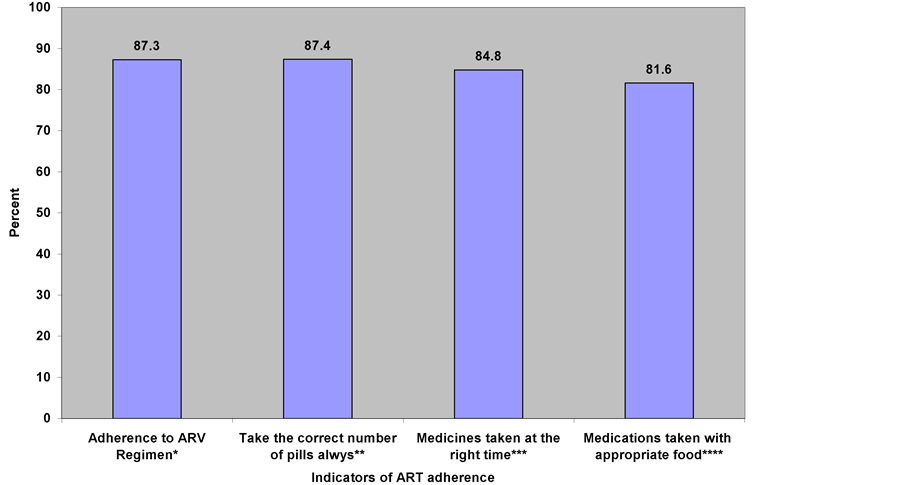
Figure 2. Adherence to treatment regimen and other treatment instructions.
could not adhere to the treatment regimen cited lack of money as reason for not taking their medication with the appropriate food. Others stated forgetfulness or time inconvenience as reasons for not taking their medications at the right time. Yet others indicated side effects as the reason for not taking the correct number of pills.
4. Discussion
We have presented the socio-demographic profiles, sources of livelihood, household asset wealth, coping strategies, nutrition, and health profiles of 1745 HIV-affected households in Ghana. Our analyses are descriptive in nature; and therefore encourage that caution be exercised when generalizations beyond this descriptive perspectives are done.
Our data showed that household composition patterns differed by region. We found it worth noting that in a patriarchal society such as Ghana’s, women were as likely as men to head a household. This is possibly due to the effect of the HIV disease on household headship dynamics. There were also regional variations in terms of the ages of household heads and household sizes in both male and female-headed households. For example, the Central region reported over 70% of the youngest age structure (20 - 39). The age and sex of household heads have implications on economic status, ability of households to support and care for HIV patients, and ultimately health status.
The current analysis reveals low educational attainment by the majority of the respondents. We attribute this partly to the higher proportion of females in the sample. Previous analysis revealed that women generally had lower levels of education compared with men in Ghana and this is also associated with their low socioeconomic status [15] . The low levels of education of the household heads could also influence decision regarding the seeking of HIV care and treatment, the nature of support and care for household members in need [4] .
We show that households affected by HIV or AIDS are vulnerable in many ways. The fact that 76% of the HIV infected households had “ever been married” but only 41% are still engaged in these unions indicates the vulnerability of marital couples to divorce or death. Various studies have documented the impact of HIV on marriage [6] [16] [17] . Laura Porter and others had earlier espoused that women’ HIV disclosure status is a factor influencing higher divorce rate among women infected with HIV [18] .
Sources of household income in HIV infected households indicated by this study concur with findings from other nationally representative Ghanaian survey [15] . The main sources identified were from petty trading, cash crop production, casual labor, skilled trade, formal salary, remittances and casual labor (Table 1). However, since most of the households had income sources from informal activities, a household’s economic status would be more enhanced if they received income from multiple sources than just from one source.
The proportion of households that experienced illness three months prior to the survey and the annual death rate are presented in Table2 We found the annual death rate of 1000 per 100,000 too high especially in an era of antiretroviral therapy (ART). It may be instructive to note that even though treatment scale-up efforts resulted in about 64% of identified and eligible pregnant women receiving ART for prevention of mother-to-child transmission of HIV (PMTCT) in 2011, only about 30% of the close to 100,000 adults and 14.8% of about 12,000 children eligible for ART received them in 2009 [2] .
There is an acknowledged relationship between HIV infection, other illnesses, and dependency ratio [7] [19] . Episodes of death and illness due to HIV increases dependency ratio, and also push households into financial burden and food insecurity. The death of an adult member in a households increase dependency ratios in many households. Madhavan et al. using data from a surveillance system investigated whether mortality from AIDS differed from other causes of death in its effect on household dependency ratio [19] . Their data showed that migration into and out of the household in anticipation, or in response to death is a key source of change in the household dependency ratio. Similarly, Thurlow et al. in their paper that estimated the economic impact of HIV/ AIDS on South Africa conclude that the increase in economic growth that results from addressing HIV/AIDS is sufficient to offset the population pressure placed on income poverty. They note that the incentives to mitigate HIV/AIDS lie not only with poorer infected households, but also with uninfected higher income households [7] .
The survey collected data on antiretroviral therapy uptake by qualified household members. Over 80 percent of the HIV-positive persons in the households surveyed indicated that they always took the correct number of pills, took their medicine at the right time and took their medicine with the appropriate food (Figure 2). It should be noted, however, that these statistics are based on self-reported evidence, which has the tendency of overestimating the outcome. Those who could not adhere to the treatment regimen cited lack of money as reason for not taking their medication with the appropriate food. Others stated forgetfulness or time inconvenience as reasons for not taking their medications at the right time. Yet others indicated side effects as the reason for not taking the correct number of pills. Addressing these documented barriers to adherence may be helpful to the successful implementation of country’s ART interventions.
Although research remains inconclusive between poverty and the spread of HIV, particularly in sub-Saharan Africa, unequal distribution of income and food insecurity appears to stimulate the spread of HIV [20] [21] . The role of household food security among people living with HIV is an important contributing factor in the successful treatment of PLHIV. As discussed earlier, the epidemic can create food insecurity and malnutrition by increasing medical costs and reducing the productivity of the workforce, impacting heavily upon people’s livelihoods and health seeking behavior [22] . The loss of income, in addition to rising medical costs, reduces the ability of people giving care to work themselves, pushing HIV-affected households deeper into poverty. In many cases, households simply dissolve because parents die and children are sent to relatives for care and upbringing [23] . Some studies on the economic impact of HIV and antiretroviral treatment (ART) on individuals and households in Zambia and Kenya reported that two-thirds of HIV-affected households had to sell at least some of their land, capital or household property to pay for treatment [23] .
Another attribute of the studied households worth discussion is their coping strategies. Various coping strategies were instituted by the HIV-affected households in this study including skipping an entire day’s meal (13%), harvesting immature crops (7.6%), and begging (5.6%). We believe that the behavior may be symptomatic of the critical challenges HIV infection poses to household livelihood. Given that most households in the current study were asset poor, and the long established association between household asset wealth and institution of coping strategies [8] [24] [25] , elimination of these negative coping behaviors could be addressed through a policy focusing on helping HIV-affected households to gradually build up their asset base.
5. Conclusion
The attributes of the HIV-affected households are gendered in many ways. The age of household head, hosting of a chronically ill member, and average size of household differed by sex of household head. Males were more likely to head larger households; females on the other hand were more likely to start heading households at an earlier age. Female-headed households were more likely to host a chronically ill member. The prevalence of negative coping strategies by HIV-affected households in reaction to threat of food insecurity was very prevalent. The annual death rate of 1000 per 100,000 households is very high.
Competing Interests
The authors have no competing interest, whatsoever.
Authors’ Contributions
AL, AE, RA, KA designed and implemented the research. AL, DF, ML, SB, JA, contributed to the data analysis. All authors contributed to drafting the different components of the manuscript, proofreading and finalization.
Acknowledgements
We are grateful to all the households and PLHIV who voluntarily participated in the survey. This paper benefits from an earlier work commissioned by the United Nations World Food Program, and the Ghana AIDS Commission.
References
- Library of Congress, CIA: Ghana Acquired Immune Deficiency Syndrome (AIDS) (1994) The Library of Congress Country Studies, and the CIA World Factbook. Federal Research Division Library of Congress, Washington DC.
- Ghana AIDS Commission (GAC) (2012) Ghana Country Aids Progress Report Reporting Period January 2010-December 2011. The Ghana AIDS Commission, Accra.
- NACP (2013) The 2012 HIV Sentinel Survey Report. Ghana Health Service, Ministry of Health, Accra.
- Agboh-Noameshie, R., Coulibaly, O., Gbaguidi, B., Allomasso, R., Kormawa, A., Adeoti, R., Kormawa, P. and Adetonah, S. (2007) Impact of HIV/AIDS on Rural Livelihood in West Africa: An Explorative Study in Benin and Ghana. International Institute of Tropical Agriculture (IITA), Cotonou.
- Parker, D.C., Jacobsen, K.H. and Komwa, M.K. (2009) A Qualitative Study of the Impact of HIV/AIDS on Agricultural Households in Southeastern Uganda. International Journal of Environmental Research and Public Health, 6, 2113-2138. http://dx.doi.org/10.3390/ijerph6082113
- Hosegood, V. (2009) The Demographic Impact of HIV and AIDS across the Family and Household Life-Cycle: Implications for Efforts to Strengthen Families in Sub-Saharan Africa. AIDS Care, 21, 13-21.http://dx.doi.org/10.1080/09540120902923063
- Thurlow, J., Gow, J. and George, G. (2009) HIV/AIDS, Growth and Poverty in KwaZulu-Natal and South Africa: An Integrated Survey, Demographic and Economy-Wide Analysis. Journal of the International AIDS Society, 12, 18.http://dx.doi.org/10.1186/1758-2652-12-18
- Reeves, P.M., Merriam, S.B. and Courtenay, B.C. (1999) Adaptation to HIV Infection: The Development of Coping Strategies over Time. Qualitative Health Research, 9, 344-361. http://dx.doi.org/10.1177/104973299129121901
- Piot, P., Greener, R. and Russell, S. (2007) Squaring the Circle: AIDS, Poverty, and Human Development. PLoS Medicine, 4, 1571-1575. http://dx.doi.org/10.1371/journal.pmed.0040314
- Tsai, A.C., Hung, K.J. and Weiser, S.D. (2012) Is Food Insecurity Associated with HIV Risk? Cross-Sectional Evidence from Sexually Active Women in Brazil. PLoS Medicine, 9, Article ID: e1001203.http://dx.doi.org/10.1371/journal.pmed.1001203
- Garcia, J., Hromi-Fiedler, A., Mazur, R.E., Marquis, G., Sellen, D., Lartey, A. and Pérez-Escamilla, R. (2013) Persistent Household Food Insecurity, HIV, and Maternal Stress in Peri-Urban Ghana. BMC Public Health, 13, 215.http://dx.doi.org/10.1186/1471-2458-13-215
- Gillespie, S. and Kadiyala, S. (2005) HIV/AIDS and Food and Nutrition Security: From Evidence to Action. International Food Policy Institute, Washington DC.
- WFP (2009) Comprehensive Food Security and Vulnerability Analysis (CFSVA). WFP, Accra.
- Laar, A.K., Manu, A., Fiaveh, D. and Laar, M.E. (2012) Vulnerability to Food Insecurity and Negative Coping Strategies of HIV-Affected Households in Ghana. The 24th congress of the Nutrition Society of South Africa and the 5th African Nutrition Epidemiology Conference University of Free State, Bloemfontein, 30 September-4 October 2012, Book of Abstract, 53.
- GSS (2009) GHS, Macro-International: Ghana Health Service (GHS), & ICF Macro. Ghana Demographic and Health Survey 2008. GSS, Accra.
- Reniers, G. and Armbruster, B. (2012) HIV Status Awareness, Partnership Dissolution and HIV Transmission in Generalized Epidemics. PLoS One, 7, Article ID: e50669. http://dx.doi.org/10.1371/journal.pone.0050669
- Kaiser, R., Bunnell, R., Hightower, A., Kim, A.A., Cherutich, P., Mwangi, M., Oluoch, T., Dadabhai, S., Mureithi, P., Mugo, N. and Mermin, J. (2011) Factors Associated with HIV Infection in Married or Cohabitating Couples in Kenya: Results from a Nationally Representative Study. PLoS One, 6, Article ID: e17842.http://dx.doi.org/10.1371/journal.pone.0017842
- Porter, L., Hao, L., Bishai, D., Serwadda, D., Wawer, M.J., Lutalo, T. and Gray, R. (2004) HIV Status and Union Dissolution in Sub-Saharan Africa: The Case of Rakai, Uganda. Demography, 41, 465-482.http://dx.doi.org/10.1353/dem.2004.0025
- Madhavan, S., Schatz, E. and Clark, B. (2009) Effect of HIV/AIDS-Related Mortality on Household Dependency Ratios in Rural South Africa, 2000-2005. Population Studies: A Journal of Demography, 63, 37-51.http://dx.doi.org/10.1080/00324720802592784
- Mishra, V., Assche, S.B.-V., Greener, R., Vaessen, M., Hong, R., Ghys, P.D., Boerma, J.T., Van Assche, A., Khan, S. and Rutstein, S. (2007) HIV Infection Does Not Disproportionately Affect the Poorer in Sub-Saharan Africa. AIDS, 21, S17-S28. http://dx.doi.org/10.1097/01.aids.0000300532.51860.2a
- Fox, A.M. (2010) The Social Determinants of HIV Serostatus in Sub-Saharan Africa: An Inverse Relationship between Poverty and HIV? Public Health Reports, 125, 16-24.
- Kadiyala, S. and Rawat, R. (2013) Food Access and Diet Quality Independently Predict Nutritional Status among People Living with HIV in Uganda. Public Health Nutrition, 16, 164-170.http://dx.doi.org/10.1017/S136898001200050X
- Samuels, F.A. and Rutenberg, N. (2011) Health Regains but Livelihoods Lag: Findings from a Study with People on ART in Zambia and Kenya. AIDS Care, 23, 748-754. http://dx.doi.org/10.1080/09540121.2010.532535
- Sikkema, K.J., Kalichman, S.C., Hoffmann, R., Koob, J.J., Kelly, J.A. and Heckman, T.G. (2000) Coping Strategies and Emotional Wellbeing among HIV-Infected Men and Women Experiencing AIDS-Related Bereavement. AIDS Care, 12, 613-624. http://dx.doi.org/10.1080/095401200750003798
- Lesar, S. and Maldonado, Y.A. (1996) Parental Coping Strategies in Families of HIV-Infected Children. Journal of Child Health Care, 25, 19-35. http://dx.doi.org/10.1207/s15326888chc2501_3
List of Abbreviations
AIDS: Acquired Immune Deficiency Syndrome;
ART: Antiretroviral Therapy;
BMI: Body Mass Index;
CSI: Coping Strategy Index;
GAC: Ghana AIDS Commission;
HIV: Human Immunodeficiency Virus;
MoH: Ministry of Health;
NSF: National Strategy framework;
PLHIV: Persons Living with HIV;
NOTES

*Corresponding author.