Health
Vol.4 No.12A(2012), Article ID:26104,7 pages DOI:10.4236/health.2012.412A213
The relationship between thermal imaging and waist circumference in young adults
![]()
1Department of Human Environmental Studies, Central Michigan University, Mt. Pleasant, USA; *Corresponding Author: heube1ra@cmich.edu
2Departments of Earth and Atmospheric Science and Computer Science, Central Michigan University, Mt. Pleasant, USA
Received 31 October 2012; revised 6 December 2012; accepted 17 December 2012
Keywords: Obesity; Thermal imaging; Young adults
ABSTRACT
Technologies such as 3-dimensional body scanners and thermal cameras are currently being investigated to eliminate the traditional means of assessing anthropometrics in the overweight and obese population. The purpose of this study was to determine the potential for thermal imaging to assess the relationship between thermal patterning and anthropometrics in young adults. Participants were 18 - 24 years old men (n = 176) and women (n = 260) with different Body Mass Indices (BMI), somatotypes, and activity levels. Participants were weighed, body scanned and thermally imaged. Statistical treatment included descriptive statistics and ANOVA. Statistically significant differences between mean thermal ratings were found between the normal and abnormal groups as categorized by waist circumference for both males (p < 0.003) and females (p < 0.001). The mean ratings of the contour regions between normal and overweight/ obese groups were also found to be statistically different for both males (p < 0.01) and females (p < 0.004).
1. INTRODUCTION
Obesity is now recognized as a major public health issue in the United States (US). Approximately 127 million Americans are overweight or obese, exceeding 30% of the population in most sex and age groups [1]. Of particular concern is the increase in health risk evidenced in younger persons due in part to the overall rising obesity rate [2]. These risks, often first manifested in young adulthood, tend to increase with age, in conjunction with increasing rates of central adiposity [3]. Currently, obesity rates for Americans are 49.8% of those 20 - 39 years of age, 64.1% of those 40 - 59, and 74% of those aged 60 and older [4]. As a result, it is possible that mortality rates will rise disproportionately for younger victims of the obesity epidemic, whose abdominal adipose tissue deposition causes co-morbidities early in life [3].
Central or visceral obesity, with the disproportionate increase of adipose tissue surrounding the internal organs, has been associated with abnormal blood sugar, blood triglycerides, high-density and low-density lipoproteins, total cholesterol and uric acid levels [5,6]. These body shape alterations increase atherosclerosis, blood pressure and insulin resistance, leading to an end result of increased risk for cardiovascular disease, diabetes, gout, stroke and other co-morbidities [7]. Metabolic syndrome, defined by this cluster of abnormalities, has started to occur more frequently in younger persons, generating calls for earlier screening and exploration of new anthropometric assessment technologies by health care professionals [8].
Anthropometric measures have long been used as surrogates for the evaluation of abdominal fatty deposits [9]. Body Mass Index (BMI), waist circumference (WC), waist to hip ratio (WHR), thigh and hip circumferences, and waist to height ratios have all come in and out of favor as indices of fatty tissue accumulation and future health risk [3,10]. Newer technologies such as 3-dimensional (3D) laser body scanners and thermal cameras are currently being investigated to eliminate the use of tape measures and other traditional means of assessing anthropometrics [11]. These new technologies have several advantages. They are non-invasive and do not require touching of the participant. They are also computerized, and data is collected in seconds. Newer technologies are also highly accurate in their rendition of the body, and do not require repeated measurements by interviewers to obtain reproducibility [12]. Thus, the purpose of this study was to explore the use of body scanning technology in combination with thermal imaging as a means of identifying visceral obesity in young adults.
1.1. Body Scanners
Body scanners are a relatively recent technology whose main function is to measure the surface topography of the human body, producing a 3D image of the individual being scanned as well as an extensive list of body measurements. Three-dimensional body scanning has been and continues to be investigated for weight and shape indices as well as accurate, realistic renditions of the body [13]. Wells et al. [11] completed a national UK sizing survey using 3D technology and found relationships between body shape and BMI that differed between sexes, particularly with age. Gropper et al. [14] utilized a body scanner to capture changes in college freshmen’s body weight distribution, with results indicating that weight gain among freshmen was associated with increased body fat and waist circumference.
1.2. Thermal Cameras
A thermal camera makes use of infrared imaging to visualize and measure the thermal energy emitted from objects in the environment [15]. Thermal cameras are capable of discriminating temperature differences as small as 0.12˚C, and may be used to assess the absolute temperature of specific points on the body, or alternatively to calculate average temperature of a specific region of the body as specified by the researcher. As is typical, thermal profiles generated by a thermal camera use different color or grayscale palettes to visually quantify heat released by the body. The different thermal contours, or patterns, allow for visual and quantitative comparisons of the relative differences in the amount of heat released by one area of the torso as compared to other areas.
Thermal imaging is being used by the medical community to assist in health measurement and disease diagnosis, and has been used to observe the relationship between morphology, body composition and obesity [16]. Savastano et al. [17] utilized thermal imaging to examine heat production and dissipation in obese adults as compared to normal weight adults. Analysis of data indicated that obese participants demonstrated significantly lower abdominal thermal patterns than those of their normal weight counterparts. Later research confirmed that larger variations in skin temperature distributions occur as body fat increases [18]. Cluster heat maps created from thermal imaging have been used to investigate relationships between body composition, lipid levels, and glucose metabolism [19]. Most recently, thermal imaging has been used as a diagnostic, as well as prognostic tool for diabetes. Research has shown that alterations in skin temperature enable early detection of diabetes as compared to Glycosylated Hemoglobin A1c (HbA1C) lab testing. Decreases in skin temperature are thought to be due to lower basal metabolic rate, poorer blood perfusion and higher levels of insulin resistance [20]. Thermal infrared imaging has also been used to assess the efficacy of therapeutic exercise programs in individuals with diabetes [21]. Other research using thermal imaging has aided in quantifying rheumatoid arthritis, assessing autonomic function and para-spinal thermal patterns [22].
In sum, body scanning in conjunction with thermal imaging may allow evaluation of anthropometrics, body fat distribution and subsequent prediction of health risk [11]. This study explores thermal patterning variability as a correlate to waist circumference in young adults.
2. METHODS
2.1. Participants
This study focused on women and men residing in a rural community in the upper Midwestern US. The Institutional Review Board and Human Subjects Committee at the university where the research took place approved the study and each participant signed an informed consent. Participant’s data were entered into a database and data collection occurred between August 2006 and June 2010. The database contained over 950 individuals, comprised of both males and females, 13 to 92 years of age. The database population consists of persons with sedentary to active lifestyles, diverse heights, weights, BMI ratios and somatotypes. For this study, the participants were data mined from this database, which included 176 males and 260 females aged 18 to 24 years of age. This age range was selected due to rising obesity rates within this subgroup
2.2. Data Collection and Measures
Participants were weighed on digital scales and measured with stadiometers. All participants were assessed using graded calipers for skinfold thickness measures at multiple sites. All measures were done in triplicate and then averaged. Participants were classified into BMI (kg/m2) categories. Waist circumference was taken with a measuring tape at the level of the umbilicus and verified for precision using a 3D body scanner. Participants filled out standard demographic and exercise frequency questionnaires. Lastly, participants’ information was entered into a non-identifiable database.
As part of the data collection, each participant was scanned utilizing a 3D body scanner. The body scanner is self-calibrating, has 8 cameras and 4 laser light sources, and collects approximately 300,000 digital data points from each scan within 12 seconds. For accuracy, each participant was minimally clothed in form fitting garments such as bra and underwear, briefs, bicycle shorts or swimsuit.
After scanning, the participant stood in front of a self-calibrating thermal camera with a black backdrop. Thermal images of the participant’s front, left, right and back torso areas were then taken in ambient conditions.
Before thermal patterns can be examined, a 2D/3D mapping process must take place. This 2D/3D imaging can be defined as the process of placing a flat 2D bitmap image onto a 3D object. Upon data collection and cleaning, processing of the thermal images is performed. This involves mapping the thermal images onto the 3D object through image registration techniques. Essentially, image registration makes use of common landmarks that exist on both the thermal images and the 3D scan, such as the umbilicus. A detailed explanation of image registration techniques can be found in Fengzhi and Li [23]. The results of image registration are presented in Figure 1.
Before comparisons can be made for thermography, the amount of thermal data for each individual must first be contoured. Contouring is used to determine the regions of equal temperature and their gradients as a function of location. The contours were created using contouring algorithms at fixed cutoff values. After creating the contour levels, the number of contour regions was counted for each participant. A low number of contour regions corresponded to a low spatial variability in temperature, while a high number of contour regions corresponded to a high spatial variation of temperature. A thermal rating for each individual was also calculated. The thermal rating essentially is a function of the spatial variation in the human torso, calculated as a function of the number of contour lines present and the areas of the contour regions. A low thermal rating corresponds to more variability in temperatures, with more contour re-
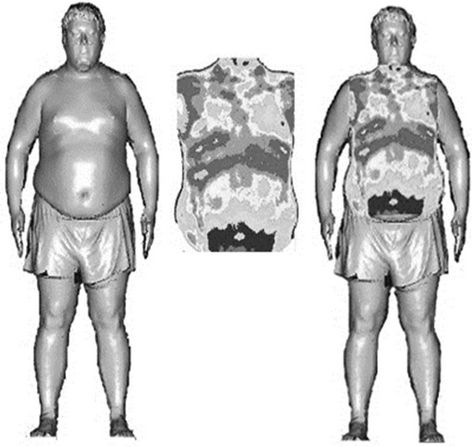
Figure 1. Body scan, thermal image, and mapped image of an obese young man.
gions and smaller contour areas resulting. A high thermal rating corresponds to large areas of similar temperatures, and therefore smaller variability.
2.3. Data Analysis
Data was entered, cleaned, coded, and analyzed in the following software programs: Microsoft Excel, MatLab and Thermacam Researcher Professional. Descriptive statistics and ANOVA were performed. Data were standardized by BMI for determination of significant differences between waist circumference categories. National Heart, Lung and Blood Institute (1998) criteria for WC was used. Males with a WC of 101.6 cm or less were classified as normal and those with a WC of greater than 101.6 cm were classified as abnormal. For females the normal WC was less than 88.9 cm and abnormal was categorized as greater than 88.9 cm.
3. RESULTS
Demographic information and data on participant’s anthropometrics are presented in Table 1, stratified by gender. Table 2 summarizes the results of separate ANOVA analyses performed on males and females. These ANOVA of the calculated thermal ratings were categorized by abnormal versus normal WC. The results in Table 2 show statistically significant differences (p < 0.003) between normal and abnormal WC in young men when thermal profiles were evaluated. Table 2 presents similar results for women, with an ANOVA showing statistically significant differences between normal and abnormal WC (p < 0.001).
In addition to the thermal rating values, the number of contour regions were also analyzed, stratified by sex and BMI (normal versus overweight/obese). These results are shown in Figure 2. The overweight and obese categories were clustered due to the low number of obese males (n = 20) and females (n = 13) as shown in Table 1. Results of the ANOVA evidenced normal and overweight/obese persons had statistically different mean numbers of contour regions (males p < 0.01, females p < 0.004, respectively) present in their thermal profiles (Figure 2).
4. DISCUSSION
Obesity is associated with increased health risks, and young adults with central deposition are at a greater risk for morbidity and mortality as they enter middle age [24]. The data in this study indicated that overweight and obese young persons had dramatically different thermal patterns and profiles. For both men and women, those with a normal BMI displayed fewer thermal contours, (39 and 43 respectively) indicating a narrower temperature range across the torso region. Notably lacking were
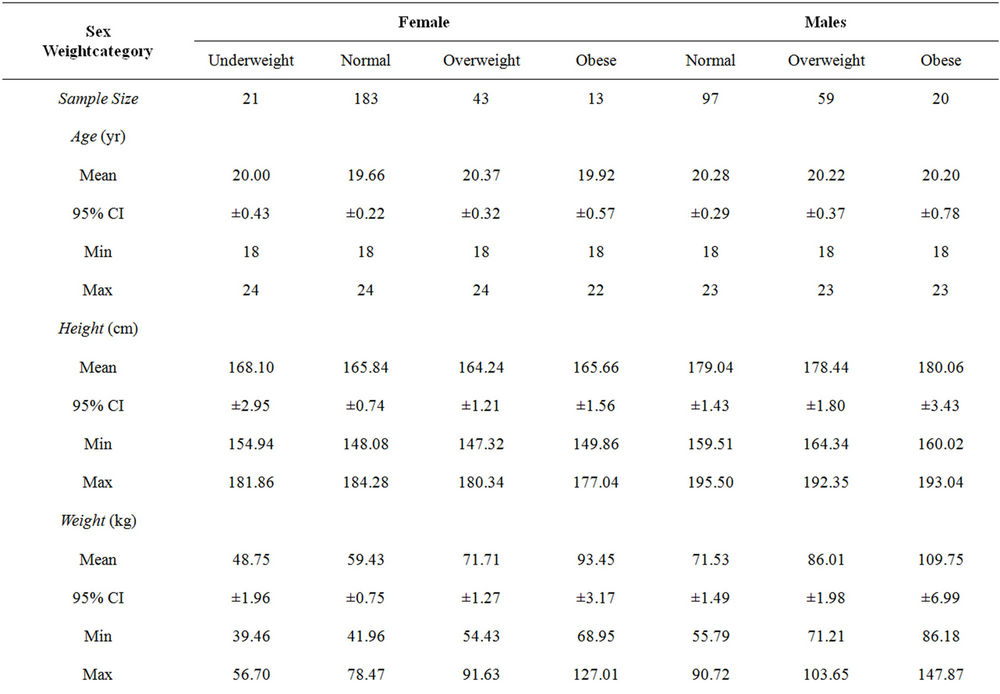
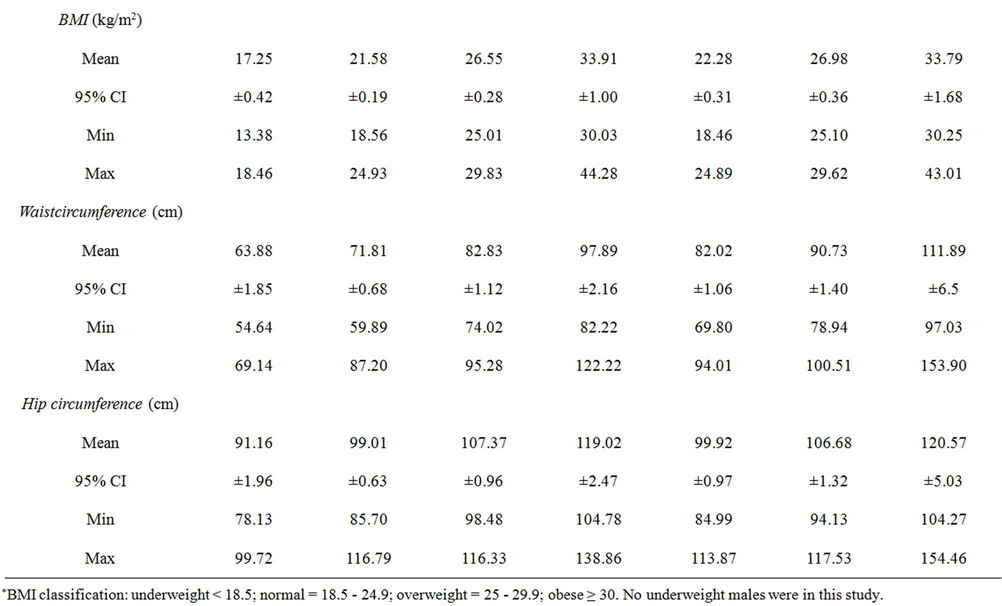
Table 1. Age and anthropometric data by BMI classificationa for young adult females and males involved in the thermal patterning/somatotyping study (n = 176)*.
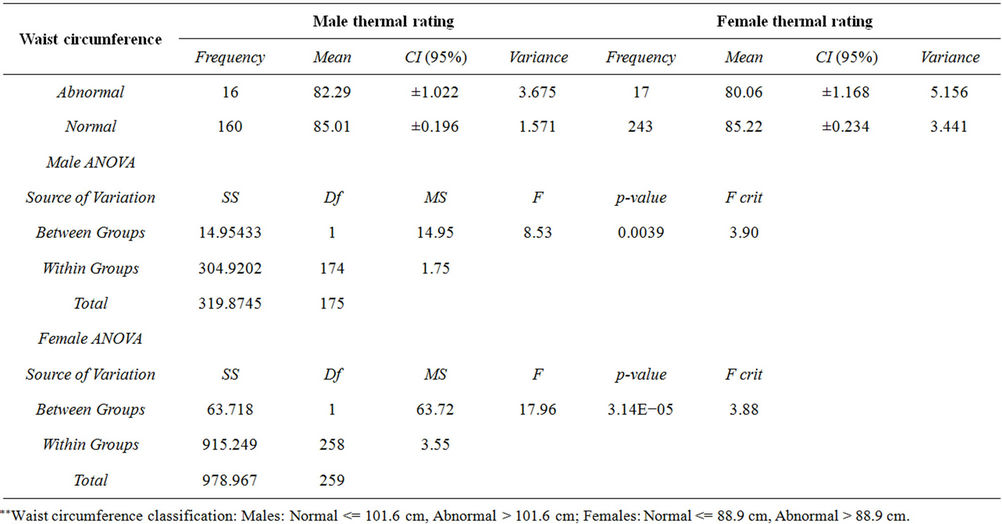
Table 2. ANOVA results for relationships between anthropometrics and mean thermal rating in young males (n = 176) and young females (n = 260)**.
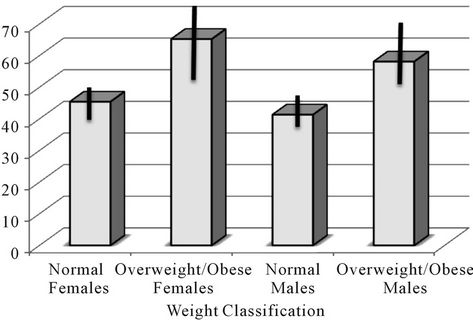
Figure 2. Distribution of the number of contour regions, segregated by BMI and gender.
the cooler skin temperatures displayed by subjects who were classified as overweight or obese. In contrast, men and women who were categorized as overweight or obese displayed significantly more thermal contour regions across their torso (56 and 63 respectively). Additionally, this group displayed contour areas that were significantly cooler particularly in the belly region. The authors' speculate that excess abdominal fat, acting as an insulator, is the cause of the wider range of temperature patterns displayed by these individuals. It is possible that the clustering or number of thermal patterns may give rise to several profiles corresponding to varying distributions of insulation by adipose tissue, and thus may identify the distributions that are associated with health risk. The ability of paraprofessionals to quickly and easily classify individuals by health risk through thermal profiling may eliminate the need for radiation exposure from specialized equipment and techniques such as Dual X-Ray Absorptiometry (DXA) or Computerized Tomography (CT) or the expense of such approaches. Instead, body scanning and thermography could be utilized to assess fat distribution, predilection for metabolic disease and strategies for the reduction of fat in the abdominal area for younger persons [24]. Differences in the distribution of heat among persons who are overweight and obese when compared to those of normal weight may be the result of additional insulation provided by abdominal adipose tissue. It may potentially provide a means of assessing the degree to which adipose tissue is centrally located in persons who are at risk for metabolic syndrome.
The 3D body scanner and thermal camera are both capable of acquiring highly accurate and reproducible anthropometric data. They are both non-invasive, fast and require minimal physical interaction with participants. The thermal camera is portable; however the 3D body scanner is not and cannot be used in the field. Benefits of using specialized equipment outweigh cost (around $30,000 and $5000 for the scanner and camera respectively), as labor costs and time can be significantly reduced.
Young adults with central adiposity increase their long term health risk and bring those risks into later adulthood. This has profound public health costs associated with it. The increase in metabolic syndrome and medical conesquences and complications associated with visceral adiposity result in increased health care expenditures, increased health burden and health care utilization. Ultimately decreasing longevity and giving a poorer quality of life. Early detection and intervention can reduce the morbidity and mortality associated with an increased central fat mass. Mobile, non-invasive thermal imaging, that is rapid, requires no training for its administration and has no untoward side effects could provide an early screening and detection tool at a cost far less than traditional measures, such as Dual X-Ray Absorptiometry. Thermal imaging and early detection could foster early intervention and thus aid in decreasing the public health burden of obesity.
Limitations to this study were the variability in thermogenesis and heat patterning among individuals. This made it difficult to characterize thermal correlates to somatotype and there were insufficient numbers of very thin or morbidly obese persons in the sample. Thermal distributions may also be dependent upon sex and physiological differences between participants such as hydration, stage in menstrual cycle or medication use— these factors were not considered in the present study. There is also a lack of information on future health risks in this group. Additionally, this study made use of convenience sampling, which does not allow for the determination of causality or change over time. Lastly, the study sample was homogeneous, due to the geographic locale from which the sampling took place and thus the study sample is not generalizable to the United States or to international populations.
Earlier research has confirmed that larger variations in skin temperature distributions occur as body fat increases [18]. In sum, body scanning in conjunction with thermal imaging may allow evaluation of anthropometrics, body fat distribution and subsequent prediction of health risk [11]. Future research should be performed to elucidate the degree to which thermal patterning can be affected by internal and external factors and how it can be used for the detection of future adverse health outcomes in the general population, particularly with the obese.
5. ACKNOWLEDGEMENTS
The authors wish to acknowledge Amanda Burton for her assistance with editing and Jennifer Messing and Xioulu Mo for their assistance with data collection and entry. Special thanks also go to the National Science Foundation (Awards #0420791 and 0959020) and Central Michigan University for their financial support.
REFERENCES
- Flegal, K.M., Carroll, M.D., Ogden, C. and Curtin, L.R. (2010) Prevalence and trends in obesity among US adults, 1999-2008. Journal of the American Medical Association, 303, 235-241. doi:10.1001/jama.2009.2014
- Smith, D.A., Ness, E.M., Herbert, R., Schechter, C.B., Phillips, R.A., Diamond, J.A. and Landrigan, P.A. (2005) Abdominal diameter index: A more powerful anthropometric measure for prevalent coronary heart disease risk in adult males. Diabetes Obesity and Metabolism, 7, 370- 380. doi:10.1111/j.1463-1326.2004.00406.x
- Yusuf, S., Hawken, S., Ounpuu, S., Bautista, L., Franzosi, M.G., Commerford, P. and Anand, S.S. (2005) Obesity and the risk of myocardial infarction in 27,000 participants from 52 countries: A case-control study. The Lancet, 366, 1640-1649. doi:10.1016/S0140-6736(05)67663-5
- Ervin, B.R. (2009) Prevalence of metabolic syndrome among adults 20 years of age and over, by sex, age, race and ethnicity, and body mass index: United States, 2003- 2006, National Health Statistics Reports, No. 13. www.cdc.gov/nchs/data/nhsr/nhsr013.pdf
- Andreassi, M.G. (2009) Metabolic syndrome, diabetes and atherosclerosis: Influence of gene-environment interaction. Mutation Research, 667, 35-43. doi:10.1016/j.mrfmmm.2008.10.018
- Bays, H.E. (2009) “Sick fat”, metabolic disease and atherosclerosis. American Journal of Medicine, 122, S26- S37. doi:10.1016/j.amjmed.2008.10.015
- Thalmann, S. and Meier, C.A. (2007) Local adipose tissue depots as cardiovasculardiseaseriskfactors. Cardiovascular Research, 75, 690-701. doi:10.1016/j.cardiores.2007.03.008
- Koivistoinen, T., Hutri-Kähönen, N., Juonala, M., Aatola, H., Kööbi, T., Lehtimäki, T., Viikari, J.S., Raitakari, O.T. and Kähönen, M. (2011) Metabolic syndrome in childhood and increased arterial stiffness in adulthood: The cardiovascular risk in young Finns study. Annals of Medicine, 43, 312-319. doi:10.3109/07853890.2010.549145
- Weiss, R. (2007) Fat distribution and storage: How much, where and how? European Journal of Endocrinology, 157, S39-S45.
- Brambilla, P., Bedogni, G., Moreno, L.A., Goran, M.I., Gutin, B., Fox, K.R. and Pietrobelli, A. (2006) Crossvalidation of anthropometry against magnetic resonance imaging for the assessment of visceral and subcutaneous adipose tissue in children. International Journal of Obesity, 30, 23-30. doi:10.1038/sj.ijo.0803163
- Wells, J.C.K., Cole, T.J. and Treleaven, P. (2008) Agevariability in body shape associatedwith excess weight: The UK national sizing survey. Obesity, 16, 435-441. doi:10.1038/oby.2007.62
- Heuberger, R., Domina, T. and MacGillivray, M. (2008) Body scanning as a new anthropometric measurement tool for health-risk assessment. International Journal of Consumer Studies, 32, 34-40.
- Wells, J.C.K., Treleaven, P. and Charoensiriwath, S. (2012) Body shape by 3-D photonic scanning in Thai and UK adults: Comparison of national sizing surveys. International Journal of Obesity, J36, 148-154. doi:10.1038/ijo.2011.51
- Gropper, S.S., Simmons, K.P., Gaines, G., Drawdy, K., Saunders, D., Ulrich, P. and Connell, L.J. (2009) The freshman 15—A closer look. The Journal of American College Health, 58, 223-231. doi:10.1080/07448480903295334
- Ferreira, J.J., Mendonca, L.C., Nunes, L.A., Filho, A.C., Rebelatto, J.R. and Salvini, T.F. (2008) Exercise-associated thermographic changes in young and elderly subjects. Annals of Biomedical Engineering, 36, 1420-1427. doi:10.1007/s10439-008-9512-1
- Galic, S., Oakhill, J.S. and Steinberg, G.R. (2010) Adipose tissue as an endocrine organ. Molecular and Cellular Endocrinology, 316, 129-39. doi:10.1016/j.mce.2009.08.018
- Savastano, D.M., Gorbach, A.M., Eden, H.S., Brady, S.M., Reynolds, J.C. and Yanovski, J.A. (2009) Adiposity and human regional body temperature. The American Journal of Clinical Nutrition, 90, 1124-1131. doi:10.3945/ajcn.2009.27567
- Kinnicutt, P., Domina, T. and MacGillivray, M. (2011) Thermal pattern variations analyzed using 2D/3D mapping techniques among females. Journal of Textile and Apparel, Technology Management, 7, 1-15.
- Lindsey, J.C., Jacobson, D.L., Li, H., Houseman, E.A., Aldrovandi, G.M. and Mulligan, K. (2012) Using cluster heat maps to investigate relationships between body composition and laboratory measurements in HIV-infected and HIV-uninfected children and young adults. Journal of Acquired Immune Deficiency Syndromes, 59, 325-328. doi:10.1097/QAI.0b013e31823fdbec
- Sivanandam, S., Anburajan, M., Venkatraman, B., Menaka, M. and Sharath, D. (2012) Medical thermography: A diagnostic approach for type 2 diabetes based on noncontact infrared thermal imaging. Endocrine, 42, 343-351. doi:10.1007/s12020-012-9645-8
- Al-Nakhli, H.H., Petrofsky, J.S., Laymon, M.S., Arai, D., Holland, K. and Berk, L.S. (2012) The use of thermal infrared imaging to assess the efficacy of a therapeutic exercise program in individuals with diabetes. Diabetes Technology and Therapeutics, 14, 159-67. doi:10.1089/dia.2011.0187
- Spalding, S.J., Kwoh, C.K., Boudreau, R., Enama, J., Lunich, J., Huber, D. ... and Hirsch, R. (2008) Three-dimensional and thermal surface imaging produces reliable measures of joint shape and temperature: A potential tool for quantifying arthritis. Arthritis Research and Therapy, 10, e1-10. doi:10.1186/ar2360
- Fengzhi, L. and Li, Y. (2005) Effect of clothing material on thermal responses of the human body. Modeling Simulation Materials Science Engineering, 13, 809-827. doi:10.1088/0965-0393/13/6/002
- Ritchie, S.A. and Connell, J.M. (2007) The link between abdominal obesity, metabolic syndrome and cardiovascular disease. Nutrition Metabolism and Cardiovascular Diseases, 17, 319-326. doi:10.1016/j.numecd.2006.07.005