Materials Sciences and Applications
Vol.3 No.9(2012), Article ID:22930,5 pages DOI:10.4236/msa.2012.39097
Synthesis and Ultrasonic Investigations of CuO-PVA Nanofluid
![]()
1Department of Physical Sciences, Mahatma Gandhi Chitrakoot Gramodaya Vishwavidyalaya, Satna, India; 2Department of Applied Physics, Amity School of Engineering and Technology, New Delhi, India; 3Department of Physics, University of Allahabad, Allahabad, India.
Email: *rryadav1@rediffmail.com
Received May 16th, 2012; revised June 20th, 2012; accepted July 21st, 2012
Keywords: Nanofluid; Ultrasonic Attenuation; Particle Size Distribution; Ultrasonic Velocity
ABSTRACT
Study of nanofluids is important for different types of heat transfer management systems. Cupric oxide nanoparticles (CuO NPs) were prepared by the chemical route and different nanofluid samples of CuO NPs dispersed in PVA in different concentrations were prepared using ultrasonication. The apparatus acoustic particle sizer (APS-100) was used to make high precision measurements of the ultrasonic attenuation depending upon different frequencies in the frequency range 48 to 99 MHz. The ultrasonic attenuation data are inverted to particle size distribution (PSD) and are used for particle size determination of CuO NPs. Temperature dependent ultrasonic velocity in the samples is also measured. The results of ultrasonic spectroscopy are compared with the microscopic measurements such as transmission electron microscopy (TEM) and X-ray diffraction (XRD). There is good agreement between data produced by ultrasonic spectroscopy and the microscopic measurements.
1. Introduction
Nanofluids have attracted greater interest in recent years because of their enhanced thermal conductivity in comparison to that of the base fluids. Therefore, nanofluids can be used as a better heat transfer fluid in the heat exchange systems [1,2]. Nanofluids find their wide applications in fields like electronic applications, transportation, industrial cooling application, heating buildings and reducing pollution, nuclear system cooling, space and defense, energy storage, solar absorption, friction reduction, magnetic sealing, antibacterial activity, nano-drug delivery, vehicular brake fluids, nanofluids based microbial, fuel cell, nanofluids based optical filters and sensors [3]. The nanofluids can be synthesized by dispersing a very small amount of NPs having size in the range 10 - 100 nm in the base fluid like water, ethylene glycol, polyvinyl alcohol, polyvinyl pyrrolidone etc. Using the ultrasonication the dispersion of the NPs in the base fluid is made uniform.
The oxides of transition metal are an important class of semiconductors having applications in electronics, catalysis and solar energy transformation [4,5]. Among the oxides of transition metals, CuO NPs are of special interest because of their wide use in catalysis, metallurgy, high temperature superconductors and as efficient nanofluid in heat transfer applications [6-8]. CuO being a ceramic semiconductive p-type material with a low band gap of 1.21 - 1.51 eV possesses wide applications in pigment and electronic device fabrication [9]. CuO NPs are used for glucose sensing in blood serum [10,11]. There are various methods like sonochemical method, sol-gel technique, onestep solid state reaction method, electrochemical method, thermal decomposition of precursors etc. for the synthesis of CuO NPs. In present work, CuO NPs have been synthesized using the simple chemical route followed by annealing at temperatures 200˚C, 300˚C and 400˚C. The CuO NPs obtained by annealing at 200˚C have been dispersed homogeneously in PVA (4 wt%) using ultrasoniccator (30 KHz, 500 Watt) to get nanofluids of required concentrations. The particle size of the synthesized NPs is determined by using XRD, TEM and ultrasonic attenuation spectroscopy (UAS) techniques. The chemical route is chosen in present work as this method leads to metal oxides having larger surface area and nonsymmetric nanocrystalline shapes with numerous edges, corners and defects that are advantageous in absorption and catalytic processes [12].
2. Experimental Details
2.1. Synthesis
In first step of synthesis 3.0 gm of copper (II) chloride was dissolved in 160 ml of ethanol and 1.8 gm of sodium hydroxide was dissolved in 50 ml ethanol separately. The sodium hydroxide solution was added drop wise to copper (II) chloride solution with constant stirring at room temperature. As the reaction proceeds the color of the solution turns from green to greenish blue and finally to black. This black precipitate was copper hydroxide. The precipitate was filtered using centrifuge machine and washed with ethanol and DI water and it was dried at 60˚C in the electric furnace. In order to obtain CuO NPs the sample of dried copper hydroxide was annealed at temperatures 200˚C, 300˚C, and 400˚C. Finally the annealed sample of CuO NPs was grinded to get it in powdered form. An aqueous solution of PVA having concentration of 4 wt% was prepared. CuO NPs-PVA nanofluids of various concentrations were obtained by dissolving CuO NPs in the PVA solution with the aid of ultrasonicator at 300 K.
2.2. XRD, Microscopic and Ultrasonic Spectroscopic Measurements
The XRD of powdered sample of CuO NPs was recorded using a Philips P. W. 1710 diffractometer with 0.15405 nm CuKα radiation. The average particle size (d) has been calculated from the line broadening in XRD pattern using Scherrer formula:
 (1)
(1)
where λ is wavelength of X-ray, β is full width of half maximum (FWHM) and θ is Bragg’s angle in radians. The results are presented in Figure 1.
The TEM measurement of CuO NPs was performed with E. M.-C. M.-12 (Philips) transmission electron microscope operating at 200 KeV. The TEM micrograph is shown in Figures 2 and 3. APS-100 was used for the measurement of ultrasonic attenuation in the frequency range 48 - 99 MHz to determine particle size of CuO NPs and their distribution in PVA. The results are shown in Figures 4 and 5.
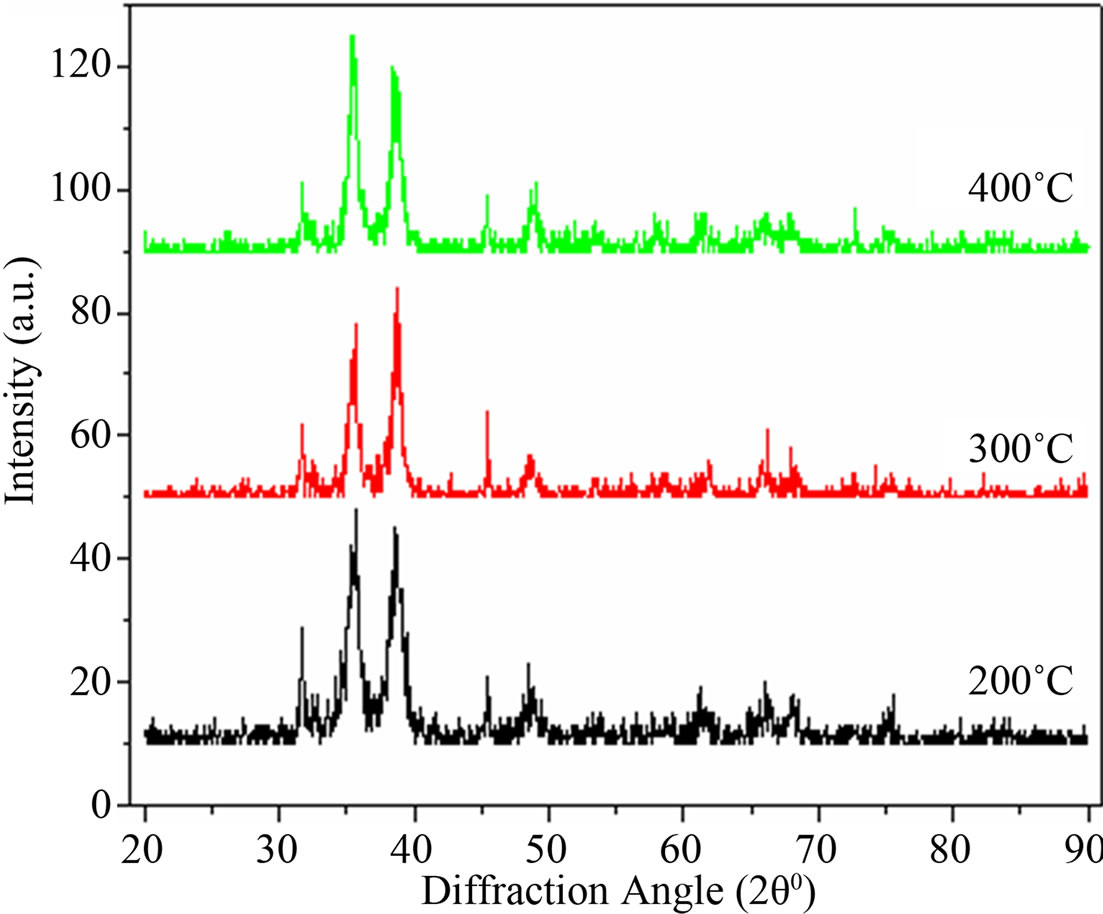
Figure 1. XRD of CuO NPs at different temperatures.
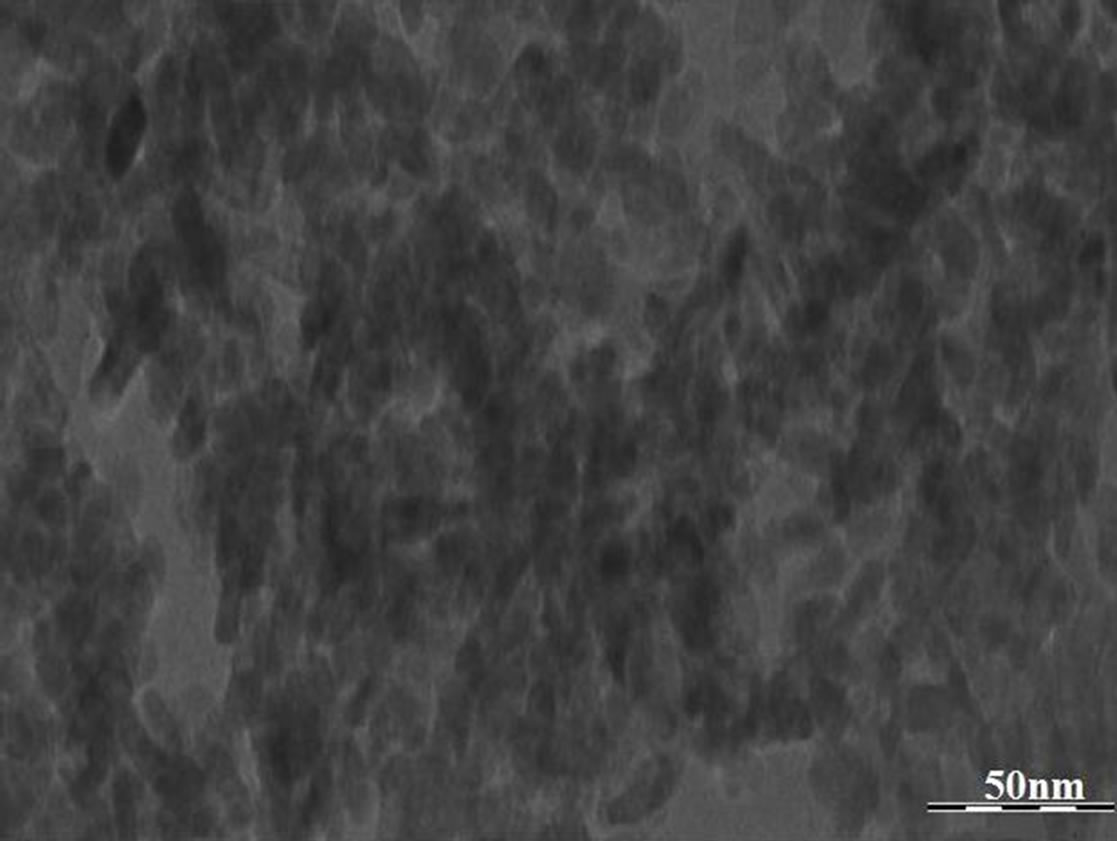
Figure 2. TEM image of CuO NPs.
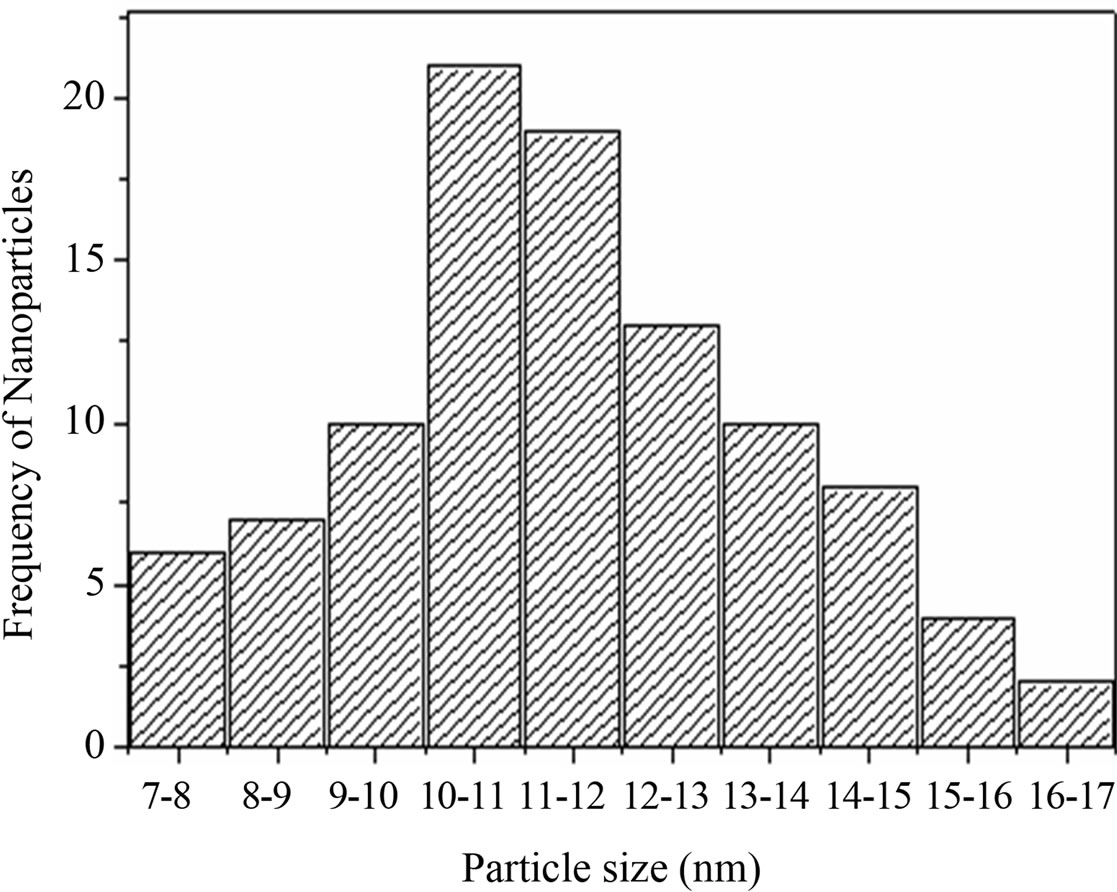
Figure 3. Histogram of frequency of particles verses their particle size.
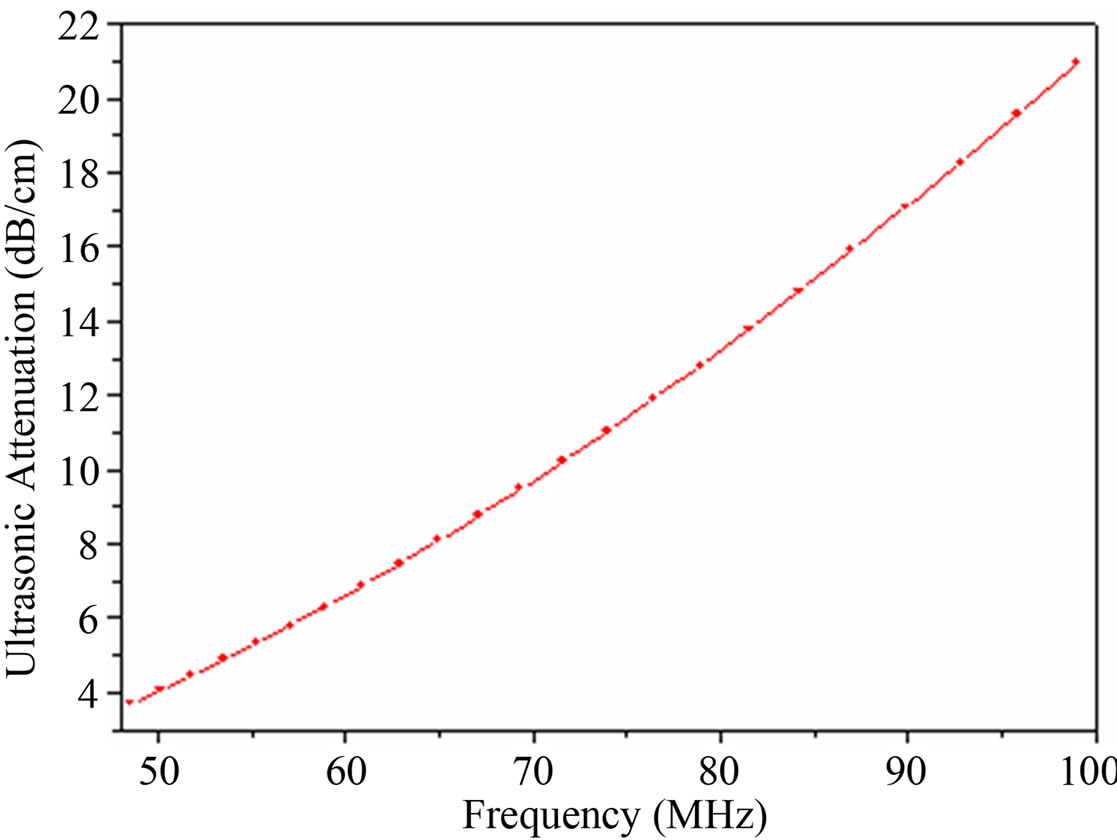
Figure 4. Plot of ultrasonic attenuation vs frequency for CuO NPs-PVA nanofluid.
2.3. Ultrasonic Velocity Measurement
Ultrasonic velocity was measured using multi-frequency nanofluid interferometer at 3 MHz frequency in the prepared nanofluid samples having different concentration of CuO NPs in PVA solution over the temperature range 30˚C - 75˚C. The temperature of the sample was maintained constant during the measurement using a thermostat and water circulation. The measured value of ultrasonic velocity is accurate to ±0.1% with an error of measurement of ±0.5˚C in temperature. The results are shown in Figure 6.
3. Results and Discussion
Intensity and position of diffraction peaks in XRD patterns of CuO NPs shown in Figure 1, on comparison with the data from JCPDS file No. 80-1917, are in good agreement and its pattern can be recognized as monoclinic crystal system having lattice parameters of the unit cell of CuO as a = 4.69 Ǻ, b = 3.43 Ǻ, c = 5.13 Ǻ. The average crystallite size of CuO NPs determined by the
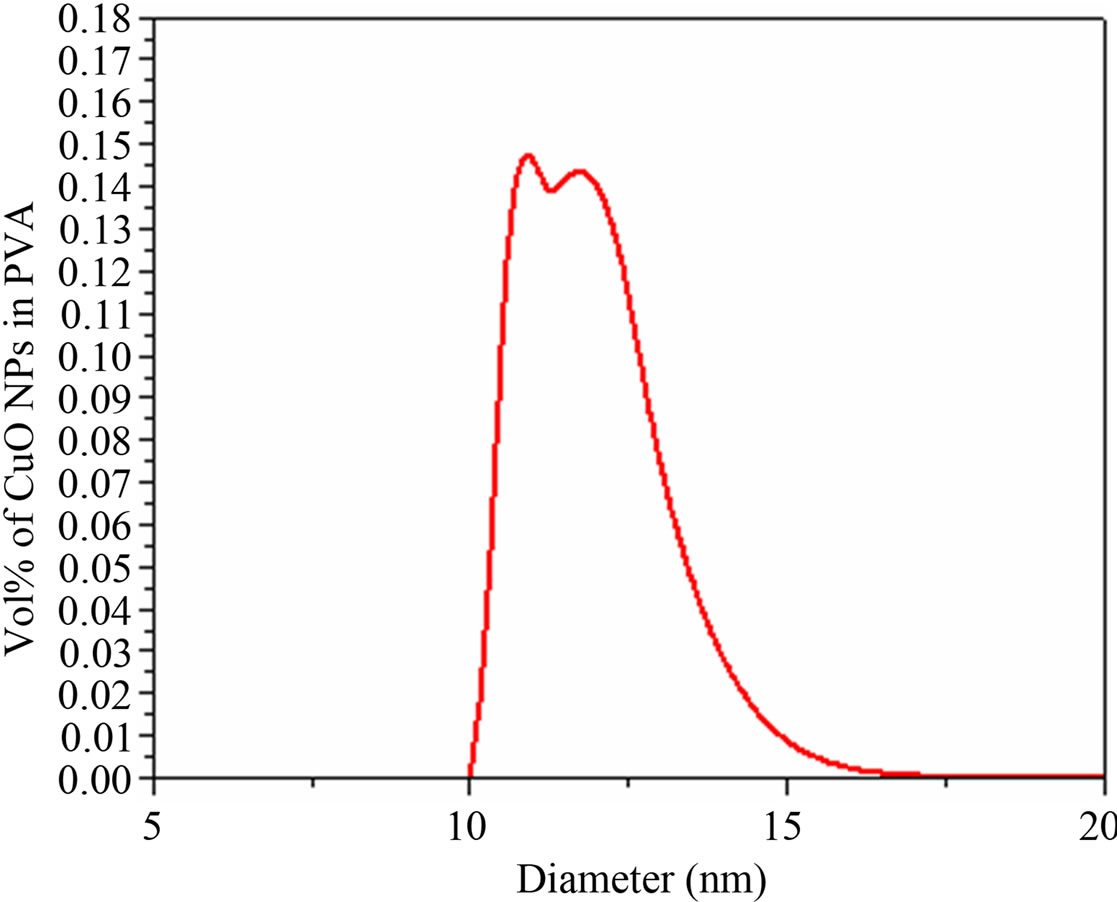
Figure 5. Particle size distribution (PSD) of CuO NPs in PVA.

Figure 6. Ultrasonic velocity vs temperature of CuO-PVA nanofluids.
Scherrer formula is 12 nm (±4 nm). The peaks at diffracttion angles 35˚ - 40˚ in Figure 1 are different at annealing temperatures 200˚C, 300˚C, and 400˚C because the particle size of the CuO NPs depends upon the annealing temperature of the sample. Figure 1 shows that the XRD line widths decrease with increase of annealing temperature and hence showing that particle size of CuO NPs is increasing with increase of annealing temperature of the sample.
The TEM image of prepared NPs is shown in Figure 2. The histogram of TEM image of CuO NPs confirms that the particle sizes of NPs lie in the range 7 - 17 nm (Figure 3) which is in good agreement with XRD analysis.
The plot of attenuation of ultrasonic wave in the nanofluid as a function of frequency is shown in Figure 4. This plot shows that ultrasonic attenuation increases with frequency of the ultrasonic wave. The ultrasonic attenuation depends upon viscous drag loss (aVD), viscous dissipation (aV), scattering and thermal losses in the nanofluid. The expression for viscous dissipation (aV) and the viscous drag loss (aVD) [13,14] is given as following respectively:
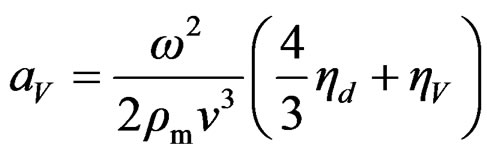 (2)
(2)
 (3)
(3)
where hd and hV are the dynamic and volume viscosities of the nanofluid, ![]() is the wave number,
is the wave number,  ,
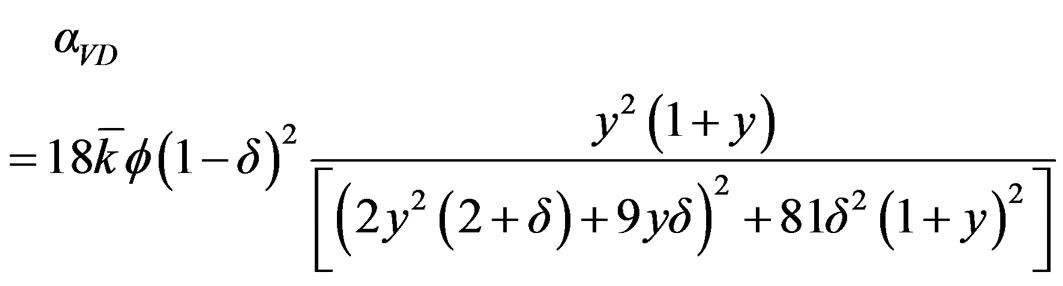
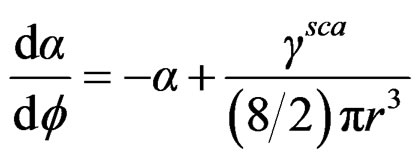
, . Biwa calculated change in ultrasonic attenuation with respect to concentration caused by scattering at micro-scale in low frequency limit. The formulations are as [15]:
 (4)
(4)
where  is scattering cross-section that depends on the frequency of wave, particle size, bulk modulus and density of carrier fluid and suspended particles.
Thermal loss is caused by temperature variation produced by propagation of sound waves in different components of suspension.
The ultrasonic attenuation in nanofluid below 48 MHz is influenced by viscous dissipation due to viscous wavelength (![]() ; h: viscosity of the matrix) is comparable to particle size (d) of the NPs. Above 48 MHz, viscous drag losses, scattering losses and thermal losses are prominent due to thermal wavelength
; h: viscosity of the matrix) is comparable to particle size (d) of the NPs. Above 48 MHz, viscous drag losses, scattering losses and thermal losses are prominent due to thermal wavelength
(![]() ; KS, ρS and CS: Thermal conductivity, density and specific heat of the dispersed particle; w: Frequency of the wave) is of the order of particle size of the NPs in the nanofluid. These losses depend on frequency and particle size of the NPs. The frequency and viscoelasticity is the governing parameter to the ultrasonic attenuation in the present nanofluid. The larger interaction of ultrasound with dispersed particles at higher frequency causes the larger scattering which causes a larger increase of the ultrasonic attenuation in high frequency region. A polynomial fit study to the ultrasonic attenuation provides that attenuation in nanofluid can be written as
; KS, ρS and CS: Thermal conductivity, density and specific heat of the dispersed particle; w: Frequency of the wave) is of the order of particle size of the NPs in the nanofluid. These losses depend on frequency and particle size of the NPs. The frequency and viscoelasticity is the governing parameter to the ultrasonic attenuation in the present nanofluid. The larger interaction of ultrasound with dispersed particles at higher frequency causes the larger scattering which causes a larger increase of the ultrasonic attenuation in high frequency region. A polynomial fit study to the ultrasonic attenuation provides that attenuation in nanofluid can be written as . For n = 0, the coefficient of frequency is equivalent to attenuation in PVA matrix. While for n ¹ 0, the coefficient of frequency is a function of particle size. As the frequency increases, the effective viscosity of a fluid decreases monotonically towards zero. This proves that the viscous drag losses are the prominent cause for the ultrasonic attenuation in this region. The ultrasonic attenuation data are used for determining particle size distribution (PSD). The plot of PSD of CuO NPs in the nanofluid determined by APS-100 is shown in Figure 5. The PSD based on ultrasonic attenuation spectroscopy confirms that the particle sizes of CuO NPs lie in the range 10 - 17 nm.
Thus the results for PSD are confirmed by the TEM method. It is observed that ultrasonic velocity is highly dependent upon the size of the NPs in nanofluid, temperature of the nanofluid, dispersion of the NPs in nanofluid and density of the nanofluid. The results of the temperature dependent ultrasonic velocity at different concentrations are shown in Figure 6. The perusal of plot reveals that the ultrasonic velocity in CuO-PVA nanofluid increases nonlinearly with temperature initially and becomes constant at higher temperatures. It is also observed from the plot that the ultrasonic velocity in CuO-PVA nanofluid increases slightly with concentration in the measured range (0.2 wt%, 0.3 wt% and 0.5 wt%) indicating that the nanofluids with small amount of NPs are less compressible according to Newton-Laplace’s relation for adiabatic compressibility: β = 1/ρC2; where ρ is density of nanofluid and C is ultrasonic velocity in nanofluid. The cause behind this increase of ultrasonic velocity with increase in concentration is due to weakening of interacttion between nanosized particle and micro sized fluid molecule and also due to decrease in density of nanofluid with increase of concentration.
The temperature dependency of ultrasonic velocity for liquids is V = V0 + V1T (V0 is ultrasonic velocity at 273˚K, V1 is temperature gradient of velocity and T is temperature rise from 273˚K). The ultrasonic velocity in liquids generally decreases with temperature due to having negative temperature gradient of velocity. The anomalous behavior of velocity can be interpreted as the nanosized CuO particles have more surface to volume ratio and formation of hydrogen bonds with PVA molecules can absorb more PVA molecules on its surface, hence making the transport easy from one point to another point, which enhances the velocity.
4. Conclusions
The following important conclusions can be drawn from this work:
Ÿ The ultrasonic spectroscopic method for the determination of size of CuO NPs and their distribution in PVA is well established. For this method no special sample preparation is required.
Ÿ Viscoelastic behavior of the CuO-PVA nanofluid is confirmed.
Ÿ These nanofluid samples can be used successfully for any heat transfer management systems in industrial applications.
REFERENCES
- S. U. S. Choi, “Enhancing Thermal Conductivity of Fluids with Nanoparticles,” International Mechanical Engineering Congress and Exhibition, San Francisco, 12-17 November 1995, pp. 99-105.
- G. Mishra, S. K. Verma, D. Singh, P. K. Yadawa and R. R. Yadav, “Synthesis and Ultrasonic Characterization of Cu/PVP Nanoparticles-Polymer Suspensions,” Open Journal of Acoustics, Vol. 1, No. 1, 2011, pp. 9-14. doi:10.4236/oja.2011.11002
- W. Yu and H. Xie, “A Review on Nanofluids: Preparation, Stability Mechanisms and Applications,” Journal of Nanomaterials, Vol. 2012, No. 2012, 2011, pp. 1-17.
- A. S. Lanje, R. S. Ningthoujam, S. J. Sharma, R. B. Pode and R. K. Vatsa, “Luminescence Properties of Sn1−xFexO2 Nanoparticles,” International Journal of Nanotechnology, Vol. 7, No. 9, 2010, pp. 979-988. doi:10.1504/IJNT.2010.034703
- Y. Jiang, S. Decker, C. Mohs and K. J. Klabunde, “Catalytic Solid State Reactions on the Surface of Nanoscale Metal Oxide Particles,” Journal of Catalysis, Vol. 180, No. 1, 1998, pp. 24-35. doi:10.1006/jcat.1998.2257
- P.-O. Larsson and A. Andersson, “Complete Oxidation of CO, Ethanol, and Ethyl Acetate over Copper Oxide Supported on Titania and Ceria Modified Titania,” Journal of Catalysis, Vol. 179, No. 1, 1998, pp. 72-89. doi:10.1006/jcat.1998.2198
- V. Chikán, Á. Molnár and K. Balázsik, “One-Step Synthesis of Methyl Isobutyl Ketone from Acetone and Hydrogen over Cu-on-MgO Catalysts,” Journal of Catalysis, Vol. 184, No. 1, 1999, pp. 134-143. doi:10.1006/jcat.1999.2437
- C. P. Poole, T. Datta, H. A. Farach, M. M. Rigney and C. R. Sanders, “Copper Oxide Superconductors,” John Wiley and Sons, New York, 1988.
- O. Zabihi and S. Ghasemlou, “Nano-CuO/Epoxy Composites: Thermal Characterization and Thermo-Oxidative Degradation,” International Journal of Polymer Analysis and Characterization, Vol. 17, No. 2, 2012, pp. 108-121. doi:10.1080/1023666X.2012.639930
- Y. Li, Y. Wei, G. Shi, Y. Xian and L. Jin, “Facile Synthesis of Leaf-Like CuO Nanoparticles and Their Application on Glucose Biosensor,” Electroanalysis, Vol. 23, No. 2, 2011, pp. 497-502. doi:10.1002/elan.201000343
- S. Liu, J. Tian, L. Wang, X. Qin, Y. Zhang, Y. Luo, A. M. Asiri, A. O. Al-Youbi and X. Sun, “A Simple Route for Preparation of Highly Stable CuO Nanoparticles for Nonenzymatic Glucose Detection,” Catalysis Science and Technology, Vol. 2, No. 4, 2012, pp. 813-817. doi:10.1039/c2cy00453d
- C. L. Carnes, J. Stipp and K. J. Klabunde, “Synthesis, Characterization and Adsorption Studies of Nanocrystalline Copper Oxide and Nickel Oxide,” Langmuir, Vol. 18, No. 4, 2002, pp. 1352-1359. doi:10.1021/la010701p
- R. J. Urick, “The Absorption of Sound in Suspensions of Irregular Particles,” Journal of Acoustical Society of America, Vol. 20, No. 3, 1948, pp. 283-289. doi:10.1121/1.1906373
- A. Józefczak and A. Skumiel, “Field-Induced Aggregates in a Bilayer Ferrofluid Characterized by Ultrasound Spectroscopy,” Journal of Physics: Condensed Matter, Vol. 18, No. 6, 2006, pp. 1869-1876. doi:10.1088/0953-8984/18/6/004
- S. Biwa, Y. Watanabe, S. Motogi and N. Ohno, “Analysis of Ultrasonic Attenuation in Particle-Reinforced Plastics by a Differential Scheme,” Ultrasonics, Vol. 43, No. 1, 2004, pp. 5-12. doi:10.1016/j.ultras.2004.03.002
NOTES
*Corresponding author.