Journal of Modern Physics
Vol.4 No.3(2013), Article ID:28875,5 pages DOI:10.4236/jmp.2013.43053
Study of Surface and Subsurface Defects in Materials by Photothermal Deflection Technique: Theory and Experience
Photothermal Laboratory, University of Carthage, Tunis, Tunisia
Email: dhouibamina82@yahoo.fr
Received January 3, 2013; revised February 2, 2013; accepted February 12, 2013
Keywords: Photothermal Deflection Technique; Surface Defect; Subsurface Defect; Thermal Wave
ABSTRACT
Photothermal deflection is widely used to study defects in materials. Both high spatial resolution and high sensitivity are required to detect them. In order to improve the theoretical model in the case of uniform heating (one dimensional heat treatment) we have chosen to heat the sample by a halogen lamp. The sample which contains a known surface and subsurface defects is first covered by a thin graphite layer and placed in air. The sample fixed on a vertical holder is able to move in the x and y directions thanks a two stepper motors. The measurement showed excellent agreement between experimental and simulation results.
1. Introduction
Photothermal imaging is well known as one of the most powerful techniques for the non-destructive test. This technique is based on detecting the thermal wave generated by the periodic heating of a sample with modulate pump beam. A wide variety of methods for the non-destructive study of surface, subsurface defects and structures in solids have been developed rapidly. Among these methods include the photo acoustic method [1,2], the photothermal radiometry method [3], a piezoelectric transducer method [4] and photothermal deflection (mirage detection) method [5,6]. R. Ritter and B. Schmitz [7] use the photothermal radiometry method to investigate the lack of adhesion between surface layer and base material. These delaminations may be caused by defective boundaries between coating and substrate or by varied composition and porosity of the coating material. Some Authors have studied surface and sub-surfaces defects [8] by scanning the sample surface but it fails to be compared to a theoretical model.
In this work we have scanned samples containing surface and subsurface defects and we have shown the effect of these defects on the amplitude and the phase of the photothermal detected signal. For these investigations the sample, covered by a thin graphite layer, is slowly stepped in respect to the pump beam and the detected photothermal signal is plotted versus the scanning distance. In order to establish the efficiency of photothermal imaging, we compare the theoretical model with experimental results.
In this paper, we start by presenting theoretical model based on resolving heat equations on one dimension for a sample with surface defect, these results will be used for drawing the theoretical curves of amplitude and phase of the signal versus displacement, then we will show the experimental set up which is used, finally we will compare theoretical results with experimental ones. The best agreement between the two results makes us validate experience and theory.
2. Theory
We will consider the geometry presented in Figure 1, where the solid sample is covered with a thin graphite layer fixed on a backing.  are respectively the thicknesses of the fluid, graphite, sample and backing.
The fluid could be either the air or another medium such as the paraffin oil. In our case we are going to consider the air, and the whole system of the four layers is heated by a modulated light beam of intensity 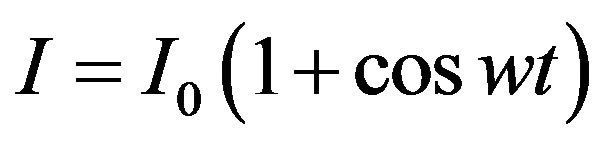 . The optical absorption of the graphite layer will generate a thermal wave that will propagate into the sample and the surrounding fluid inducing a temperature gradient then a refractive index gradient in the fluid [9].
As presented in the experimental set up, a laser probe beam crossing the fluid will be deflected. To calculate this deflection we must determine the temperature on the surface’s sample. This expression will be obtained by
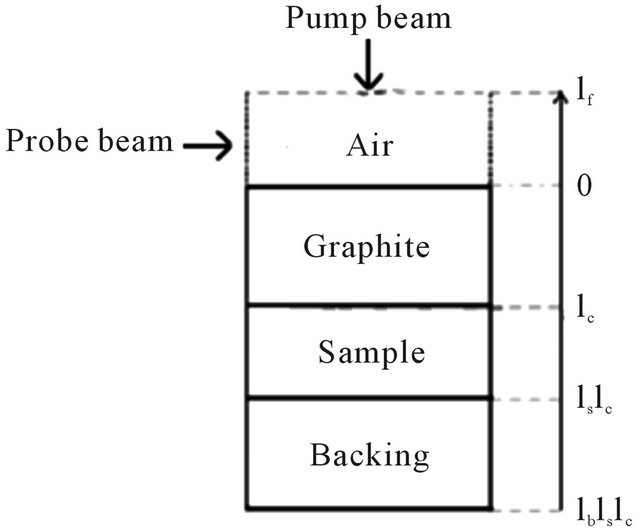
Figure 1. Geometry of the four layers system of photothermal deflection effect.
solving the heat equations in each medium. If we assume that only the graphite layer absorbs incident light with the absorption coefficient a, the heat equations could be written on Equation (1) [10].
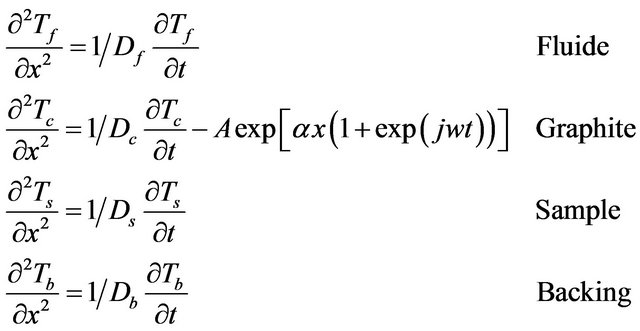 (1)
(1)
Ti and Di are, respectively, the temperature and the thermal diffusivity of the medium i. After solving these equations, we obtain the expressions of periodic temperature in each medium as written on Equation (2)
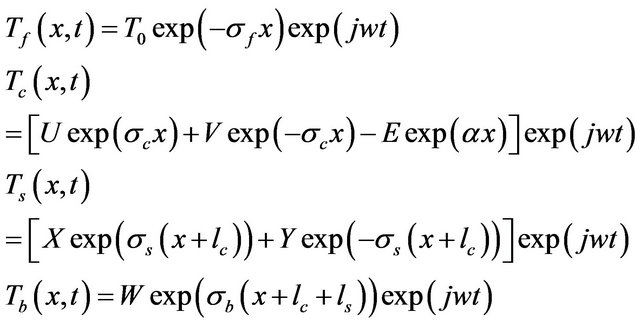 (2) Applying the conditions of continuity of temperature and heat flux at different interfaces, we could determine the constants and we obtain the expression of the temperature T0 on the surface of the sample which is written on Equation (3).
Since air is not assumed absorbing the incident light and the probe beam skims the surface of the sample at a distance of about 100 micrometers, the temperature in the fluid can be written as 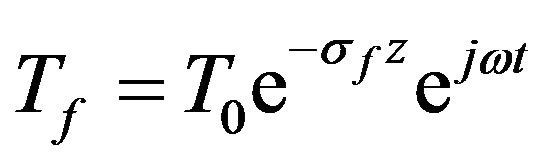 where “z” is the distance between the probe beam axis and the sample surface. So the deflection may be written as:
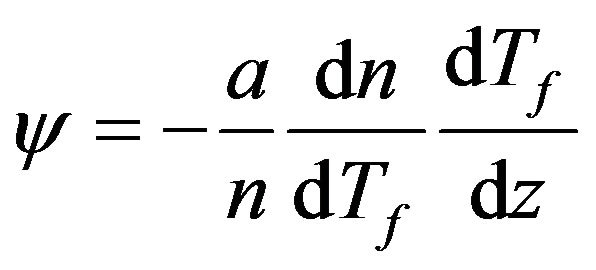 .
.
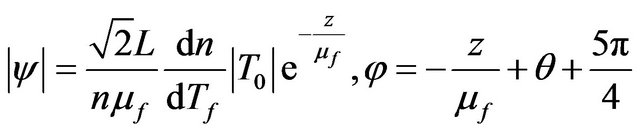
The amplitude and the phase of the deflection are respectively:
As already reported, we will start by studying theoretically the case of a sample with a rectangular groove on the surface. The geometry of the sample is presented on Figure 2.
Using the expressions of the temperatures on the theoretical program on maple 9.5, we could draw the curves representing the amplitude and the phase variations of the photothermal signal at the sample surface. Figures 3 and 4 are the theoretical curves for the two following cases:  and
and  at different modulations frequencies.
3. Experimental Set-Up
The experimental set-up is described in Figure 5. In our case, the pump beam is a halogen lamp (50 W of power) focused on the sample surface with an optical lens of 50 mm focal length. The light is modulated using a mechanical chopper (SR540). The laser probe beam (He-Ne) skimming the sample surface will be deflected. The sample is fixed on X-Y table (two stepper motors Newport Miniature linear stages MFA) commanded by an Universal Motion Controller/Driver ESP300 which gives the
|
|
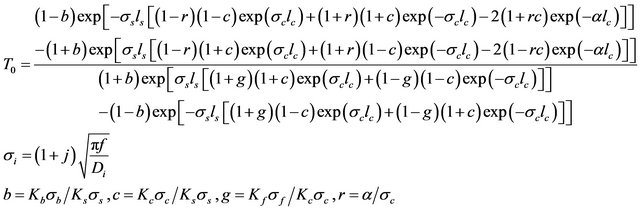
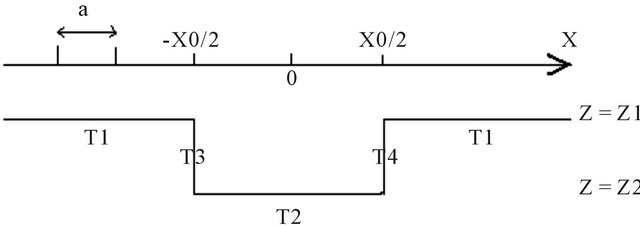
Figure 2. Geometry of a sample with a rectangular surface defect. x0: width of the defect; a: diameter of the pump beam.
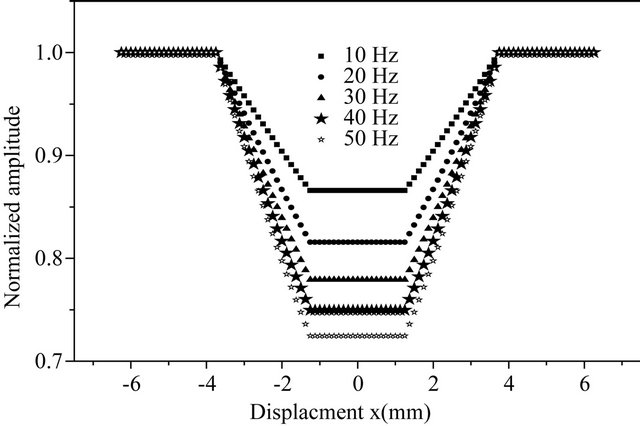
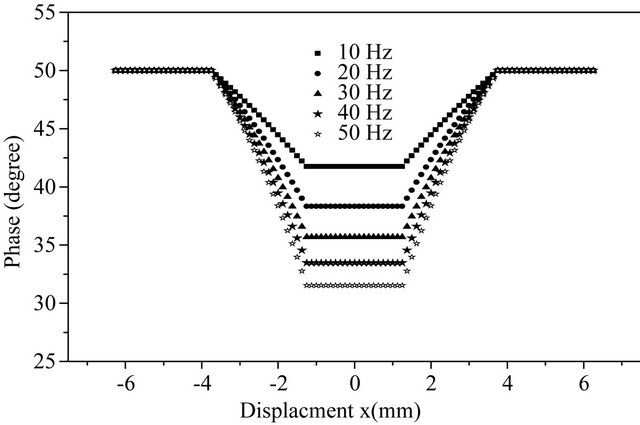
Figure 3. Theoretical amplitude and phase variations for a < x0.
possibility of displacement horizontally and vertically. A program in Visual Basic makes automatic measurements of the photothermal signal. The system works in such a way that it measures the signal at one point, and then moves to the next. The deflection of the probe beam is measured thanks to a silicon photodetector of four quadrants (QD50T) linked to a lock-in amplifier (EG&G Model 5209) giving the amplitude and the phase of the photothermal signal. A personal computer was used to store the amplitude and the phase of the signal and draw their variations with the displacement.
4. Experimental Results and Discussion
The pump beam which is perpendicular to the sample’s
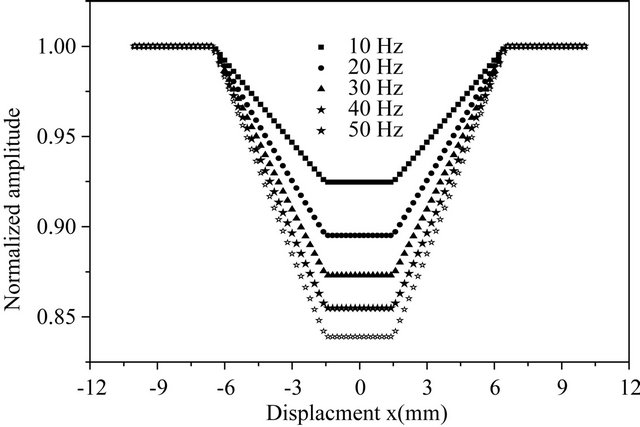
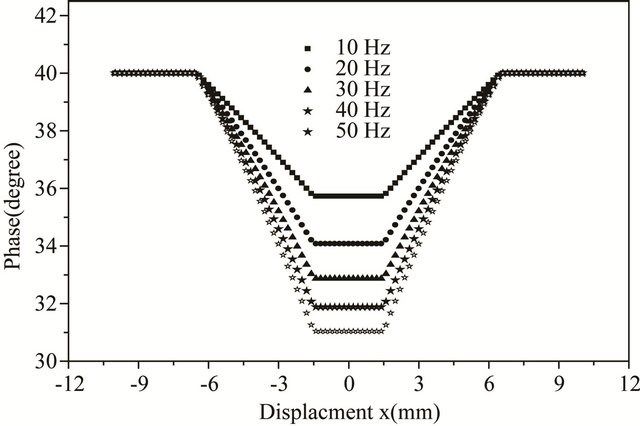
Figure 4. Theoretical amplitude and phase variations for a > x0.
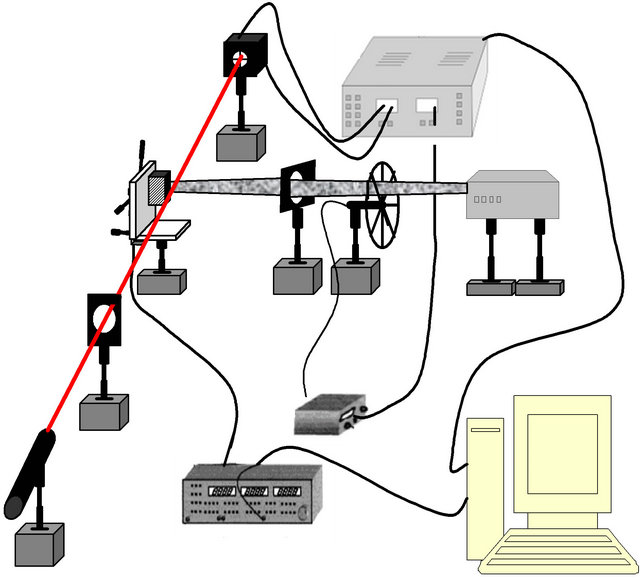
Figure 5. Experimental set up.
surface is focused, at the beginning, outside of the defect. By moving the sample, the signal remains constant along the flat surface. As soon as the pump beam arrives at defect, there is a change in signal according to geometry of the defect. When the task of the pump beam will be fully focused at the defect, the signal becomes again constant and we observe the same phenomenon on the other side.
As a first step, we have study a known surface defect, consisting of a groove hollowed into Plexiglas. The shape of the defect is 5 mm of width which is greater than the pump beam size (a = 3 mm) and a depth of 150 µm. One can observe in Figure 6 the good agreement between experimental and theory curves which proves the validity of our theoretical model.
In a second study, we consider two samples of Aluminum the first having a surface defect identical to the previous Plexiglas one and the second presenting a subsurface defect shown in Figure 7.
On Figure 8 are drawn the theoretical and experimental curves of the first aluminum sample, on the second Aluminum sample, the defect was carved on the back face of the sample by keeping the material to a thickness of about 100 microns. The sample presents a cylindrical defect of about 5 mm of diameter. The scan is effected in a direction perpendicular to the axis of the cylindrical hole.
In Figure 9 are presented the experimental and the theoretical results of amplitude and phase. We remark from this figure that the amplitude of the photothermal signal increases when the pump beam passes above the
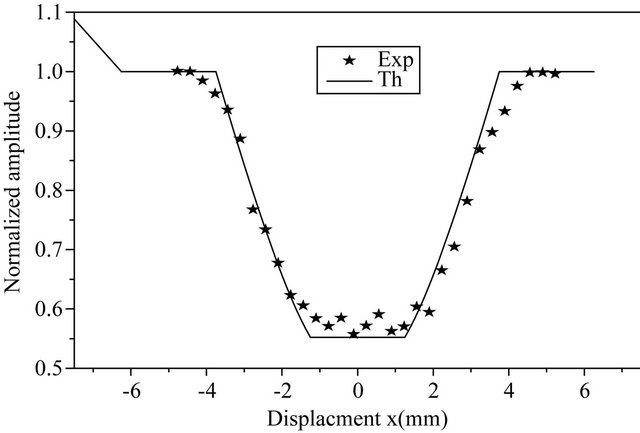
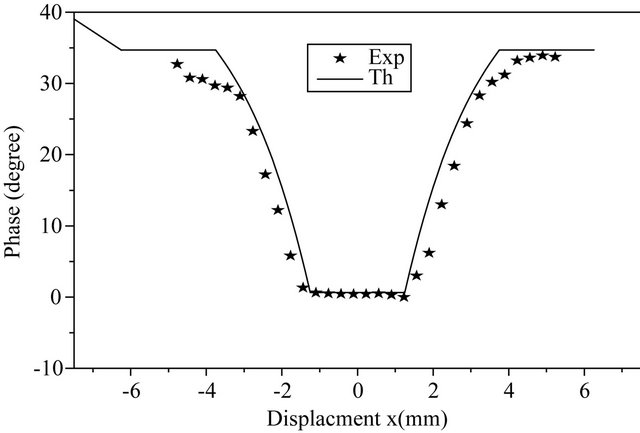
Figure 6. Experimental and theoretical variations of amplitude and phase for a surface defect on plexiglas sample.
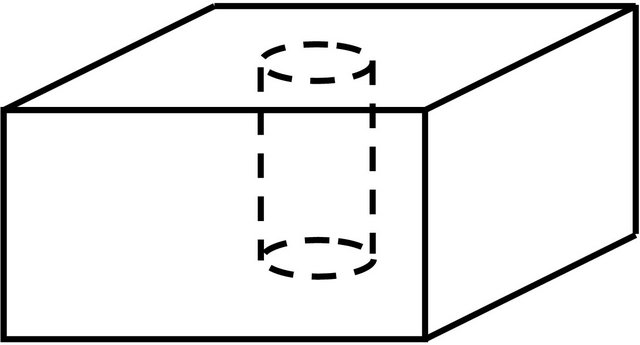
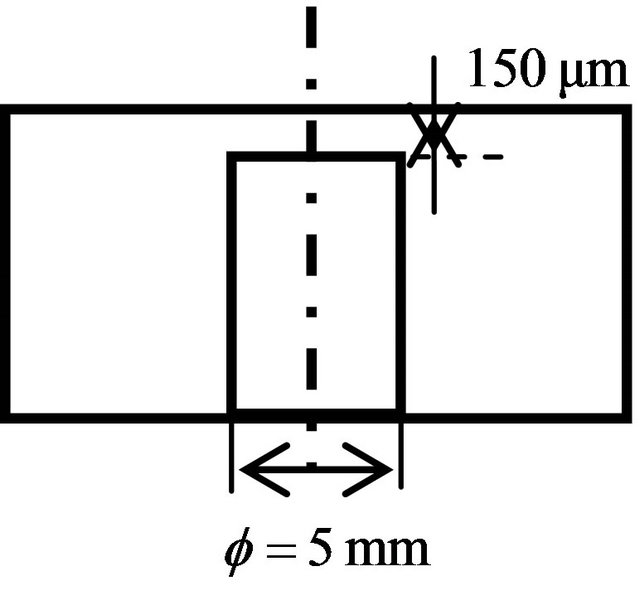
Figure 7. Geometry of subsurface defect in an aluminium sample.
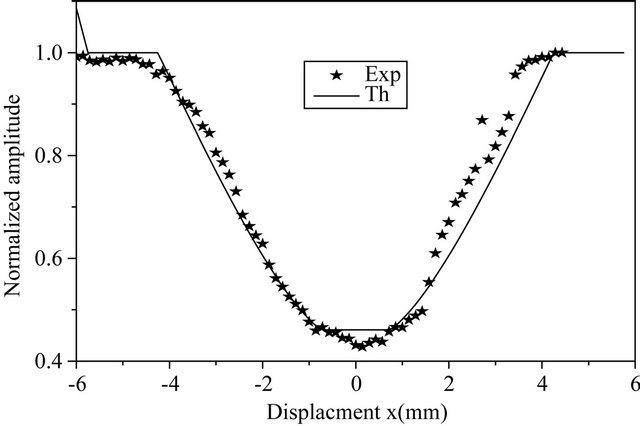
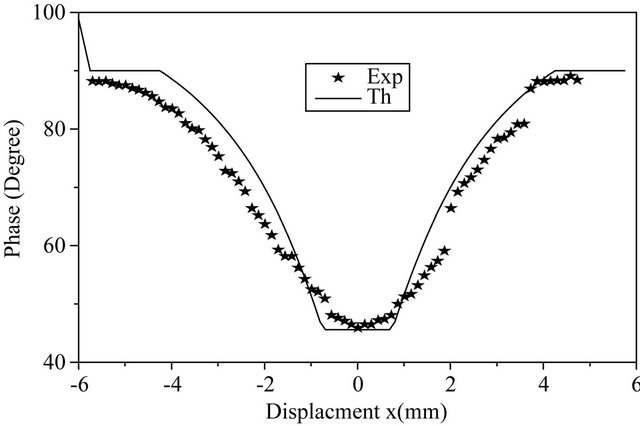
Figure 8. Experimental and theoretical variations of amplitude and phase for a surface defect on aluminium sample.
hole. The increase of signal is due to the fact that the thermal diffusivity is much slower in a cavity filled with air than in solid aluminum. Also, in this case, we show the good agreement between experimental and theoretical curves so we could consider that our theoretical model is suitable with this problem.
The little disagreement between the theoretical and experimental curves is due, in fact, to the geometry of the
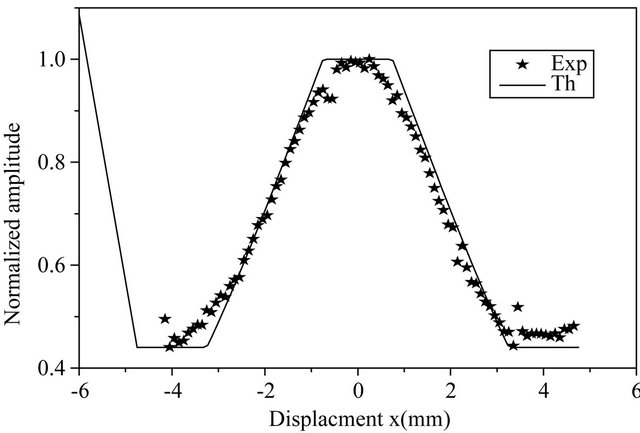
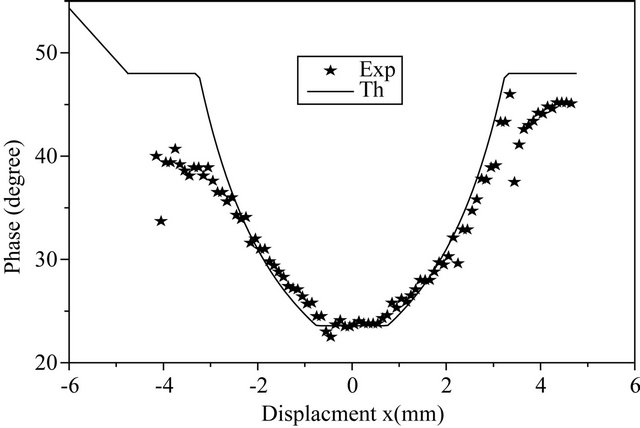
Figure 9. Experimental and theoretical variations of amplitude and phase for a subsurface defect in an aluminium sample.
defect that is not perfectly rectangular.
5. Conclusion
In this work we have tested the one dimensional theoretical model that we developed in the uniform heating case, this case can be experimentally realized by heating the sample using a halogen lamp. We have considered in a first study a surface defect illustrated by a rectangular groove cut into Plexiglas and another in aluminum. A subsurface defect described by a hole of cylindrical shape situated at a depth of 100 µm and whose axis is parallel to the aluminum surface sample. The good agreement between the experimental and the theoretical curves of amplitude and phase of the photothermal signal, prove the validity of our theoretical model. Our future project will be to characterize some unknown subsurface defects in order to obtain information about their size, depth and nature.
REFERENCES
- A. Rosencwaig, “Photoacoustics and Photoacoustic Spectroscopy,” Wiley Interscience, New York, 1980, pp. 170 and 295
- Y. H. Wong, R. L. Thomas and G. F. Hawkins, “Subsurface Structures of Solids by Scanning Photoacoustic Microscopy,” Applied Physics Letters, Vol. 35, No. 5, 1979, pp. 368-369. doi:10.1063/1.91153
- P. E. Nordal and S. O. Kanstad, “Photothermal Radiometry,” Physica Scripta, Vol. 20, No. 5-6, 1979, p. 659. doi:10.1088/0031-8949/20/5-6/020
- A. Rosencwaig and G. Busse, “High-Resolution Photoacoustic Thermal-Wave Microscopy,” Applied Physics Letters, Vol. 36, No. 9, 1980, pp. 725-727. doi:10.1063/1.91646
- A. C. Boccara, D. Fournier and J. Badoz, “Thermo-Optical Spectroscopy: Detection by the ‘Mirage Effect’,” Applied Physics Letters, Vol. 36, No. 2, 1980, pp. 130- 132. doi:10.1063/1.91395
- J. C. Murphy and C. Aamodt, “Photothermal Spectroscopy Using Optical Beam Probing: Mirage Effect,” Journal of Applied Physics, Vol. 51, No. 9, 1980, pp. 4580- 4588. doi:10.1063/1.328350
- R. Ritter and B. Schmitz, “Photothermal Inspections of Adhesion Strengths and Detection of Delaminations,” QIRT96-Eurotherm Series50-EdizioniETS, 1997
- J. L. Bodnar, M. EgCe, C. Menu, R. Besnard, A. Le Blanc, M. Pigeon and J. Y. Sellier, “Cracks Detection by a Moving Photothermal Probe,” Journal de Physique IV Colloque C7, Supplément au Journal de Physique 111, Vol. 4, 1994.
- G. Imen, “Caractérisation Thermique et Optique des Matériaux Semi-Conducteurs par la Technique de Déflexion Photothermique,” Ph.D. Thesis, Faculté des Sciences de Tunis Université el Manar, 2011.
- T. ghrib, N. Yacoubi and F. saadallah, “Simultaneous Determination of Thermal Conductivity and Diffusivity of Solid Samples Using the ‘Mirage Effect’ Method,” Sensors and Actuators, Vol. A135, No. 2, 2007, pp. 346- 354. doi:10.1016/j.sna.2006.07.024