Advances in Bioscience and Biotechnology
Vol. 3 No. 7A (2012) , Article ID: 25177 , 8 pages DOI:10.4236/abb.2012.327129
Efficacy of 1-(N-acetyl-6-aminohexyl)-3-hydroxypyridin- 4-one (CM1) in treatment of iron-loaded hepatocyte cultures
![]()
1Department of Biochemistry, Faculty of Medicine, Chiang Mai University, Chiang Mai, Thailand
2College of Medicine and Public Health, Ubon Ratchathani University, Ubon Ratchathani, Thailand
3Institute of Research and Development, Government Pharmaceutical Organization, Ministry of Public Health, Bangkok, Thailand
4Thalassemia Research Center, Institute of Molecular Bioscience, Mahidol University Salaya Campus, Nakornpathom, Thailand
Email: u4305084@hotmail.com, ratana@chiangmai.ac.th, chada@health.moph.go.th, grsfc@mahidol.ac.th, *ssrichai@med.cmu.ac.th
Received 23 August 2012; revised 27 September 2012; accepted 23 October 2012
Keywords: Iron; 3-Hydroxypyridin-4-One; Labile Iron Pool; Lipid Peroxidation; Hepatocyte
ABSTRACT
Excessive iron is toxic to cells and organelles, where it can generate harmful reactive oxygen species (ROS) resulting in oxidative tissue damage. Liver is the major organ for iron storage and redox active iron in this tissue can cause fibrosis and cirrhosis in β-thalassemia patients. Desferrioxamine (DFO), deferiprone (DFP) and deferasirox (DFX) are clinically approved iron chelators used for the treatment of patients with iron overload, but none of these chelators are completely free of side effects. In this study we report the properties of a new iron chelator 1-(Nacetyl-6-aminohexyl)-3-hydroxypyridin-4-one (CM1). The labile iron pool (LIP) content was measured by using a calcein fluorescence technique and the lipidperoxidation products were quantified using the thiobarbituric acid reactive substances (TBARS) method. The cytotoxicity of CM1 was also examined with the (3-(4,5-dimethylthiazol-2-yl)-2,5-diphenyltetrazolium bromide (MTT) assay. CM1 was demonstrated to reduce iron-induced redox damage and to decrease the levels of the intracellular iron pool in hepatocytes. CM1 is a potentially useful iron-chelating agent which has potential to ameliorate liver iron overload and ROS-induced lipid peroxidation. CM1 is currently under investigation for oral efficacy.
1. INTRODUCTION
Iron plays a crucial role in oxygen sensing and transport, electron transfer and catalysis [1]. Secondary iron overload in β-thalassemia patients is commonly caused by increased dietary iron absorption and multiple blood transfusions [2]. The iron catalyzes production of reactive oxygen species (ROS) via the Fenton reaction which consequently leads to damage of the heart, liver, pancreas and endocrine glands, resulting in organ dysfunction [3]. Excessive iron accumulation predominantly in ferritin or hemosiderin in the liver can cause progressive liver injury, cirrhosis and eventually hepatocellular carcinoma in iron-overload patients [4]. The cellular labile iron pool (LIP) which is transitory and serves as a crossroad of cellular iron metabolism, is redox-active and chelatable [5,6]. It can be modulated by biochemical mechanisms that override the iron-regulatory protein (IRP) linked activities and contribute to basic cellular functions [7]. Addition of extracellular iron enhanced formation of ROS and lipid peroxide (LPO) in primary cultures of rat hepatocytes, whereas DFO and DFP prevented the ROS and LPO formations [8,9].
Iron chelation is the only medical regime which prevents excessive iron accumulation and neutralizes toxic levels of LIP [10]. Iron chelators can also be used for the treatment of alcoholand iron-induced liver injury and fibrosis [11]. Desferrioxamine (DFO), deferiprone (DFP) and deferasirox (DFX) are all iron chelators which have been developed for the treatment of β-thalassemia patients experiencing iron overload [12-14]; however some associated side effects have been reported with the use of these three compounds [15-17].
Currently, we have characterized the chemical structure and studied the biological activity of a new bidentate synthetic iron chelator, CM1 [18]; the compound is a 3- hydroxypyridin-4-one (HPO) N-[6-(3-hydroxy-2-methyl- 4-oxo-4H-pyridin-1-yl)-hexyl]-acetamide. In this investigation, we report the efficacy in the reduction of LIP levels, anti-lipid peroxidation and cytotoxicity of CM1 in iron-loaded hepatocytes.
2. MATERIALS AND METHODS
2.1. Chemicals
Dulbecco’s modified Eagle medium (DMEM), fetal bovine serum (FBS), penicillin/streptomycin, trypsin-EDTA and collagenase type IV were from Gibco BRL. Ferrocence, dexamethazone and thiobarbituric acid (TBA) were from Sigma-Aldrich Chemical company. 3’,6’- Di(O-acetyl)-2’,7’-bis[N,N-bis(carboxymethyl)aminome thyl] fluorescein tetraacetoxy-methyl ester (Calcein-AM) and (3-(4,5-dimethylthiazol-2-yl)-2,5-diphenyltetrazolium bromide (MTT) were from Invitrogen. Ferric ammonium citrate (FAC) and ferrous ammonium sulfate (FAS) were from BDH Chemicals Ltd. DFO (Desferal®) was purchased from a drug store at Maharaj Nakorn Chiang Mai Hospital, Faculty of Medicine, Chiang Mai University, Chiang Mai. DFP (GPO-L-One®) was kindly donated by Dr. Chada Phisalaphong, PhD. at the Government Pharmaceutical Organization, Bangkok, Thailand.
2.2. HepG2 Cell Culture
Human hepatocellular carcinoma (HepG2) cells were obtained from Medical Molecular Biology Research Unit of National Center for Genetic Engineering and Biotechnology (BIOTEC), Thailand. Cells were cultured in DMEM medium containing 10% (v/v) FBS, 2 mM Lglutamine and 1.0% penicillin-streptomycin at 37˚C in a humidified 5% CO2 atmospheric incubator [19].
2.3. Mouse Hepatocyte Culture
The animal study was conducted with approval of the Institutional Animal Care and Use Committee (IACUC) of Faculty of Medicine, Chiang Mai University (Reference Number—3/2554). Mouse primary hepatocytes were isolated from C57BL/6 livers of 2 - 3 month-old (weight 25 - 30 g) received normal diet or fed with 0.2% (w/w) ferrocene-supplemented diet (Fe diet). Twelve mice were anesthetized by vaporized diethyl ether and their livers were perfused in situ with 0.025% (w/v) collagenase type IV solution. The isolated hepatocytes were filtered through sterile gauze sheet, sedimented by lowspeed centrifugation and resuspended in DMEM. The hepatocytes were cultured in the DMEM supplemented with 1% penicillin-streptomycin, 1 µM dexamethazone, 0.2 U/ml insulin and 20% (w/v) FBS at 37˚C under 5% CO2 humidified atmosphere [20].
2.4. Cytotoxicity Test
Cell toxicity was examined using the MTT dye assay
[21]. Cells (3 × 10³ cells/well) were treated with the tested compounds at 37˚C for the indicated time and incubated with MTT dye solution. The insoluble purple formazan product was solubilized with DMSO into a colored solution. The absorbance of this solution was measured at 540/630 nm with a UV/VIS dual-wavelength spectrophotometer (Shimadzu, Kyoto Japan).
2.5. Anti-Lipid Peroxidation Effect
To investigate for a preventive effect, HepG2 cells (1 × 10⁶ cells) were pretreated with the DFO, DFP and CM1 solutions, then exposed to 1 mM FAC (FeIII) [22] and 1 mM FAS (FeII) solutions [21] separately. The treated cells were quantified lipid-peroxidation product as malondialdehyde (MDA) using the TBARS method as described below.
To investigate for a therapeutic effect, HepG2 cells (1 × 10⁶ cells) were initially treated with 1 mM FAC and FAS solutions, and subsequently treated with DFO, DFP and CM1 solutions. The treated cells were measured for MDA content using the TBARS method.
2.6. TBARS Assay
Treated cells were washed three times with PBS pH 7.4 solutions and trypsinized with 1x trypsin-EDTA solution. Cell pellets were collected by low-speed centrifugation and mixed with the lysis solution containing 10% (w/v) SDS and 0.4% (w/v) thiobarbituric acid (TBA) in 10% acetic acid, pH 5.0. Total volume of the mixture was adjusted to 0.8 ml with distilled water and incubated at 90ºC for 60 min. n-Butanol (0.8 ml) was added to the lysate in order to extract the pink-colored MDA product. Finally, the solution was shaken vigorously, centrifuged at 1500 rpm for 15 min and the absorbance was measured by a spectrophotometer at 532 nm against reagent blank [23].
2.7. Chelation of Intracellular LIP
HepG2 cells and isolated mouse hepatocytes (density 5000 cells/well) were loaded in vitro with 0.5 mM FAC solution at 37ºC for 24 hr. The cells were treated with CM1, DFO and DFP solutions at the concentrations of 0 - 70 µM for 6 and 12 hr (HepG2 cells) and for 6, 12 and 24 hr (isolated mouse hepatocytes). The amount of LIP was measured using the calcein fluorescent technique as described below.
In addition, the in vivo iron-loaded mouse hepatocytes were treated with CM1, DFO and DFP solutions at the concentrations of 0 - 25 µM for 6, 12 and 24 hr. The amount of LIP was measured using the calcein fluorescent technique as described below.
2.8. Measurement of LIP Content
Amount of intracellular LIP was determined using a calcein fluorescent probe and was inversely proportional to measured fluorescence intensity (FI) [7,24,25]. The cells were incubated with 1 µM calcein-AM solution in DMEM at 37˚C for 15 min and washed three times with HEPES buffer solution. FI was measured using a 96-well plate spectrofluorometer (λexcitation 485 nm, λemission 535 nm) [26].
2.9. Statistical Analysis
The results were shown as mean ± SEM for all parameters. Statistical significance of the obtained data was analyzed by using Student’s t-test.
3. RESULTS
3.1. Cytotoxicity Test
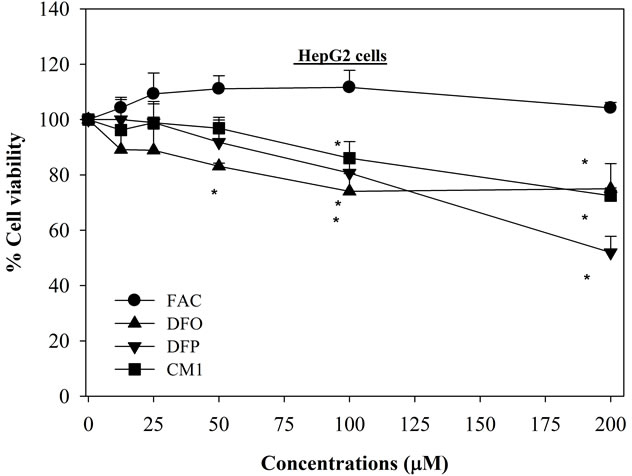
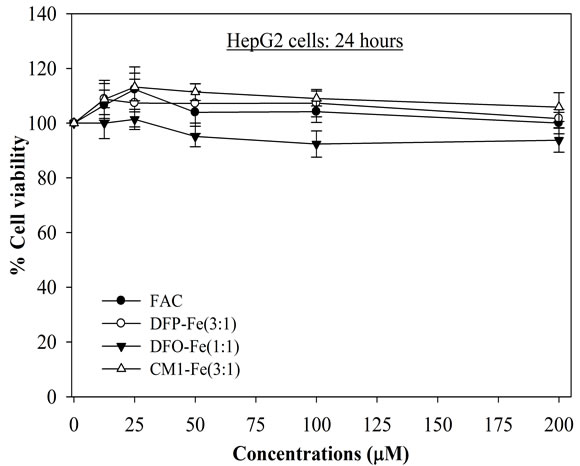
The IC20 values of DFO, DFP and CM1 in HepG2 cells were found to be 70, 100 and 140 µM, respectively (Figure 1(a)), CM1 being the least toxic compound. With iron-loaded mouse hepatocytes, the hydroxypyridinone chelators were found to be less toxic, showing cell viability > 95% (Figures 1(b) and (c)). In contrast DFO, at concentrations above 25 μM, is more toxic to in vitro iron-loaded hepatocytes (Figure 1(b)). When the hydroxypyridinones were presented as neutral 3:1 complexes, there was little damage induced in HepG2 cells even after 48 hr incubation (Figure 2); for concentrations up to 100 μM, the cell viability was greater than 90%. In contrast, although ferroxamine (FO) was found not to be toxic after 24 hr exposure, treatment for an additional 24 hr rapidly decreased numbers of viable HepG2 cells in a concentration-dependent manner (IC50 = 40 µM) (Figure 2(b)). Interestingly the IC50 value of FO was found to lower than for the unbound DFO (Figure 1(a)).
3.2. Anti-Lipid Peroxidation Effect
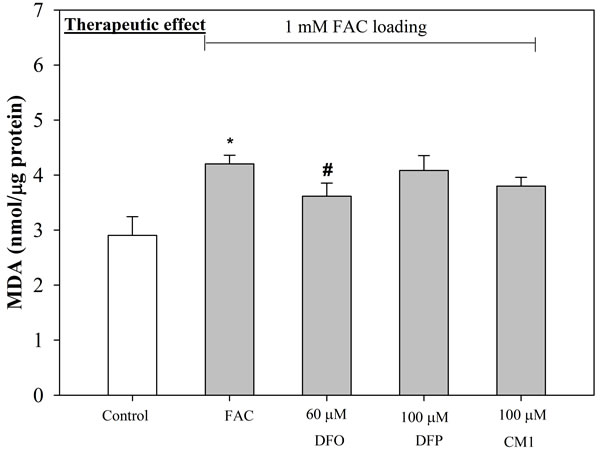
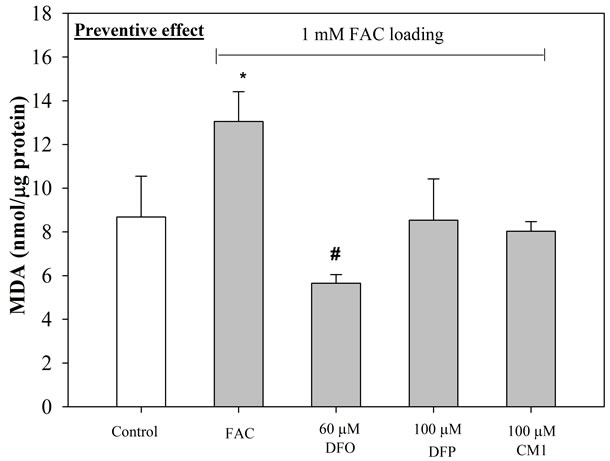
The amount of lipid-peroxidation product, MDA detected in FAS-treated HepG2 cells was found to be marginally higher than in FAC-treated HepG2 cells (Figure 3). Under conditions where the cells are pre-incubated with the iron preparations, followed by exposure to 60 µM DFO, 100 µM DFP and 100 µM CM1 for 24 hr, the levels of MDA were lower in both types of iron-loaded HepG2 cells, although there was a larger influence on the cells loaded with FAS (Figure 3(b)). With FAS loaded cells, CM1 was found to equi-effective with DFO. When the HepG2 cells were pre-incubated with the chelators for 24 hr followed by exposure to FAS or FAC, a decrease in MDA levels was observed under both conditions (Figure 4). The chelators had greater influence on MDA levels in the FAC loaded cells (Figure 4(a)) and DFO was found to be the most potent. Under these conditions both hydroxypyridinones reduced MDA levels to that of the control cells. With FAS loaded cells, the buffering of MDA levels was not so efficient, CM1 being the most effective ligand.
3.3. Dose-Response Chelation of LIP
The LIP content of HepG2 cells pretreated with FAC for 24 hr was decreased in the presence of all three chelators (Table 1). This decrease in LIP levels was monitored by an increase in the FI of the intracellular calcein. DFO was found to cause a large decrease in LIP levels at concentrations up to 35 μM at both 6 and 12 hr. The effect was reduced at DFO levels of 70 μM. There was a similar effect with DFP, again with a reduced effect at the highest concentration investigated. CM1 produced a delayed influence of LIP levels, the influence after 12 hr being much greater than the effect at 6 hr. There was no marked loss of effect at 70 μM with CM1.
A similar influence on LIP levels was observed for in vitro iron-loaded mouse hepatocytes (data not presented), although the greater influence was observed at the 24 hr chelator exposure for all three chelators, there being a clear dose response at this time point (Figure 5). At concentrations £ 20 μM, all three chelators produced a similar influence on LIP values. Above this concentration range, DFP emerged as the most potent ligand for decreasing LIP values. CM1 did not produce a large incremental change in this parameter above 20 μM. With the in vivo iron loaded mouse, all three chelators (6 - 25 μM) were found to decrease LIP levels by similar amounts (Table 2).
4. DISCUSSIONS
The liver is an important organ for iron metabolism and storage. Excess free radicals can cause progressive liver injury and eventually cirrhosis or hepatocellular carcinoma in iron overloaded patients [4]. In an attempt to identity an improved orally active iron chelator for the treatment of such patients, we have identified the lead compound CM1 [18].
In this paper we report the influence of CM1 on the metabolism in iron-related hepatocytes and compare their properties with those of DFP and DFO. CM1 was found to be the least toxic to HepG2 cells (Figure 1(a)). Furthermore, obvious toxicity was expressed by either hydroxypyridinone in iron-loaded hepatocytes, in contrast to DFO which produced a 40% loss in cell population at concentrations exceeding 25 μM (Figure 1(b)). DFO has been previously reported to be toxic to both K562 cells and hepatocytes at concentrations falling in the region of 10 μM [27]. In contrast, hydroxypyridinones, particularly hydrophilic molecules, have been re-
 (a)
(a) (b)
(b)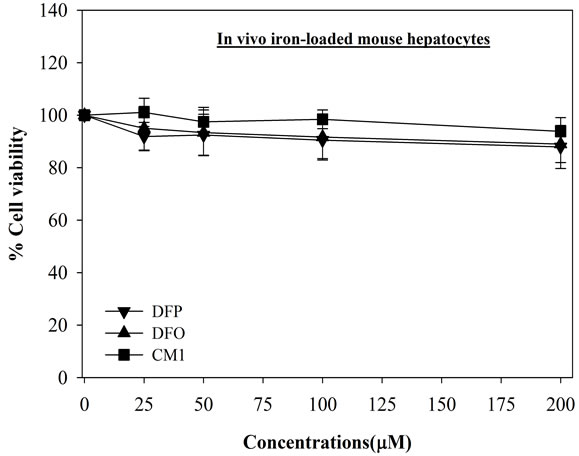 (c)
(c)
Figure 1. Toxicity of FAC and iron chelators on HepG2 cells, mouse hepatocytes and in vivo loaded mouse hepatocytes. Cells were treated with FAC and the iron chelators (0 - 200 µM) for 24 hr, and measured their viability by using MTT assay. n = 3 ± SEM, *p < 0.05 when compared to no treatment.
 (a)
(a)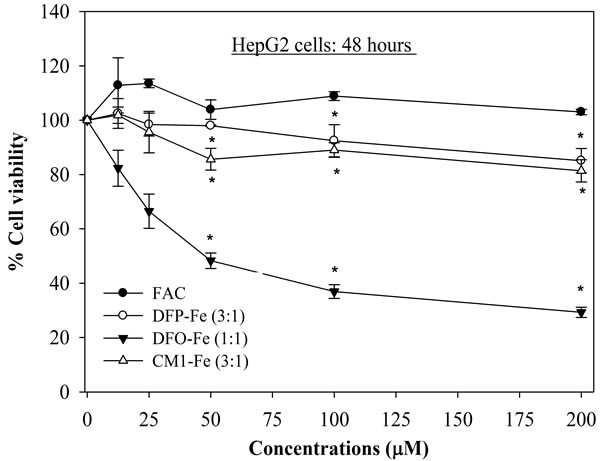 (b)
(b)
Figure 2. Toxicity of FAC and iron-chelator complexes on HepG2 cells for 24 and 48 hr. Cells were treated with the iron-chelator complexes and FAC (0 - 200 µM) for 24 and 48 hr, and measured their viability by using MTT assay. n = 3 ± SEM, *p < 0.05 when compared to no treatment.
 (a)
(a)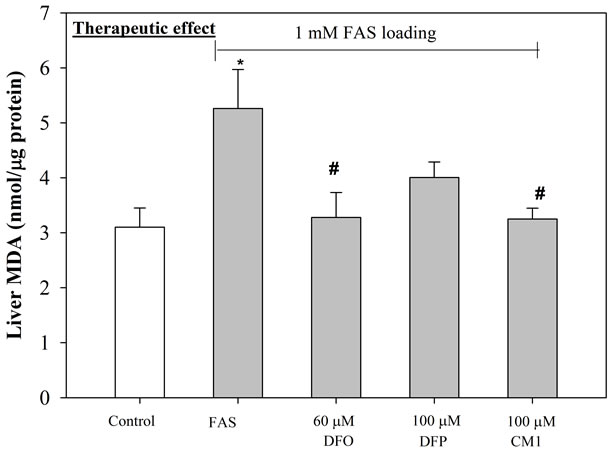 (b)
(b)
Figure 3. Anti-lipid peroxidation (therapeutic) effect of iron chelators on iron-loaded HepG2 cells. Cells were pretreated with FAC (1 mM) (top) and FAS (1 mM) (bottom) for 24 hr, and incubated with DFO (60 µM), DFP (100 µM) and CM1 (100 µM) for further 24 hr. MDA concentrations were measured by using TBARS method. n = 3 ± SEM *p < 0.05 when compared to control; #p < 0.05 when compared to no treatment.
 (a)
(a)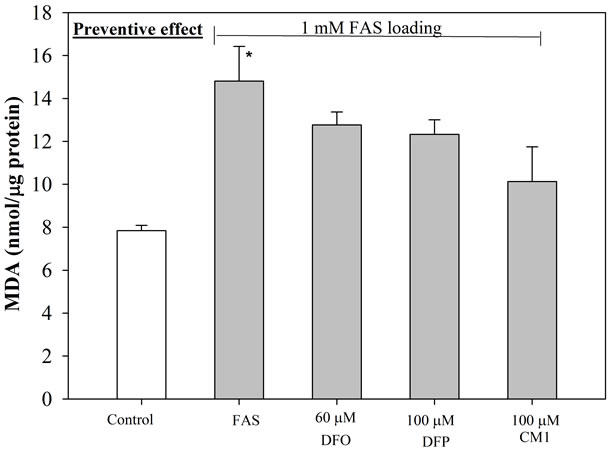 (b)
(b)
Figure 4. Anti-lipid peroxidation (preventive) effect of iron chelators on iron-loaded HepG2 cells. Cells were pretreated with DFO (60 µM), DFP (100 µM) and CM1 (100 µM) for 24 hr, and incubated with FAC (1 mM) (top) and FAS (1 mM) (bottom) for further 24 hr. MDA concentrations were measured by using TBARS method. n = 3 ± SEM, *p < 0.05 when compared to control; #p < 0.05 when compared to no treatment.
ported to be non toxic to hepatocytes up to levels of 100 μM [28].
It is important that the scavenging ligands are not toxic due to redox cycling of their respective iron complexes. For this reason we also investigated the hepatocyte viability in the presence of the iron complexes of DFO, DFP and CM1 (Figure 2). All three iron complexes induced little adverse effect after 24 hr exposure even at the relatively high levels of 200 μM iron (Figure 2(a)). However after 48 hr exposure FO, the iron complex of DFO, caused considerable toxicity to HepG2 cells at concentrations in excess of 25 μM (Figure 2(b)). Remarkably, both hydroxypyridinones displayed little toxicity even after 48 hr exposure at the highest concentration (200 μM).
The cytosolic labile iron pool (LIP) is a source of chelatable and redox-active iron, which is transitory and serves as a crossroad of cell iron metabolism. In principle, LIP if elevated, can promote ROS generation. For this reason LIP levels are negatively regulated by IRPdependent expression of iron import and iron storage proteins [7]. Cellular LIP and ferritin levels are inversely correlated with IRP activity in iron-loaded rat heaptocytes [10]. As the iron load of hepatocytes increases, the proportion of hemosiderin increases [29] and by implication the size of the LIP. Iron uptake from nontransferrin sources can lead to progressive deposition of excess iron in hepatic parenchymal cells and lead

Figure 5. Effect of DFO, DFP, and CM1 treatment on LIP levels in in vitro iron-loaded hepatocytes of twelve mice. The cells were pretreated with FAC (0.5 mM) solution for 24 hr and incubated with iron chelators (0 - 70 µM) for 24 hr. LIP levels expressed as FI was measured by the calcein fluorescence technique. n = 3 ± SEM, #p < 0.05 when compared to no treatment.
to oxidative damage [30-32]. The excess iron deposition is associated with fibrosis and cirrhosis [33]. Oxidative damage in K562 cells is associated with the appearance LIP after treatment with transferrin-bound iron or FAC [34]. Both ferric and ferrous ions have been reported to induce lipid peroxidation in HepG2 cells [22,23]. As cellular LIP levels are associated with ROS production, LIP is a target for iron chelator-mediated cell protection [35]. Iron overload in HepG2 cells can be initiated in the presence of by non transferrin bound iron (NTBI) (e.g. FAC and Fe-NTA), the uptake of iron occurring via transferrin-independent pathways [36]. Thus, hepatocyte cultures are useful for the investigation of the protective and therapeutic effects of iron chelators against iron-induced lipid peroxidation.
In this work we confirm that the hepatocyte LIP is increased by incubation with both FAS and FAC and that this increase can be reversed in the presence of chelators. With in vitro iron-loaded hepatocytes DFO and DFP were found to be more effective than CM1 at decreasing LIP levels (Table 1 and Figure 5). However, with in vivo
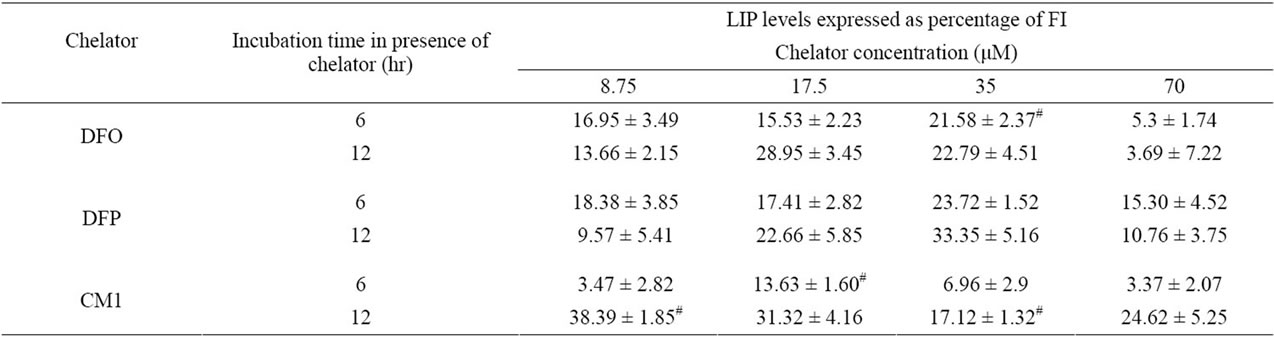
Table 1. Effect of DFO, DFP, and CM1 treatment on LIP levels in in vitro iron-loaded HepG2 cells. Cells were incubated with FAC (0.5 mM) solution for 24 hr and treated with the iron chelators (0 - 70 µM) for 6 and 12 hr. LIP levels expressed as FI were measured by the calcein fluorescence technique. n = 3 ± SEM, #p < 0.05 when compared to no treatment.

Table 2. Effect of DFO, DFP, and CM1 treatment on LIP levels in in vivo iron-loaded mouse hepatocytes. The hepatocytes obtained from the livers of twelve Fe diet-fed mice were treated with the iron chelators (0 - 25 µM) for 6, 12 and 24 hr. LIP levels expressed as percentage of FI were measured by the calcein fluorescence technique. n = 3 ± SEM, #p < 0.05 when compared to no treatment.
iron loaded-hepatocytes there was little difference the effects of three chelators, all these being effective at decreasing LIP levels (Table 2).
The elevated LIP levels associated with the incubation of HepG2 cells in FACand FAS-containing media leads to enhanced MDA levels (Figures 3 and 4). The increase induced by FAS can be completely rectified in the presence of DFO and CM1, DFP being somewhat less effective (Figure 3(b)). In contrast, when HepG2 cells were pre incubated with chelator and then exposed to FAC or FAS loading, the ligands were more effective at neutralizing the MDA levels induced by FAC, all the chelators reducing MDA levels to the control levels, or even lower (Figure 4(a)). With FAS loading, CM1 was found to be the most effective chelating agent (Figure 4(b)).
5. CONCLUSION
As a result of this preliminary investigation it is clear that CM1 is able to penetrate hepatocytes and hence scavenge the LIP. This in turn leads to a reduction in MDA levels. CM1 has a comparable efficacy in this processes with that of DFP, the parent hydroxypyridinone. It is also established that CM1 is relatively non toxic to hepatocytes. In view of these finding CM1 will now be subjected to detailed efficacy studies in various iron-overloaded animal models.
6. ACKNOWLEDGEMENTS
This work was kindly supported by the University Development Commission (UDC) scholarship belonged to College of Medicine and Public Heath, Ubon Ratchathani University; Thailand Research Fund through a Senior Research Scholar Professor Suthat Fucharoen, MD., and Institute of Research and Development, Government Pharmaceutical Organization, Ministry of Public Health.
REFERENCES
- Aisen, P., Enns, C. and Wessling-Resnick, M. (2001) Chemistry and biology of eukaryotic iron metabolism. The International Journal of Biochemistry and Cell Biology, 33, 940-959. doi:10.1016/S1357-2725(01)00063-2
- Hershko, C. (2007) Iron loading and its clinical implications. American Journal of Hematology, 82, 1147-1148. doi:10.1002/ajh.21070
- Emerit, J., Beaumont, C. and Trivin, F. (2001) Iron metabolism, free radicals, and oxidative injury. Biomedecine & Pharmacotherapy, 55, 333-339. doi:10.1016/S0753-3322(01)00068-3
- Jensen, P.D. (2004) Evaluation of iron overload. British Journal of Haematology, 124, 697-711. doi:10.1111/j.1365-2141.2004.04838.x
- Petrat, F., de Groot, H., Sustmann, R. and Rauen, U. (2002) The chelatable iron pool in living cells: A methodically defined quantity. Biological Chemistry, 383, 489-502. doi:10.1515/BC.2002.051
- Staubli, A. and Boelsterli, U.A. (1998) The labile iron pool in hepatocytes: Prooxidant-induced increase in free iron precedes oxidative cell injury. American Journal of Physiology—Gastrointestinal and Liver Physiology, 274, 1031-1037.
- Kakhlon, O. and Cabantchik, Z. I. (2002) The labile iron pool: Characterization, measurement, and participation in cellular processes. Free Radical Biology and Medicine, 33, 1037-1046. doi:10.1016/S0891-5849(02)01006-7
- Gunther, T., Vormann, J. and Hollriegl, V. (1995) Effects of magnesium and iron on lipid peroxidation in cultured hepatocytes. Molecular Cell Biochemistry, 144, 141-145. doi:10.1007/BF00944393
- Prus, E. and Fibach, E. (2009) Effect of iron chelators on labile iron and oxidative status of thalassaemic erythroid cells. Acta Haematologica, 123, 14-20. doi:10.1159/000258958
- Zanninelli, G., Loreal, O., Brissot, P., Konijn, A.M., Slotki, I.N., Hider, R.C. and Ioav Cabantchik, Z. (2002) The labile iron pool of hepatocytes in chronic and acute iron overload and chelator-induced iron deprivation. Journal of Hepatology, 36, 39-46. doi:10.1016/S0168-8278(01)00222-7
- Brittenham, G.M. (2003) Iron chelators and iron toxicity. Alcohol, 30, 151-158. doi:10.1016/S0741-8329(03)00101-0
- Neufeld, E.J. (2006) Oral chelators deferasirox and deferiprone for transfusional iron overload in thalassemia major: New data, new questions. Blood, 107, 3436-3441. doi:10.1182/blood-2006-02-002394
- Porter, J.B. (2006) Deferasirox: An effective once-daily orally active iron chelator. Drugs Today (Barc), 42, 623- 637. doi:10.1358/dot.2006.42.10.1009901
- Hershko, C.M., Link, G.M., Konijn, A.M. and Cabantchik, Z.I. (2005) Iron chelation therapy. Current Hematology Reports, 4, 110-116.
- Kwiatkowski, J.L. (2008) Oral iron chelators. Pediatric Clinics of North America, 55, 461-482. doi:10.1016/j.pcl.2008.01.005
- Cappellini, M.D. and Piga, A. (2008) Current status in iron chelation in hemoglobinopathies. Current Molecular Medicine, 8, 663-674. doi:10.2174/156652408786241438
- Porter, J.B. (1997) A risk-benefit assessment of ironchelation therapy. Drug Safety, 17, 407-421. doi:10.2165/00002018-199717060-00006
- Srichairatanakool, S., Pangjit, K. and Phisalaphong, C. (2009) Characterization and investigation of chelating activity of a novel iron chelator: 1-(N-acetyl-6-aminohexyl) -3-hydroxypyridin-4-one. Thailand Patent No. 0901000799.
- Chenoufi, N., Drenou, B., Loreal, O., Pigeon, C., Brissot, P. and Lescoat, G. (1998) Antiproliferative effect of deferiprone on the HepG2 cell line. Biochemical Pharmacology, 56, 431-437. doi:10.1016/S0006-2952(98)00071-9
- Baker, E., Baker, S.M. and Morgan, E.H. (1998) Characterisation of non-transferrin-bound iron (ferric citrate) uptake by rat hepatocytes in culture. Biochimica et Biophysica Acta, 1380, 21-30. doi:10.1016/S0304-4165(97)00120-7
- Mosmann, T. (1983) Rapid colorimetric assay for cellular growth and survival: Application to proliferation and cytotoxicity assays. Journal of Immunological Methods, 65, 55-63. doi:10.1016/0022-1759(83)90303-4
- Jagetia, G.C., Reddy, T.K., Venkatesha, V.A. and Kedlaya, R. (2004) Influence of naringin on ferric iron induced oxidative damage in vitro. Clinica Chimica Acta, 347, 189-197. doi:10.1016/j.cccn.2004.04.022
- Huang, X., Dai, J., Fournier, J., Ali, A.M., Zhang, Q. and Frenkel, K. (2002) Ferrous ion autoxidation and its chelation in iron-loaded human liver HepG2 cells. Free Radical Biology and Medicine, 32, 84-92. doi:10.1016/S0891-5849(01)00770-5
- Tenopoulou, M., Kurz, T., Doulias, P.-T., Galaris D. and Brunk, U.T. (2007) Does the calcein-AM method assay the total cellular “labile iron pool” or only a fraction of it? Biochem Journal, 15, 261-266.
- Heyduk, T., Ma, Y., Tang, H. and Ebright, R.H. (1996) Fluorescence anisotropy: Rapid, quantitative assay for protein-DNA and protein-protein interaction. Methods in Enzymology, 274, 492-503. doi:10.1016/S0076-6879(96)74039-9
- Sturm, B., Goldenberg, H. and Scheiber-Mojdehkar, B. (2003) Transient increase of the labile iron pool in HepG2 cells by intravenous iron preparations. European Journal of Biochemistry, 270, 3731-3738.
- Glickstein, H., Breuer, W., Loyevsky, M., Konijn, A.M., Shanzer, A. and Cabantchik, Z.I. (1996) Differential cytotoxicity of iron chelators on malaria-infected cells versus mammalian cells. Blood, 87, 4871-4878.
- Porter, J.B., Gyparaki, M., Burke, L.C., Huehns, E.R., Sarpong, P., Saez, V. and Hider, R.C. (1988) Iron mobilization from hepatocyte monolayer cultures by chelators: the importance of membrane permeability and the ironbinding constant. Blood, 72, 1497-1503.
- Selden, C., Owen, M., Hopkins, J.M. and Peters, T.J. (1980) Studies on the concentration and intracellular localization of iron proteins in liver biopsy specimens from patients with iron overload with special reference to their role in lysosomal disruption. British Journal of Haematology, 44, 593-603. doi:10.1111/j.1365-2141.1980.tb08714.x
- Wright, T.L., Brissot, P., Ma, W.L. and Weisiger, R.A. (1986) Characterization of non-transferrin-bound iron clearance by rat liver. Journal of Biological Chemistry 261, 10909-10914.
- Brissot, P., Wright, T.L., Ma, W.L. and Weisiger, R.A. (1985) Efficient clearance of non-transferrin-bound iron by rat liver. Implications for hepatic iron loading in iron overload states. Journal of Clinical Investigation, 76, 1463-1470. doi:10.1172/JCI112125
- Halliwell, B. and Gutteridge, J.M. (1986) Oxygen free radicals and iron in relation to biology and medicine: Some problems and concepts. Archives of Biochemistry and Biophysics, 246, 501-514. doi:10.1016/0003-9861(86)90305-X
- Turlin, B. and Deugnier, Y. (2002) Iron overload disorders. Clinical Liver Disease, 6, 481-496. doi:10.1016/S1089-3261(02)00004-1
- Breuer, W., Epsztejn, S. and Cabantchik, Z.I. (1996) Dynamics of the cytosolic chelatable iron pool of K562 cells. FEBS Letters, 382, 304-308. doi:10.1016/0014-5793(96)00190-1
- Kakhlon, O., Gruenbaum, Y. and Cabantchik, Z.I. (2001) Repression of ferritin expression increases the labile iron pool, oxidative stress, and short-term growth of human erythroleukemia cells. Blood, 97, 2863-2871. doi:10.1182/blood.V97.9.2863
- Parkes, J.G., Randell, E.W., Olivieri, N.F. and Templeton, D.M. (1995) Modulation by iron loading and chelation of the uptake of non-transferrin-bound iron by human liver cells. Biochimica et Biophysica Acta, 1243, 373-380. doi:10.1016/0304-4165(94)00162-Q
ABBREVIATIONS
Calcein-AM = 3’,6’-Di(O-acetyl)-2’,7’-bis[N,N-bis(carboxymethyl)aminomethyl] fluorescein tetraacetoxy methyl ester, DFO = desferrioxamine, DFP = deferiprone, DFX = deferasirox, DMEM = dulbecco’s modified eagle medium, FAC = ferric ammonium citrate, FAS = ferrous ammonium sulfate, FBS = fetal bovine serum, FI = fluorescence intensity, FO = ferroxamine, HPO = 3-hydroxypyridin-4-one, LIP = labile iron pool, MDA = malondialdehyde, MTT = 3-(4,5-dimethylthiazol-2-yl)-2,5-diphenyltetrazolium bromide, NTBI = non transferrin bound iron, ROS = reactive oxygen species, TBA = thiobarbituric acid, TBARS = thiobarbituric acid reactive substances.
NOTES
*Corresponding author.