Journal of Environmental Protection
Vol. 3 No. 9A (2012) , Article ID: 22981 , 13 pages DOI:10.4236/jep.2012.329141
Residue Placement and Rate, Crop Species, and Nitrogen Fertilization Effects on Soil Greenhouse Gas Emissions*
![]()
1College of Urban and Environmental Sciences, Northwest University, Xi’an, China; 2USDA-ARS, Northern Plains Agricultural Research Laboratory, Sidney, USA.
Email: #upendra.sainju@ars.usda.gov
Received June 12th, 2012; revised July 10th, 2012; accepted August 9th, 2012
Keywords: Greenhouse gases; Residue management; Nitrogen fertilization; Crop species; spatial variability
ABSTRACT
High variability due to soil heterogeneity and climatic conditions challenge measurement of greenhouse gas (GHG) emissions as influenced by management practices in the field. To reduce this variability, we examined the effect of management practices on CO2, N2O, and CH4 fluxes and soil temperature and water content from July to November, 2011 in a greenhouse. Treatments were incomplete combinations of residue placements (no residue, surface placement, and incorporation into the soil) and rates (0%, 0.25%, and 0.50%), crop species (spring wheat [Triticum aestivum L.], pea [Pisum sativum L.], and fallow), and N fertilization rates (0.11 and 0.96 g∙N∙pot−1). Soil temperature was not influenced by treatments but water content was greater under fallow with surface residue than in other treatments. The GHG fluxes peaked immediately following water application and/or N fertilization, with coefficient of variation (CV) ranging from 21% to 46%, <50% of that reported in the field. Average CO2 and N2O fluxes across measurement dates were greater under wheat or fallow with surface residue and 0.96 g∙N∙pot−1 than in other treatments. Average CH4 uptake was greater under fallow with surface or incorporated residue and 0.11 g∙N∙pot−1 than in other treatments. Doubling the residue rate increased CO2 flux by 9%. Greater root respiration, N substrate availability, and soil water content increased CO2 and N2O emissions under wheat or fallow with surface residue and high N rate but fallow with low N rate increased CH4 uptake. Controlled soil and environmental conditions substantially reduced variations in GHG fluxes.
1. Introduction
Agricultural practices contribute significant emissions of three GHGs (CO2, N2O, and CH4) [1] responsible for radiative forcing of earth’s atmosphere [2]. Soil and crop management practices, such as residue placement in the soil due to tillage, crop species, and N fertilization, can influence soil surface GHG emissions [3-5]. Incorporation of crop residue to a greater depth due to tillage increases CO2 and N2O emissions by increasing microbial activity and residue mineralization [6,7]. In contrast, placing residue at the surface and reducing soil disturbance due to no-tillage can reduce CO2 and N2O emissions [3-5]. Cropping can increase CO2 emissions compared to fallow by increasing root respiration and the amount of crop residue returned to the soil [6,7]. Similarly, crop species can influence CO2 and N2O emissions due to differences in the quality and quantity of crop residue returned to the soil [3-5]. In contrast, fallow can increase N2O emissions compared to cropping due to enhanced soil organic N mineralization and NO3-N content from increased microbial activity as a result of higher soil temperature and water content [4]. Nitrogen fertilization can promote N2O emissions [4,8], but has variable effect on CO2 and CH4 emissions [9,10].
Management practices can also indirectly influence GHG emissions by altering soil temperature and water content, as these parameters are related with gas fluxes [11]. Residue incorporation due to tillage can enhance soil water loss while residue accumulation at the soil surface due to no-tillage can conserve soil water and reduce temperature [6,12]. Similarly, cropping system, crop type, and N fertilization can influence soil temperature and water content compared to fallow and non-N fertilization by affecting the shade intensity and evapotranspiration due to variability in biomass production and amount of residue returned to the soil [6,13].
High temporal and spatial variability in the measurement of GHG fluxes at the field scale often mask differences among treatments [14,15]. Variability exists not only due to diurnal and seasonal changes in soil temperature and water content but also to perturbations (e.g. tillage, fertilization, precipitation events, and thawing) [16]. It is not unusual to observe high spatial variability often exceeding 100% in the measurement of GHG fluxes in the field due to soil heterogeneity and differences in chamber size and methods of measurement [14,17]. Installing multiple chambers per plot in uniform landscape positions, soil type, and vegetation usually reduce spatial variability [14,16]. Similarly, temporal variability and measurement errors can be reduced by measuring gas fluxes at the same time of the day (e.g. mid-morning, early evening) at regular intervals and immediately following substantial precipitation and irrigation events and N fertilization [16].
Because of the high variability in the measurement of GHG fluxes in the field, differences among treatments may be better measured by reducing variability under controlled soil and environmental conditions in the greenhouse. We hypothesized that residue incorporated into the soil under spring wheat fertilized with 0.96 g∙N∙pot−1 would increase GHG fluxes compared to other treatments and greater residue rate would further increase the fluxes under controlled soil and environmental conditions. Our objective was to evaluate the effects of residue placement and rate, crop species, and N fertilization rate on soil temperature and water content and CO2, N2O, and CH4 fluxes from July to November, 2011 and relate these parameters in a loam soil in the greenhouse.
2. Materials and Methods
2.1. Experimental Description
Greenhouse gas fluxes were measured in a vented, static chamber installed in a pot under controlled soil and environmental conditions in the greenhouse. Soil samples were collected manually from an area of 5 m2 using a shovel to a depth of 15 cm under a mixture of crested wheatgrass [Agropyron cristatum (L.) Gaertn] and western wheatgrass [Pascopyrum smithii (Rydb.) A. Love] from a dryland farm site, 8 km east of Sidney, Montana, USA. The soil is a Williams loam (fine-loamy, mixed, frigid, Typic Argiborolls [International classification: Luvisols]) with 350 g∙kg−1 sand, 325 g∙kg−1 silt, 325 g∙kg−1 clay, 1.42 Mg∙m−3 bulk density, 7.2 pH, and 11.3 g∙kg−1 organic C concentration at the 0 - 15 cm depth. Soil was air-dried and sieved to 4.75 mm after discarding coarse organic materials and rock fragments. Eight kilograms of soil was placed in a plastic pot, 25 cm high by 25 cm diameter, above 3 cm of gravel at the bottom to improve drainage.
Treatments consisted of twelve incomplete combinations of three residue placements (no residue, surface placement, and incorporation into the soil), three residue rates (0%, 0.25%, and 0.50%), three crop species (spring wheat, pea, and fallow), and two N fertilization rates (0.11 and 0.96 g∙N∙pot−1) (T1 to T12) (Table 1). For example, treatment T1 refers to no residue (at 0% residue rate) under fallow with 0 g∙N∙pot−1 (control), T2 refers to surface residue placement at 0.25% rate under spring wheat with 0.11 g∙N∙pot−1, and so on (Table 1). In order to match the residue and crop species, spring wheat residue was placed under spring wheat and fallow and pea residue under pea. The surface placement of residue corresponded somewhat to the no-till system and incorporated residue to the conventional till system. Treatment T1 was the control treatment without any residue, plant, and fertilization. The 0.25% residue rate was the normal amount of residue found under dryland spring wheat and pea at the experimental site. The 0.96 g∙N∙pot−1 (applied as urea) was similar to the recommended N fertilization rate (80 kg∙N∙ha−1) to spring wheat in the field while 0.11 g∙N∙pot−1 (or 9 kg∙N∙ha-1) was applied from monoammonium phosphate which was the only P fertilizer available in the area. The monoammonium phosphate also supplied P at 0.25 g∙P∙pot−1 (or 27 kg∙P∙ha−1) and muriate of potash supplied K at 0.50 g∙K∙pot−1 (or 29 kg∙K∙ha−1) to all treatments, except in T1.
Nine-week old spring wheat and pea plants were collected from the field, grains removed, and biomass containing stems and leaves were chopped to 2 cm and oven-dried at 60˚C for 3 d. Crop residues were either placed at the soil surface or incorporated into the soil by mixing the residue by hand. Half of 0.96 g∙N∙pot−1 was applied at planting and other half at four weeks later. To eliminate the variability due to N fertilization, fallow treatments, except T1, were also applied with 0.11 g∙N∙pot−1. Treatments were arranged in a completely randomized design with three replications.
In July 2011, five spring wheat and pea seeds were planted per pot, except in the fallow treatment. At a height of 3 cm, seedlings were thinned to two per pot. Water was applied in all treatments to field capacity (0.25 m3∙m−3 [18]) at 300 to 500 mL∙pot−1 at planting and at 3 to 7 d intervals thereafter, depending on soil water content (as determined by soil water probe installed to a depth of 15 cm). Since the amount of water applied depended on soil water content, no substantial leaching occurred. At 105 d after planting, aboveand belowground crop biomass were harvested from the pot, washed with water, oven-dried at 60˚C for 3 to 7 d, and dry matter yield was determined. Soil samples were air-dried, ground, sieved to 2 mm, and analyzed for C and N concentrations. Air temperature in the greenhouse varied from 24˚C to 26˚C in the day and 15˚C in the night.
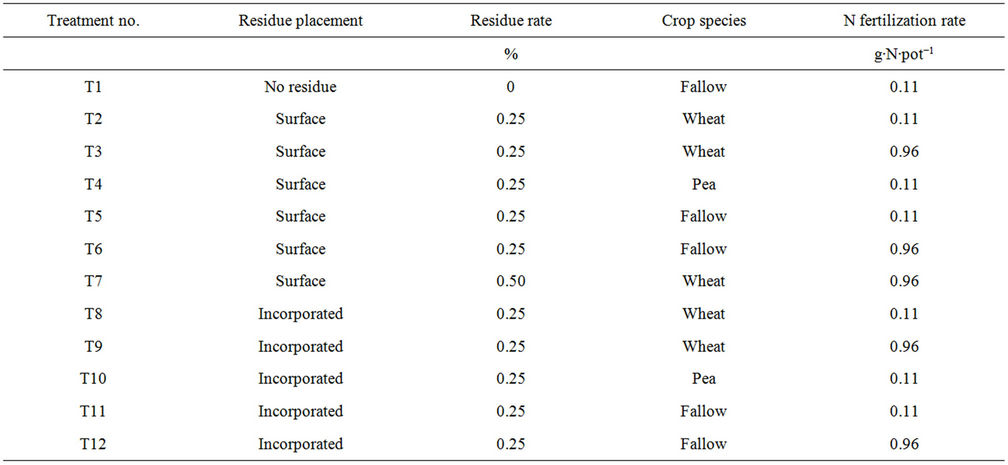
Table 1. Description of treatments used in the experiment. Treatments (T1 to T12) contained incomplete combinations of three residue placement (no residue, surface placement, and incorporated into soil), three residue rates (0%, 0.25% and 0.50%), three crop species (fallow, pea, and spring wheat) and two N rates (0.11 to 0.96 g∙N∙pot−1).
2.2. Greenhouse Gas Measurements
Surface soil CO2, N2O, and CH4 fluxes were measured two to three times a week (intensive measurements for the first month and less intensive thereafter) immediately after planting, from July to November, 2011 using a static, vented chamber [19]. The chamber contained an anchor and a cover as two-piece system which were made of polyvinyl chloride (20 cm inside diameter). The anchor (15 cm tall) was inserted into the leveled soil surface to a depth of 7.5 cm by hand in each pot. A carpenter’s level was used at the top to level the anchor in the north-south and east-west directions. The cover (10 cm tall), with ports for ventilation and gas sampling, was placed at the top of anchor during sampling. A rubber sheet attached to the cover was lowered to seal the anchor so that no exchange of gas takes place between the inside and the outside of the chamber during sampling. Total headspace volume of the chamber for the gas was determined by adding the inside volumes of the anchor above the soil surface and the cover. Gas samples were collected 24 hr after installation of the anchor to stabilize the chamber in the pot. Gas samples were collected at 0, 20, and 40 min by injecting a needle attached to a 20 mL syringe in the sampling port and transferring them in 12-mL evacuated glass vials sealed with butyl rubber septa (Labco Ltd., High Wycombe, UK). Plant parts that grew above the height and circumference of the chamber were gently squeezed inside without causing physical damage during gas sampling while allowing to growing freely at other times. Concentrations of CO2N2O, and CH4 in gas samples inside the vials were determined with a gas chromatograph (Model 3800, Varian, Palo Alto, CA) in the laboratory. The gas chromatograph was fully automated with thermoconductivity, electron capture detectors, and flame ionization for analysis of CO2, N2O, and CH4 concentrations, respectively, in one gas sample. Gas flux was calculated as changes in either linear or curvilinear concentration gradient over time [19, 20]. At the time of gas sampling, at the 0 - 15 cm depth, soil temperature was measured with a temperature probe and water content with a Time-domain Reflectometry (Spectrum Technologies Inc., Elysburg, PA).
2.3. Data Analysis
Data for GHG fluxes and soil temperature and water content were analyzed by using the Analysis of Repeated Measures in the SAS-MIXED model [21]. Treatment was considered as the fixed effect, days after planting (DAP) as the repeated measure variable, and replication as the random effect. Because the experiment contained incomplete combinations of treatments, data containing similar levels of treatments were analyzed separately to evaluate the interactive effects of the parameters on response variables. For example, for evaluating the interactive effects of residue placement (surface placement vs. incorporation), crop species (spring wheat and fallow), and N fertilization (0.11 and 0.96 g∙N∙pot−1) at 0.25% residue rate, data for treatment numbers T2, T3, T5, T6, T8, T9, T11, and T12 were analyzed separately (Table 1). Similarly, for evaluating the interactive effect of residue placement (surface placement vs. incorporation) and crop species (spring wheat, pea, and fallow) at 0.25% residue rate and 0.11 g∙N∙pot−1, data for treatment numbers T2, T4, T5, T8, T10, and T11 were analyzed separately. Means were separated by using the least square means test when treatments and interactions were significant [21]. When treatments were significant, orthogonal contrasts were used to determine the effects of residue presence (T5 + T11 vs. T1) and rate (T7 vs. T3) on GHG fluxes and soil parameters. Statistical significance was evaluated at P ≤ 0.05, unless otherwise stated.
3. Results and Discussion
3.1. Soil Temperature and Water Content
Soil temperature varied significantly among DAPs and water content among treatments and DAPs (Tables 2 and 3). At 0.25% residue rate, water content was influenced by residue placement, crop species, and N rate (Table 3). Interactions were significant for residue placement × crop species, crop species × N rate, residue placement × crop species × N rate, residue placement × DAP, crop species × DAP, and residue placement × crop species × DAP for soil water content.
Soil temperature varied from 16˚C at 80 DAP to 38˚C at 6 DAP, with a gradual decline from the beginning to the end of the measurement period (Figure 1). Soil temperature varied more than greenhouse temperature, regardless of treatments, probably a result of water application. It could be possible that water applied to maintain field capacity in all treatments reduced soil temperature. As water evaporated and soil dried, temperature increased.
Soil water content increased immediately following water application to treatments (Figure 1). Water content was greater under fallow than under spring wheat and pea from 30 to 80 DAP. Water content was also greater under pea than under spring wheat from 60 to 105 DAP. Similarly, water content was greater in the surface than in the incorporated residue from 0 to 60 DAP. Average across DAPs, water content was greater in the surface
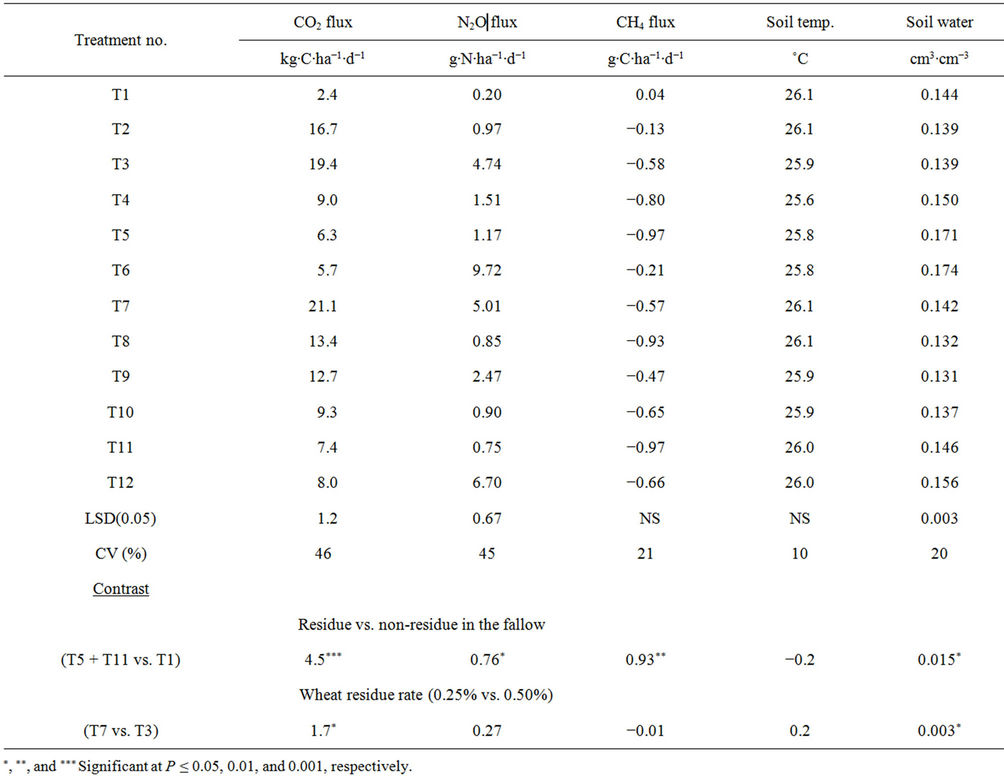
Table 2. Effects of residue placement and rate, crop species, and N fertilization on soil temperature, water content, and greenhouse gas fluxes averaged across days after planting. Treatments (T1 to T12) are described in Table 1.
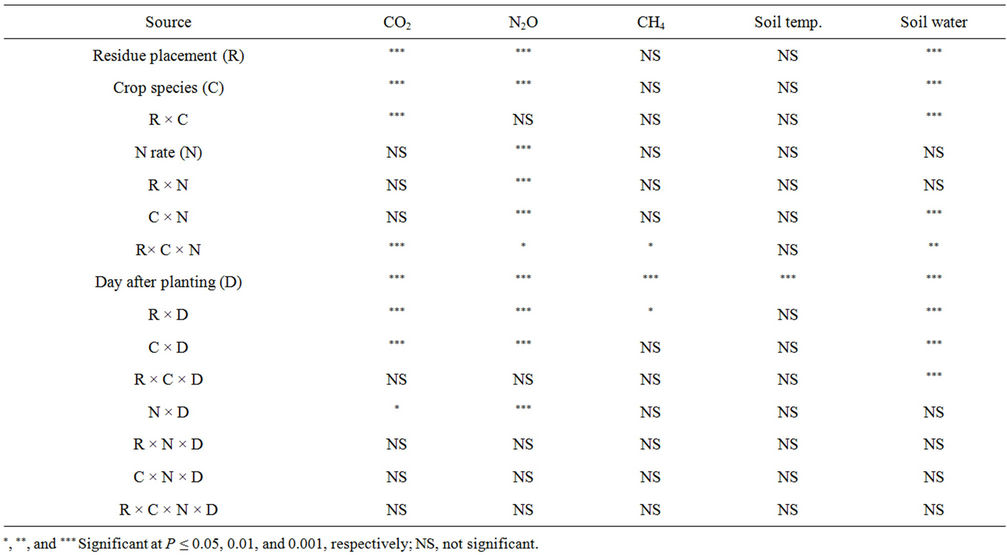
Table 3. Analysis of variance for soil temperature, water content, and greenhouse gas fluxes (pea not included in the crop species for data analysis) at 0.25% residue rate.
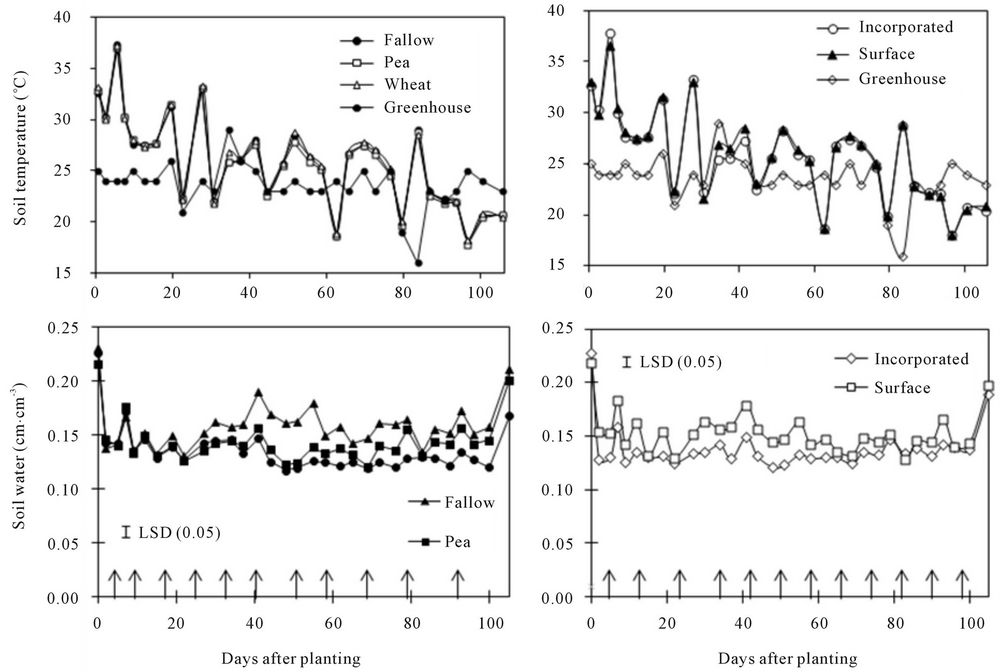
Figure 1. Effects of crop species and residue placement on soil temperature and water content at various days after planting. Arrows show days of water application in the treatments.
residue at 0.25% rate under pea and fallow with 0.11 and 0.96 g∙N∙pot−1 (T5 and T6) than in other treatments (Tables 2, 4 and 5). Averaged across crop species, N rates, and DAPs, water content was greater in the surface than in the incorporated residue. Averaged across residue placements, N rates, and DAPs, water content was greater under fallow and pea than under spring wheat. Water content increased with residue presence than without or with increasing residue rate (Table 2).
The higher soil water content in the surface residue under fallow than in other treatments was probably a result of absence of plants, followed by water conservation by the surface residue which acted as a mulch. Water conservation during the fallow period and by the surface residue in the no-till system has been well known [22]. As the rate of residue increased, water content also increased. Similarly, greater water content under pea than under spring wheat was probably a result of lower water use by pea [23,24]. While the surface residue increased water content compared to the incorporated residue from 0 to 60 DAP, greater water content under fallow appeared only after 30 DAP. This is probably because surface residue conserved more water at the beginning due to lower water uptake by crops. As crops grew, greater water uptake by crops probably reduced soil water content under spring wheat and pea than under fallow. Changes in soil temperature and water content are expected to affect GHG emissions, as described below.
3.2. Greenhouse Gas Fluxes
3.2.1. Carbon Dioxide
Soil CO2 flux varied significantly with residue placement at 0.25% rate when pea was not included in crop species for data analysis (Tables 3 and 4) but was not affected by residue placement at 0.25 % rate and 0.11 g∙N∙pot−1 when pea was included (Table 5). With or without pea inclusion, CO2 flux varied with crop species and DAP, with significant interactions for residue placement × crop species, residue placement × DAP, and crop species × DAP (Tables 3 and 5). Without pea inclusion, N rate × DAP and residue placement × crop species × N rate in-
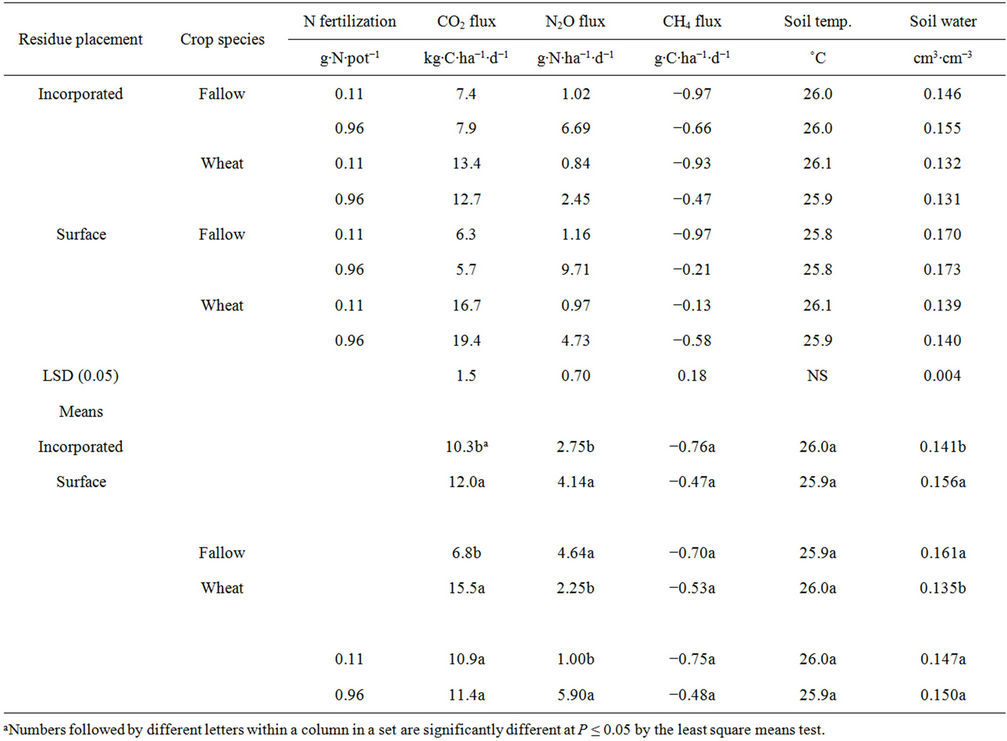
Table 4. Effects of residue placement, crop species (pea not included for data analysis), and nitrogen fertilization rate on soil temperature, water content, and greenhouse gas fluxes averaged across days after planting at 0.25% residue rate.
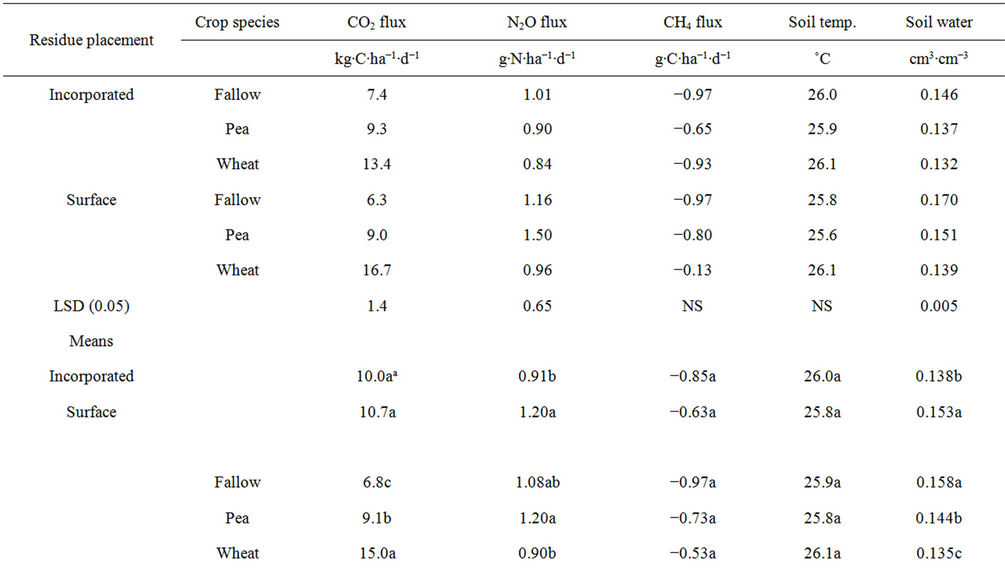
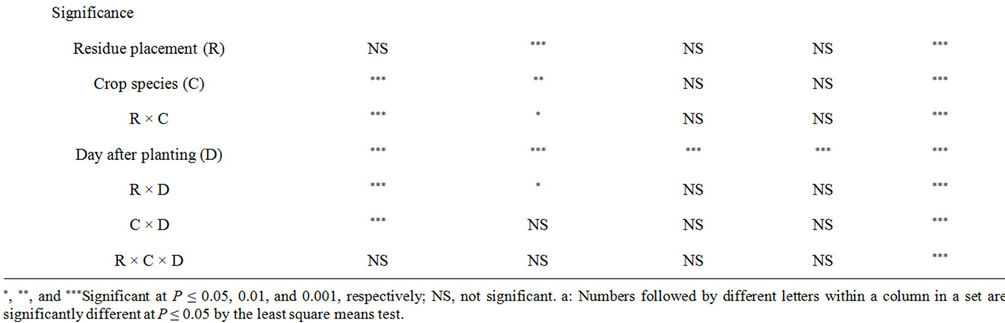
Table 5. Effects of residue placement and crop species (pea included for data analysis) on soil temperature, water content, and greenhouse gas fluxes averaged across days after planting at 0.11 g∙N∙pot−1 and 0.25% residue rate.
teractions on CO2 flux were also significant (Table 3).
Carbon dioxide flux peaked immediately after water application, especially under spring wheat and pea (Fig. 2). The flux varied from 2 kg∙C∙ha−1∙d−1 in 90 DAP under fallow to as much as 42 kg∙C∙ha−1∙d−1 in 38 DAP under 0.50% residue (Figures 2 and 3). The high value of CO2 flux in this experiment was lower than field-measured peak values of 80 to 160 kg∙C∙ha−1∙d−1 under spring wheat in western Canada [6] and 57 kg∙C∙ha−1∙d−1 under malt barley in eastern Montana [10], both measured by the dynamic chamber method, but greater than 16 kg∙C∙ha−1∙d−1 under fallow in North Dakota measured by the static chamber method [20]. Differences in soil and environmental conditions and management practices among locations and measurement methods can influence CO2 emissions [17]. Although CO2 flux varied with DAP, CV of 46% obtained in this experiment (Table 2) was almost half of 100% often reported in the field [11, 15,17].
Carbon dioxide flux was greater under spring wheat than under fallow from 35 to 105 DAP and greater under pea than under fallow from 30 to 65 DAP (Figure 2). Similarly, CO2 flux was greater in the surface than in the incorporated residue in all DAPs, except at 10 to 30 DAP when pea was not included in the crop species and at 10 to 30 and 60 to 105 DAP when pea was included. Increased N rate increased CO2 flux at the beginning of the experiment but increased spring wheat residue rate increased the flux at 10 to 40 DAP (Figure 3). Averaged across DAPs, CO2 flux was greater in the surface residue
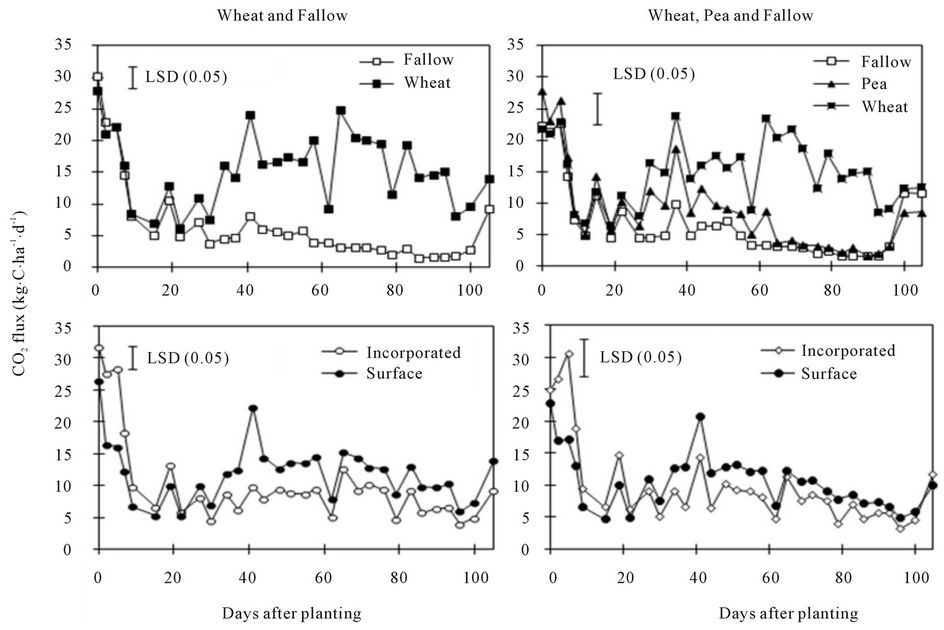
Figure 2. Effects of crop species (with and without pea inclusion for data analysis) and residue placement on soil CO2 flux at various days after planting.
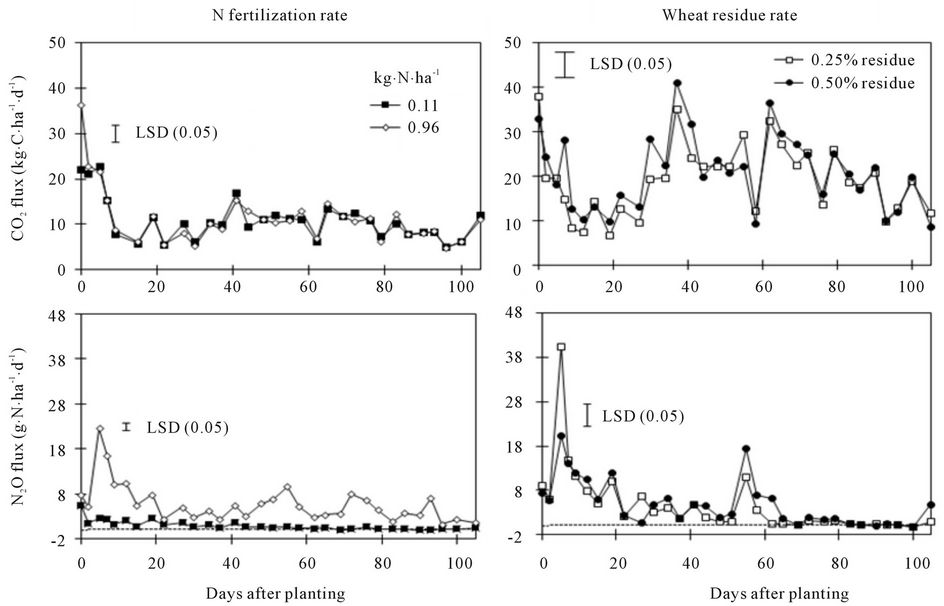
Figure 3. Effects of N fertilization and spring wheat residue rates on soil CO2 and N2O fluxes at various days after planting.
(0.50% rate) under spring wheat with 0.96 g∙N∙pot−1 (T7) (Table 2) and in the surface residue (0.25% rate) under spring wheat with and 0.11 and 0.96 g∙N∙pot−1 than in other treatments (Tables 4 and 5). Averaged across crop species, N rates, and DAPs, CO2 flux was greater in the surface than in the incorporated residue when pea was not included but not different between residue placements when pea was included. Averaged across residue placements, N rates, and DAPs, CO2 flux was greater under spring wheat than under pea and fallow and greater under pea than under fallow. Residue presence in the fallow and higher residue rate increased CO2 flux compared to no residue presence and lower residue rate, respectively (Table 2).
The greater CO2 flux under spring wheat and pea than under fallow from 30 to 105 DAP was probably due to greater root respiration during active crop growth, since root respiration accounts for 30% to 50% of the total CO2 flux [6,25]. Average CO2 flux across DAPs under spring wheat and pea (12.1 kg∙C∙ha−1∙d−1) was twice as much greater than under fallow (6.8 kg∙C∙ha−1∙d−1) (Table 5), resulting in CO2 flux due to root respiration of 44%, a fact corroborated by several studies [6,25]. Similarly, greater CO2 flux under spring wheat than under pea was probably due to greater root respiration as a result of higher root biomass (data not shown). Absence of plants probably reduced CO2 flux under fallow. Greater CO2 flux in the surface than in the incorporated residue was probably related to soil water content. It could be possible that greater water content (Tables 4 and 5) increased soil microbial activity and therefore CO2 flux in the surface than in the incorporated residue. This was in contrast to till (incorporated residue) and no-till (surface residue) systems observed in the field where no-till system has reduced CO2 flux compared to till system [6, 7,10]. Our greenhouse experiment, however, does not exactly correspond to till and no-till systems, since soil was disturbed when samples were collected from the field.
Greater substrate availability probably increased soil microbial activity, thereby increasing CO2 flux in the residue presence compared to no residue in the fallow or in 0.50% vs. 0.25% residue rate (Table 2). Such increases were, however, limited from 10 to 40 DAP (Figure 3), likely a result of rapid mineralization of fresh residue during this period. Although higher N rate increased CO2 flux at the beginning of the experiment,
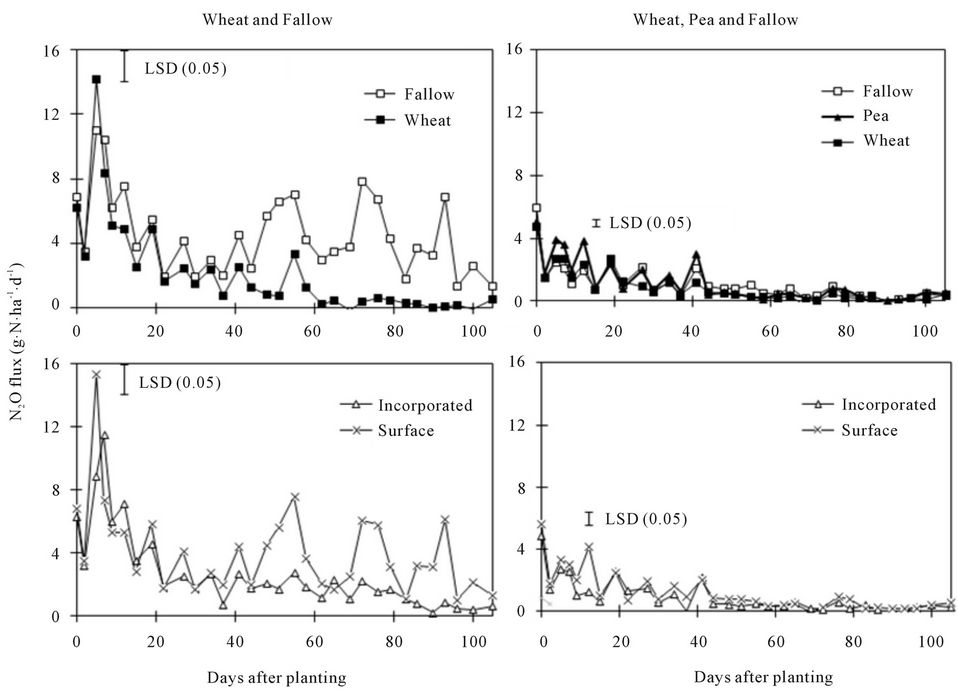
Figure 4. Effects of crop species (with and without pea inclusion for data analysis) and residue placement on soil N2O flux at various days after planting.
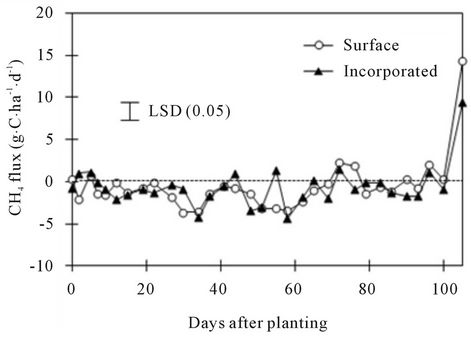
Figure 5. Effect of residue placement on soil CH4 flux at various days after planting.
overall flux was not different between N rates.
3.2.2. Nitrous Oxide
Soil N2O flux varied among residue placements, crop species, N rates, and DAPs, regardless of pea inclusion in crop species for data analysis (Tables 3 and 5). Interactions were significant for residue placement × N rate, crop species × N rate, residue placement × crop species × N rate, residue placement × DAP, crop species × DAP and N rate × DAP at 0.25% residue rate when pea was not included in crop species (Table 3). When pea was included, interactions were significant for residue placement × crop species, residue placement × DAP, and crop species × DAP at 0.11 g∙N∙pot−1 and 0.25% residue rate (Table 5).
Nitrous oxide flux varied from 0.2 g∙N∙ha−1∙d−1 under spring wheat in 55 DAP to 40.0 g∙N∙ha−1∙d−1 under 0.25% residue at 5 DAP (Figures 3 and 4). These fluxes were within or greater than field-reported values of -8 to 21 g∙N∙ha−1∙d−1 under spring wheat-pea rotation and fallow in western Montana and central North Dakota [20, 26]. The flux peaked immediately following water application in all treatments and DAPs, except for spring wheat residue rates and crop species without pea inclusion where the flux was minimal after 60 DAP. As with CO2 flux, CV for N2O flux was 45% among treatments (Table 2), indicating lower temporal variability under controlled soil and environmental conditions in the greenhouse compared to 100% often reported in the field [11,14,15].
Nitrous oxide flux was greater under fallow than under spring wheat from 50 to 90 DAP when pea was not included in the crop species but was greater under pea than under spring wheat and fallow at 5 to 15 and 40 DAP when pea was included (Figure 4). Similarly, N2O flux was greater in the surface than in the incorporated residue at 5 and 45 to 90 DAP with pea inclusion and at 10 DAP without pea. The 0.96 g∙N∙pot−1 increased N2O flux compared to 0.11 g∙N∙pot−1 at almost all DAPs (Figure 3). The N2O flux was greater in 0.25% than in 0.50% residue rate at 5 DAP but was greater in 0.50% than in 0.25% rate at 55 to 65 DAP. Averaged across DAPs, N2O flux was greater under fallow with surface residue at 0.25% rate and 0.96 g∙N∙pot−1 (T6) than in other treatments (Tables 2, 4, and 5). Averaged across crop species, N rates, and DAPs, N2O flux was greater in the surface than in the incorporated residue (Tables 4 and 5). Averaged across residue placements, N rates, and DAPs, N2O flux was greater under fallow than under spring wheat when pea was not included in the crop species but was greater under pea than under spring wheat when pea was included. Averaged across residue placements, crop species, and DAPs, N2O flux was greater with 0.96 than with 0.11 g∙N∙pot−1. Residue presence also increased N2O flux compared to no residue in the fallow but residue rate has no influence on the flux (Table 2).
Increased N mineralization due to higher soil water content probably resulted in greater N2O flux under fallow than under spring wheat at 45 to 90 DAP when pea was not included in crop species for data analysis (Figure 4). Soil water content was higher under fallow than under pea and spring wheat during the same period (Figure 1). It has been known that high soil water content during the fallow period increases microbial activity and N mineralization [27,28]. This is similar to that reported by several researchers [4,29] who found greater N2O flux under fallow than under crops. Excessive soil water content also increases N2O flux due to denitrification [20,26]. When pea was included, greater N2O flux under pea than under spring wheat and fallow at 5 to 40 DAP was probably due to increased N mineralization from pea residue as a result of its higher N concentration. Residues of legumes, such as pea, have been known to produce greater N2O emissions due to their higher N concentration or lower C/N ratio than nonlegumes, such as spring wheat [5,26]. Nitrous oxide fluxes were lower with pea inclusion in crop species than without because data were averaged at low N rate when pea was included but averaged across high and low N rates when pea was not included. This is because increased N fertilization rate increases N2O flux probably due to enhanced N substrate availability and nitrification [5,26], which was also true in this experiment, as N2O flux was greater with 0.96 than with 0.11 g∙N∙pot−1 (Figure 3, Table 4).
The greater N2O flux in the surface than in the incorporated residue was also likely a result of greater soil water content (Figures 1 and 4). Average soil water content was 10% to 11% greater in the surface than in incorporated residue. It could be possible that higher soil water content in the surface residue increased N2O flux due to increased N mineralization and/or denitrification, a case similar to that observed for the fallow condition [20,26]. Residue accumulation at the soil surface in the no-till system can increase N2O flux due to higher soil water content compared to conventional till in the humid regions [2] but the process can be reversed in arid and semiarid regions [3,4,26]. As with CO2 flux, the combination of fallow, surface residue, and high N rate further increased N2O flux compared to individual treatments (Tables 2, 4, and 5).
As with N rates, greater N substrate availability from the residue probably increased N2O flux with residue presence than without in fallow (Table 2). Since crop residues are generally considered as stimulants for N2O emissions based on their N content [30], it is not surprising to observe greater N2O flux with residue application than without [31,32]. Variability in N2O flux with spring wheat residue rates at various DAPs (Figure 3), however, suggests that N mineralization and immobilization processes may have influenced flux levels with time. Lower N2O flux with 0.50% than with 0.25% residue rate at 5 DAP was probably due to greater N immobilization but greater flux with high residue rate at 55 to 65 DAP likely a result of increased N mineralization (Figure 3). Nonlegume residues with high C/N ratio can immobilize N in the soil immediately after application but can mineralize N later [33].
For calculating N fertilizer-induced N2O emissions, total N2O flux during the 105 d measurement period, as calculated by linearly interpolating data points and integrating the underlying area [34], were 105 and 620 g∙N∙ha−1 for 0.11 and 0.96 g∙N∙pot−1 (or 9 and 80 kg∙N∙ha−1), respectively. The N fertilizer-induced N2O emissions [(N2O flux at 0.96 g∙N∙pot−1 − N2O flux at 0.11 g∙N∙pot−1)/(differences in N rates) × 100] was 0.73%, which was lower than 1% as estimated by IPCC [30] in the field conditions. Our value was just for comparison only and may not be applicable to the field conditions, since greenhouse conditions are different from field conditions and N2O flux was measured only for 105 d in the greenhouse compared to year-round fluxes in the field.
3.2.3. Methane
Methane flux varied with DAPs, with significant interactions for residue placement × crop species × N rate and residue placement × DAP (Tables 3 and 5). In contrast to CO2 and N2O fluxes, CH4 flux was mostly negative at most DAPs (Figure 5, Tables 4 and 5). It is not surprising to observe negative CH4 flux for agricultural soils, except for paddy soil, due to absorption of CH4 by methanotrophs [5,35]. The CH4 flux values of −4 g∙C∙ha−1∙d−1 at 60 DAP to 14 g∙C∙ha−1∙d−1 at 105 DAP obtained in this experiment were within or greater than the field ranges of −12 to 5 g∙C∙ha−1∙d−1 under spring wheat-fallow and fallow systems in western Nebraska and central North Dakota [20,36]. Methane uptake was greater in the surface than in the incorporated surface residue at 3, 30, and 55 DAP but was greater in the incorporated than in the surface residue at 75 and 105 DAP (Figure 5). Averaged across DAPs, CH4 uptake was greater under fallow with incorporated and surface residues and 0.11 g∙N∙pot−1 than in other treatments, except under spring wheat with incorporated residue and 0.11 g∙N∙pot−1 (Table 4).
The greater CH4 uptake in the surface than in the incorporated residue at <55 DAP was probably due to greater soil water content but greater uptake in the incorporated than in the surface residue at >75 DAP was likely a result of greater microbial activity as a result of increased contact of microorganisms with the residue. Similarly, greater CH4 uptake under fallow with surface and incorporated residues at lower N rate than in other treatments could be a result of increased activity of methanotrophs. It has been known that reduced N fertilization rate can increase CH4 uptake by soil [9].
4. Conclusion
A benefit of measuring GHG emissions during a crop growing season under controlled soil and environmental conditions in the greenhouse was to reduce spatial and temporal variability, which were less than half of that normally reported in the field. In these conditions, greater root respiration increased CO2 flux under spring wheat but increased soil water content under fallow increased N2O flux when pea was not included in the crop species for data analysis. When pea was included, N2O flux, however, was greater under pea than under spring wheat, a result of greater N contribution by pea residue. Similarly, higher soil water content increased both CO2 and N2O fluxes in the surface than in the incorporated residue. Carbon dioxide flux responded positively to increased spring wheat residue rate and N2O flux to increased N fertilization rate. A combination of surface residue and high N fertilization rate under spring wheat and fallow further increased both CO2 and N2O fluxes compared to other treatments. Unlike CO2 and N2O fluxes, CH4 flux was mostly negative and its uptake was greater under fallow with incorporated residue and lower N rate than in other treatments. Since crops vary in root respiration rates due to variation in root growth and N fertilization is needed to sustain yields of nonlegume crops but legume crops can reduce N rate, a rotation of legume-nonlegume crops with reduced N fertilization rates in surface (no-till) or incorporated residue (till) system may mitigate GHG emissions and sustain crop yields.
REFERENCES
- Greenhouse Gas Working Group, “Agriculture’s Role in Greenhouse Gas Emissions and Capture,” Greenhouse Gas Working Group Report, ASA, CSSA, and SSSA, Madison, 2010.
- G. P. Robertson, E. Paul and R. Harwood, “Greenhouse Gases in Intensive Agriculture: Contribution of Individual Gases to the Radiative Forcing of the Atmosphere,” Science, Vol. 289, No. 5486, 2000, pp. 1922-1925. doi:10.1126/science.289.5486.1922
- C. F. Drury, W. D. Reynolds, C. S. Tan, T. W. Welacky, W. Calder and N. B. McLaughlin, “Emissions of Nitrous Oxide and Carbon Dioxide: Influence of Tillage Type and Nitrogen Placement Depth,” Soil Science Society of America Journal, Vol. 70, No. 2, 2006, pp. 570-581. doi:10.2136/sssaj2005.0042
- R. L. Lemke, R. C. Izaurralde, M. Nyborg and E. D. Solberg, “Tillage and Nitrogen Source Influence Soil-Emitted Nitrous Oxide in the Alberta Parkland Region,” Canadian Journal of Soil Science, Vol. 79, No. 1, 1999, pp. 15-24. doi:10.4141/S98-013
- A. R. Mosier, A. D. Halvorson, C. A. Reule and X. J. Liu, “Net Global Warming Potential and Greenhouse Gas Intensity in Irrigated Cropping Systems in Northeastern Colorado,” Journal of Environmental Quality, Vol. 35, No. 4, 2006, pp. 1584-1598. doi:10.2134/jeq2005.0232
- D. Curtin, H. Wang, F. Selles, B. G. McConkey and C. A. Campbell, “Tillage Effects on Carbon Fluxes in Continuous Wheat and Fallow-Wheat Rotations,” Soil Science Society of America Journal, Vol. 64, 2000, pp. 2080-2086. doi:10.2136/sssaj2000.6462080x
- U. M. Sainju, J. D. Jabro and W. B. Stevens, “Soil Carbon Dioxide Emission and Carbon Content as Affected by Irrigation, Tillage, Cropping System, and Nitrogen Fertilization,” Journal of Environmental Quality, Vol. 37, No. 1, 2008, pp. 98-106. doi:10.2134/jeq2006.0392
- S. S. Malhi and R. Lemke, “Tillage, Crop Residue, and Nitrogen Fertilizer Effects on Crop Yield, Nutrient Uptake, Soil Quality and Nitrous Oxide Gas Emissions in a Second 4-yr Rotation Cycle,” Soil and Tillage Research, Vol. 96, No. 1-2, 2007, pp. 269-283. doi:10.1016/j.still.2007.06.011
- K. F. Bronson and A. R. Mosier, “Suppression of Methane Oxidation in Aerobic Soil by Nitrogen Fertilizers, Nitrification Inhibitors, and Urease Inhibitors,” Biology and Fertility of Soils, Vol. 17, No. 4, 1994, pp. 263-268. doi:10.1007/BF00383979
- U. M. Sainju, J. D. Jabro and T. Caesar-TonThat, “Tillage, Cropping Sequence, and Nitrogen Fertilization Effects on Dryland Soil Carbon Dioxide Emission and Carbon Content,” Journal of Environmental Quality, Vol. 39, 2010, pp. 935-945. doi:10.2134/jeq2009.0223
- T. B. Parkin and T. C. Kaspar, “Temperature Controls on Diurnal Carbon Dioxide Flux: Implications for Estimating Soil Carbon Loss,” Soil Science Society of America Journal, Vol. 67, No. 6, 2003, pp. 1763-1772. doi:10.2136/sssaj2003.1763
- M. M. Al-Kaisi and X. Yin, “Tillage and Crop Residue Effects on Soil Carbon and Carbon Dioxide Emission in Corn-Soybean Rotation,” Journal of Environmental Quality, Vol. 34, No. 2, 2005, pp. 437-445. doi:10.2134/jeq2005.0437
- B. Amos, T. J. Arkebauer and J. W. Doran, “Soil Surface Fluxes of Greenhouse Gases in an Irrigated Maize-Based Agroecosystem,” Soil Science Society of America Journal, Vol. 69, No. 2, 2005, pp. 387-395. doi:10.2136/sssaj2005.0387
- T. B. Parkin and T. C. Kaspar, “Temporal Variability of Soil Carbon Dioxide Flux: Effect of Sampling Frequency on Cumulative Carbon Loss Estimation,” Soil Science Society of America Journal, Vol. 68, No. 4, 2004, pp. 1234-1241. doi:10.2136/sssaj2004.1234
- T. B. Parkin, J. L. Starr and J. J. Meisinger, “Influence of Sample Size on Measurement of Soil Denitrification,” Soil Science Society of America Journal, Vol. 51, No. 6, 1987, pp. 1492-1501. doi:10.2136/sssaj1987.03615995005100060017x
- T. B. Parkin and R. T. Venterea, “Sampling Protocols. Chamber-Based Trace Gas Flux Measurements,” 2010. http://www.ars.usda.gov/research/GRACEnet
- U. M. Sainju, T. Caesar-TonThat and A. Caesar, “Comparison of Soil Carbon Dioxide Flux Measurements by Static and Portable Chambers in Various Management Practices,” Soil and Tillage Research, Vol. 118, 2012, pp. 123-131. doi:10.1016/j.still.2011.10.020
- J. L. Pikul, Jr. and J. K. Aase, “Water Infiltration and Storage Affected by Subsoiling and Subsequent Tillage,” Soil Science Society of America Journal, Vol. 67, No. 3, 2003, pp. 859-866. doi:10.2136/sssaj2003.0859
- G. L. Hutchinson and A. R. Mosier, “Improved Soil Cover Method for Field Measurement of Nitrous Oxide Fluxes,” Soil Science Society of America Journal, Vol. 45, No. 2, 1981, pp. 311-316. doi:10.2136/sssaj1981.03615995004500020017x
- M. A. Liebig, D. L. Tanaka and J. R. Gross, “Fallow Effects on Soil Carbon and Greenhouse Gas Flux in Central North Dakota,” Soil Science Society of America Journal, Vol. 74, No. 2, 2010, pp. 358-365. doi:10.2136/sssaj2008.0368
- R. C. Littell, G. A. Milliken, W. W. Stroup and R. D. Wolfinger, “SAS System for Mixed Models,” SAS Institute Inc., Cary, 1996.
- J. L. Pikul Jr., J. K. Aase and V. L. Cochran, “Lentil Green Manure as Fallow Replacement in the Semiarid Northern Great Plains,” Agronomy Journal, Vol. 89, No. 6, 1997, pp. 867-874. doi:10.2134/agronj1997.00021962008900060004x
- A. W. Lenssen, J. T. Waddell, G. D. Johnson and G. R. Carlson, “Diversified Cropping Systems in Semiarid Montana: Nitrogen Use during Drought,” Soil and Tillage Research, Vol. 94, No. 2, 2007, pp. 362-375. doi:10.1016/j.still.2006.08.012
- P. R. Miller, B. McConkey, G. W. Clayton, S. A. Brandt, J. A. Staricka, A. M. Johnston, G. P. Lafond, B. G. Schatz, D. D. Baltensperger and K. E. Neill, “Pulse Crop Adaptation in the Northern Great Plains,” Agronomy Journal, Vol. 94, No. 2, 2002, pp. 261-272. doi:10.2134/agronj2002.0261
- P. Rochette, L. B. Flanagan and E. G. Gregorich, “Separating Soil Respiration into Plant and Soil Components Using Analyses of the Natural Abundance of Carbon-13,” Soil Science Society of America Journal, Vol. 63, No. 5, 1999, pp. 1207-1213. doi:10.2136/sssaj1999.6351207x
- M. P. Dusenbury, R. E. Engel, P. R. Miller, R. L. Lemke and R. Wallander, “Nitrous Oxide Emissions from a Northern Great Plains Soil as Influenced by Nitrogen Management and Cropping Systems,” Journal of Environmental Quality, Vol. 37, No. 2, 2008, pp. 542-550. doi:10.2134/jeq2006.0395
- A. L. Black and A. Bauer, “Strategies for Storing and Conserving Soil Water in the Northern Great Plains,” In: P. W. Unger, Ed., Proceeding International Conference on Dryland Farming, Bushland, 15-19 August 1988, Texas Agricultural Experiment Station, College Station, 1988, pp. 137-139.
- H. J. Haas, W. O. Willis and J. J. Bond, “Summer Fallow in the Western United States,” USDA Conservation Research Report No. 17, US Government Printing Office, Washington DC, 1974, pp. 2-35.
- M. S. Aulakh, D. A. Rennie and E. A. Paul, “Gaseous Nitrogen Losses from Cropped and Summer-Fallowed Soils,” Canadian Journal of Soil Science, Vol. 62, No. 1, 1982, pp. 187-196. doi:10.4141/cjss82-020
- International Panel on Climate Change (IPCC), “IPCC Guidelines for National Greenhouse Gas Inventories,” IPCC/IGES, Hayama, 2006.
- K. A. Frimpong and E. M. Baggs, “Do Combined Applications of Crop Residues and Inorganic Fertilizer Lower Emission of N2O from Soil?” Soil Use and Management, Vol. 26, No. 4, 2010, pp. 412-424. doi:10.1111/j.1475-2743.2010.00293.x
- Y. Huang, J. Zou, X. Zheng, Y. Wang and X. Xu, “Nitrous Oxide Emissions as Influenced by Amendment of Plant Residues with Different C:N Ratios,” Soil Biology and Biochemistry, Vol. 36, No. 6, 2004, pp. 973-981. doi:10.1016/j.soilbio.2004.02.009
- S. Kuo, U. M. Sainju and E. J. Jellum, “Winter Cover Cropping Influence on Nitrogen in Soil,” Soil Science Society of America Journal, Vol. 61, No. 5, 1997, pp. 1392- 1399. doi:10.2136/sssaj1997.03615995006100050016x
- R. O. Gilbert, “Statistical Methods for Environmental Pollution Monitoring,” John Wiley and Sons, New York, 1987.
- G. Hernandez-Ramirez, S. M. Brouder, D. R. Smith and G. E. Van Scoyoc, “Greenhouse Gas Fluxes in an Eastern Cornbelt Soil: Weather, Nitrogen Source, and Rotation,” Journal of Environmental Quality, Vol. 38, No. 3, 2009, pp. 841-847. doi:10.2134/jeq2007.0565
- A. Kessavalou, A. R. Mosier, J. W. Doran, R. A. Drijber, D. J. Lyon and O. Heinemeyer, “Fluxes of Carbon Dioxide, Nitrous Oxide, and Methane in Grass Sod and Winter Wheat-Fallow Tillage Management,” Journal of Environmental Quality, Vol. 27, No. 5, 1998, pp. 1094-1104. doi:10.2134/jeq1998.00472425002700050015x
NOTES
*Mention of trade names or commercial products in this publication is solely for the purpose of providing specific information and does not imply recommendation or endorsement by USDA. The USDA is an equal opportunity employer.
#Corresponding author.