Journal of Environmental Protection
Vol. 3 No. 1 (2012) , Article ID: 16856 , 6 pages DOI:10.4236/jep.2012.31014
Modelling the Biomass Growth and Enzyme Secretion by the White Rot Fungus Phanerochaete chrysosporium in Presence of a Toxic Pollutant
![]()
1Department of Biotechnology, IIT Guwahati, Guwahati, India; 2Department of Physics, IIT Guwahati, Guwahati, India.
Email: *pakshi@iitg.ernet.in
Received June 12th, 2011; revised October 25th, 2011; accepted November 27th, 2011
Keywords: Toxic Pollutant; Phanerochaete chrysosporium; DR-80; Dye Decolourization; Stochastic Model; Lignin Peroxidase
ABSTRACT
The white rot fungus Phanerochaete chrysosporium is well known for its ability to degrade toxic pollutants owing to its efficient extracellular ligninase system. However, biomass growth and enzyme secretion in presence of toxic pollutant is not well understood. In the present study, using the model azo dye Direct Red-80, biomass growth and lignin peroxidase secretion by the fungus was studied during its degradation and a stochastic based model was applied to simulate the behavior of the fungus. Also, glucose concentration in the medium was varied in order to observe its effect on the dye degradation. Results revealed that glucose at an optimum concentration of 10 g·L–1 is essential for biomass growth, LiP secretion, as well as the dye decolourization. Modeling the behavior of the fungus with the presence of both glucose and dye has shown significant similarity.
1. Introduction
Industrial wastes are the main source of toxic pollutants in the environment mainly due to lack of proper treatment and discharge of such wastes. Biological treatment processes are frequently preferred to treat industrial effluents in comparison to other remediation methods [1-4] as they seem more effective, economical and environment friendly. The white-rot fungus Phanerochaete chrysosporium, which belongs to a group of lignin-degrading basidiomycetes, has received considerable attention in the past for their bioremediation potential [5-7] owing to its natural capability to degrade complex lignin using extracellular non-specific and non-stereo selective enzyme system composed of lignin peroxidases (LiP, EC 1.11. 1.14), laccases (EC1.10.3.2), and manganese peroxidases (MnP, EC 1.11.1.13). The same unique non-specific mechanisms that give these fungi the ability to degrade lignin also allow them to degrade a wide range of pollutants, such as azo dyes, polycyclic aromatic hydrocarbons, chlorinated phenols, polychlorinated biphenyls, dioxins, pesticides and explosives [8]. However, in order to further establish the potential of the organism for environmental remediation purpose it is necessary to understand and model the biomass growth and enzyme secretion by the fungus in presence of such toxic pollutants. Therefore, the present study was aimed at investigating the effects of DR-80, a toxic azo dye widely used in modern textile and dyeing industries, on these two aspects of the fungus. Since media is also known to play a vital role on growth of the fungus and biodegradation of the dye [9], effects of media constituents, mainly glucose concentration, on dye degradation were observed and modeled in the study.
Azo dyes such as DR-80, structure shown in Figure 1, are characterized by one or more number of azo (–N=N–) linkages present within the aromatic side chains. Under anaerobic conditions, the azo linkages are reduced to form aromatic amines. These are known to be toxic and mutagenic to living organisms [10]. These dyes are highly stable to light and resist microbial attack [11], thus posing a serious threat to the environment.
Several models for the fungal growth have been observed in literature; however, kinetic models were preferably applied only to model dye decolourization for the procedures other than bioremediation [12]. Fluid dynamics modeling by numerical finite volume scheme has also been applied to study dye decolourization using titanium nano-photocatalysis [13]. Current study focuses on Monte Carlo (MC) based model for simulating biomass growth
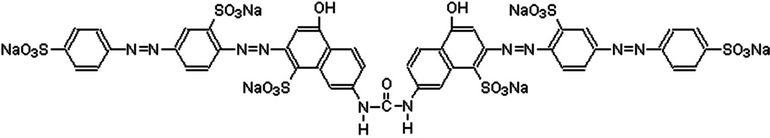
Figure 1. Molecular structure of dye DR-80 (Serius red F3B) used in the experiments.
and enzyme secretion as well as DR-80 dye decolourization by P. chrysosporium.
2. Materials & Methods
2.1. Chemicals
The azo dye Direct Red-80 and veratryl alcohol were purchased from Sigma (St. Louis, Mo, USA); all other chemicals and solvents were purchased from High Media, Mumbai (India), SRL (India) or Merck (India), which were all of GR grade.
2.2. Microorganism and Culture Conditions
The fungus P. chrysosporium MTCC 787, used in this study was procured from IMTECH, Chandigarh, India, and was maintained at 25˚C on potato dextrose agar (PDA) slants. For spore production, the slants were incubated at 39 ˚C for 2 to 5 days in media containing glucose: 10 g·L–1, malt extract: 10 g·L–1, peptone: 2 g·L–1, yeast extract: 2 g·L–1, asparagine: 1 g·L–1, KH2PO4: 2 g·L–1, MgSO4·7H2O: 1 g·L–1, thiamin-HCl: 0.001 g·L–1 and agar: 20 g·L–1 [14]. The composition of media used for studying DR-80 decolourization is mentioned in Table 1. All dye decolourization experiments in the study were performed using 250 ml flasks containing 100 ml media with initial pH 4.5; following inoculation, the flasks were incubated in an orbital shaker set at 30˚C and 150 rpm. Effect of initial concentration of glucose was studied in the range of 4 - 16 g·L–1 by fixing the initial dye concentration at 0.02 g·L–1. To study the effect of initial dye concentration it was varied in the range 0.01 - 0.05 g·L–1 keeping initial glucose concentration at 10 g·L–1. Fungal growth in the experiments was measured by counting the spores using a haemocytometer [15].
2.3. Assays for LiP and DR-80
Samples collected at regular intervals were centrifuged at 10,000 ×g for 10 min at 4˚C to remove the fungal biomass. After separation of the cells, one part of the supernatant containing lignin peroxidase enzyme was assayed by spectrophotometric method [16], which was based on the oxidation of veratryl alcohol to veratraldehyde. For the enzyme assay, standard reaction mixture consisted of 1 ml of 125 mM sodium tartrate buffer (pH 3), 500 µl of 10 mM veratryl alcohol, 500 µl of 2 mM H2O2 solution and 500 µl of biomass free supernatant obtained as mentioned before. The reaction was initiated by adding H2O2 and the change in absorbance was monitored at 310 nm. Whilst the alcohol exhibits no absorbance at this wavelength, the aldehyde absorbs much strongly. One unit (U) of lignin peroxidase enzyme activity was defined as the amount that converts 1 mol of veratryl alcohol to veratraldehyde per minute per ml of the supernatant; the enzyme activities were expressed as UL–1 [17]. The other part of the supernatant was used for determining the residual dye concentration by measuring its absorbance (λmax) at 523 nm using a UV-visible spectrophotometer (Carry 100, Varian, USA). Percent (%) dye decolourization is calculated as follows

where D0 is the initial dye concentration and Dt is the dye concentration at any time t in the medium.
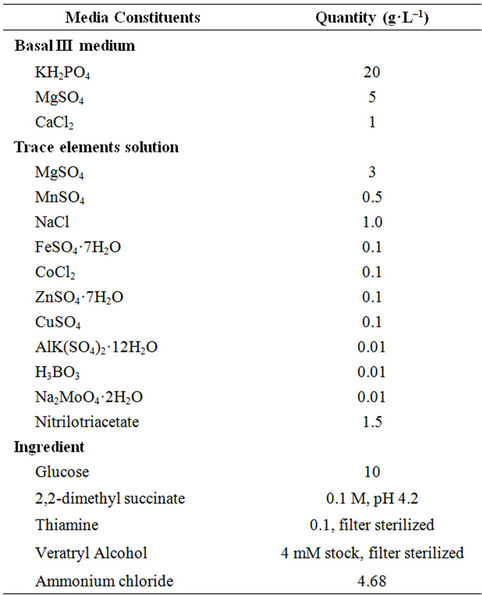
Table 1. Composition of the media used for DR-80 decolourization by P. chrysosporium.
3. Results
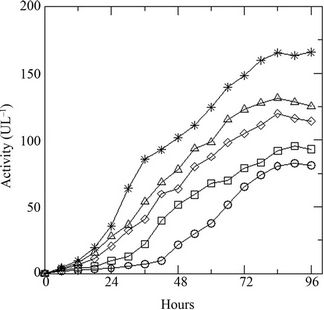
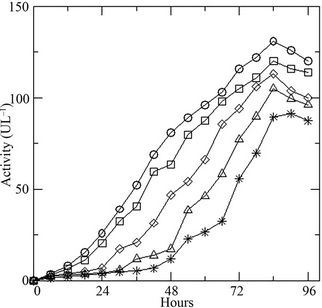
Variation of initial concentration of glucose in the medium shows prominent effect on the growth of the fungus. Presence of the DR-80 (0.02 g·L–1), reduces the spore count initially due to its toxic nature (Figure 2(a)). The maximum biomass growth of fungus increases with the increase of initial concentration of glucose, whereas the growth rate remains same. The % decolourization of the dye increases (Figure 2(b)) with increasing glucose as the LiP activity was also found to increase (Figure 2(c)). Changing the initial dye concentration at constant glucose (10 g·L–1), the fungus displays opposite behavior with highest biomass growth in lowest concentrations of dye (Figure 3(a)). The reduction in initial inoculums is also observed here. Similarly the % dye decolourization as well as LiP activity is also reversed. It is found that the increment of the initial dye concentration decreases the % dye decolourization in the medium (Figure 3(b)) and also the LiP activity at constant glucose (Figure 3(c)).
4. The Model
Recently, a stochastic model of fungal growth and enzyme secretion by the fungus was developed [18,19] in order to understand the biomass growth and enzyme activity of P. chrysosporium in absence of any toxic pollutant. The model successfully explains the experimental results obtained in a toxic pollutant free medium. In this paper, the same model has been extended for studying the fungal growth and activity of the enzyme secreted by the fungus in presence of a toxic pollutant (dye). The stochastic model developed, taking glucose as the sole source of carbon, contains three major parts: 1) consumption
 (a)
(a)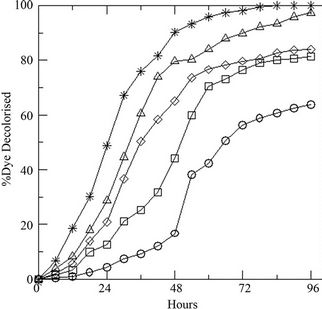 (b)
(b)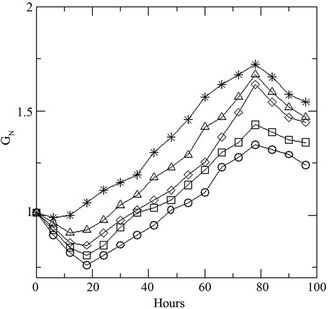 (c)
(c)
Figure 2. (a) Growth of the fungus in terms of generations (GN) with increasing initial glucose concentration [4 (○), 8 (□), 10 (◊), 12 (∆), 16 (٭) g·L–1] at constant dye concentration [0.02 g·L–1]; (b) Percent dye decolourization in the medium at different initial glucose concentration [4 (○), 8 (□), 10 (◊), 12 (∆), 16 (٭) g·L–1] at constant dye concentration [0.02 g·L–1]; and (c) LiP activity at the same concentrations of glucose and dye.
 (a)
(a)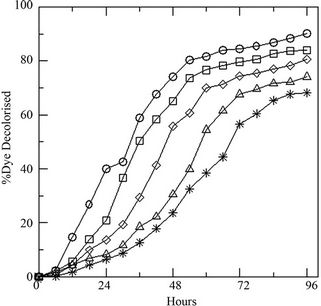 (b)
(b) (c)
(c)
Figure 3. (a) Growth of the fungus in terms of generations (GN) with increasing initial dye concentration [0.01 (○), 0.02 (□), 0.03 (◊), 0.04 (∆), 0.05 (٭) g·L–1]; and (b) percent dye decolorized in the medium at different initial dye concentration [0.01 (○), 0.02 (□), 0.03 (◊), 0.04 (∆), 0.05 (٭)g·L–1] at constant initial glucose concentration (10 g·L–1); and (c) LiP activity at the same concentrations of glucose and dye.
of glucose, 2) cell division and 3) secretion of enzyme. It was found in the experimental study performed here that the decolourization and biomass growth both increase with the increasing glucose concentration for a given dye concentration whereas they decrease with the increasing dye concentration for a given glucose concentration. In the present model, attempt has been made to reproduce the experimental results by controlling the interaction of the fungus with medium and the interaction of enzyme secreted by the fungus with the toxic dye. The immediate effect of addition of dye to the medium is the unavailability of certain amount of glucose to the fungus which is proportional to the dye concentration. The probability of glucose consumption is proportional to the instantaneous glucose concentration of the medium Gt and glucose intake probability of a cell pi, Gt is given by
where 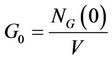
is the initially available glucose concentration and
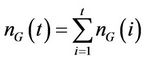
is the number of glucose molecules consumed upto time t. The intake probability of a cell pi is defined in terms of the cell size g and is given by
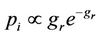
where  is the relative size of the cell with respect to the mature cell size
 . The glucose consumption probability is then given by
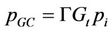
where  is the molar ability of attachment of a glucose molecule to a cell. The probability of cell division is modeled by a sigmoidal growth probability distribution and it is given by,

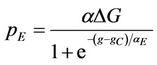
where  is the capability of cell division of a matured cell. P. chrysosporium is known to produce LiP as secondary metabolite when glucose concentration in the medium is less. The probability of enzyme production by a cell is then directly proportional to the instantaneous glucose concentration of the medium. It is also a function of the cell size. The production of LiP by the fungus is modeled as
where ,
,  is the molar adaptability of the cell to the initial medium and
  is the enzyme production ability of a mature cell.
A Monte Carlo (MC) technique is adopted to implement different processes exactly with their respective probabilities [19]. For each process, a random number r, uniformly distributed between 0 and 1, is called corresponding to a cell. If  the probability of the corresponding process to occur, the cell is allowed to perform the respective process such as, consumption of glucose, cell division and enzyme production. The three sub-processes, glucose consumption, cell division and release of enzyme over all the cells constitute a single MC time step. To avoid accumulation of enzyme in the medium, lifetime
  of enzyme is introduced. The number of enzyme decays exponentially as
  where
where  is the time of presence of an enzyme in the medium.
In order to study the decolourization process, a simplified enzyme kinetic reaction between the enzyme and the dye is considered here as  [20], where E stands for enzyme, D stands for dye and P stands for dye degradation product. The rate of dye degradation can be estimated as
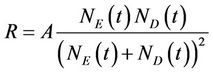
where A is a constant, NE(t) and ND(t) are instantaneous number of enzyme and dye molecules in the medium, respectively. Though A is independent of time, it is inversely proportional to the initial number of dye molecules per spore. In principle, A should be a function of temperature, reduced mass of two reacting molecules and the activation energy of the reaction. However, for a given reaction at room temperature, it is a constant and a prefactor is assigned accordingly.
Model Results
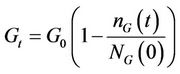
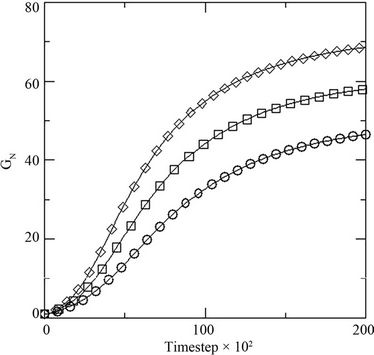
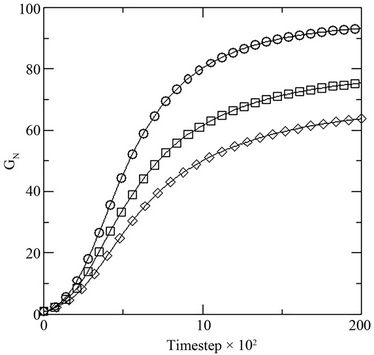
The model has been studied for two different initial conditions taking water volume equal to 107. First, for a given dye concentration (0.02), glucose concentration is varied from 0.1 to 0.3. It has been observed that the overall biomass growth is diminished due to the presence of dye whereas the growth is found to be enhanced with the increasing amount of glucose. The results plotted as generations, given by
 where NS(0) is the initial number of spores added to the medium and NS(t) is the number of spores present in the medium at any time t, with respect to the MC time step t in Figure 4(a). The percent dye decolourization, calculated as
 , where ND(0) is the initial number of dye molecules and ND(t) is the number of dye molecules at any time t in the medium, with time is also estimated and the data are presented in Figure 4(b). The maximum decolourization decreases with decreasing initial glucose concentration in the medium as it is observed in the experiment. The time represents the MC time steps only. It seems that 20,000 MC steps is equivalent to 96 hours of experiment since all the process considered here saturates by this time. Secondly, the model is studied varying the dye concentration in medium for a given initial glucose concentration (0.1). Both biomass growth as generations (GN) and percent dye decolourization(nD) are estimated and the data are plotted in Figures 5(a) and (b) respectively with respect to time t. For a given glucose concentration, biomass growth decreases as the dye concentration in the medium increases, similar to the results found from experiments. The percent dye decolourization (nD) is also found decreasing with increasing dye concentration. The latter is due to the toxic effect of dye on the fungus. Usually, the cellular processes are affected due to the presence of toxic pollutant in the medium. However, in the model only interaction of the cells with the external medium is considered. The effective interaction with the medium by the cell can be considered as an overall effect of all the modified cellular processes.
 (a)
(a)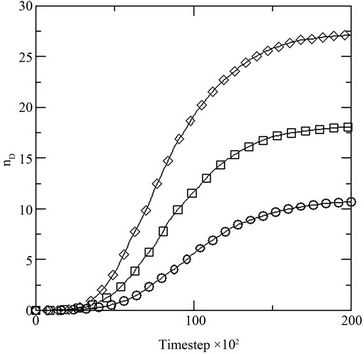 (b)
(b)
Figure 4. (a) Growth in terms of generations (GN) of initial inoculums with respect to MC time steps in model with constant initial dye concentration [0.02] at different initial glucose concentration [0.10 (○), 0.20 (□), 0.30 (◊)]; and (b) percent dye decolorized (nD) in the medium at different initial glucose concentration [0.10 (○), 0.20 (□), 0.30 (◊)] at constant dye concentration [0.02].
 (a)
(a)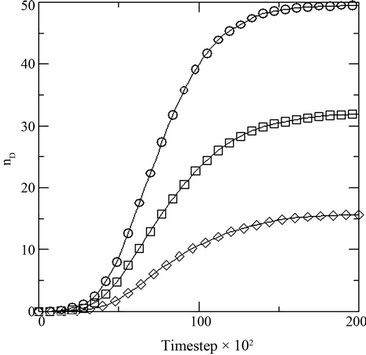 (b)
(b)
Figure 5. (a) Growth in terms of generations (GN) of initial inoculums with respect to MC time steps in model with constant initial glucose concentration [0.1] at different initial dye concentrations [0.001 (○), 0.002(□), 0.003(◊)]; and (b) percent dye decolorized (nD) in the medium at different initial dye concentration [0.001 (○), 0.002(□), 0.003(◊)] at constant initial glucose concentration [0.1].
5. Summary & Conclusion
Toxic effects of the dye result in reduction in biomass growth of the fungus. Increment of glucose concentration in the medium at constant dye concentration, however, increases the biomass growth. Whereas, increasing the dye concentration reduces it. Presence of dye in the medium reduces the initial glucose availability to the fungus. Incorporation of this effect in the model, predicted the change in biomass growth similarly. The dye decolourization in the medium was increased due to the increase in glucose concentration at constant dye but decreases when dye concentration is increased at constant glucose concentration. Similar effects are predicted by the model developed. Thus, careful quantization of the parameters of the model can predict the behavior of the fungus for other types of dyes as well as other fungal systems with similar function.
REFERENCES
- B. K. Korbahti and M. A. Rauf, “Application of Response Surface Analysis to the Photolytic Degradation of Basic Red 2 Dye,” Chemical Engineering Journal, Vol. 138, No. 1-3, 2008, pp. 166-171. doi:10.1016/j.cej.2007.06.016
- N. Aleboyeh, N. Daneshvar and M. B. Kasiri, “Optimization of C.I. Acid Red 14 azo Dye Removal by Electrocoagulation Batch Process with Response Surface Methodology,” Chemical Engineering and Processing, Vol. 47, No. 5, 2008, pp. 827-832. doi:10.1016/j.cep.2007.01.033
- M. M. Hassan and C. J. Hawkyard, “Ferral-Catalyzed Ozonation of Aqueous Dyes in a Bubble Column Reactor,” Catalysis Communications, Vol. 3, No. 7, 2002, pp. 281-286. doi:10.1016/S1566-7367(02)00121-8
- S. H. Lin and M. L. Chen, “Treatment of Textile Wastewater by Chemical Methods for Reuse,” Water Research, Vol. 31, No. 4, 1997, pp. 868-876. doi:10.1016/S0043-1354(96)00318-1
- J. A. Bumpus and B. J. Brock, “Biodegradation of Crystal Violet by the White Rot Fungus Phanerochaete chrysosporium,” World Journal of Microbiology and Biotechnology, Vol. 54, No. 5, 1988, pp. 1143-1150.
- C. Cripps, J. A. Bumpus and S. D. Austin, “Biodegradation of Azo and Heterocyclic Dyes by Phanerochaete chrysosporium,” Applied and Environmental Microbiology, Vol. 56, No. 4, 1990, pp. 1114-1118.
- D. K. Bakshi, K. G. Gupta and P. Sharma, “Enhanced Bio Decolourization of Synthetic Textile Dye Effluent by Phanerochaete chrysosporium under Improved Culture Conditions,” World Journal of Microbiology and Biotechnology, Vol. 15, No. 4, 1999, pp. 507-509. doi:10.1023/A:1008974513785
- S. B. Pointing, “Feasibility of Bioremediation by WhiteRot Fungi,” Applied Microbiology and Biotechnology, Vol. 57, No. 1-2, 2001, pp. 20-33. doi:10.1007/s002530100745
- K. Pakshirajan, S. Singh and A. Daverey, “Enhanced Decolourization of Direct Red-80 dye by the White Rot Fungus Phanerochaete chrysosporium Employing Sequential Design of Experiments,” Biodegradation, Vol. 21, No. 4, 2009, pp. 501-511.
- U. Meyer, “Biodegradation of Synthetic Organic Colorants,” In: T. Leisinger, A. M. Cook, R. Hunter and J. Nuesch, Eds., FEMS Symposium 12, Academic Press, London, 1981, pp. 371-385.
- G. B. Michaels and D. L. Lewis, “Sorption and Toxicity of Triphenyl Methane Dyes to Aquatic Microbial Populations,” Environmental Toxicology and Chemistry, Vol. 4, No. 1, 1985, pp. 45-50. doi:10.1002/etc.5620040107
- A. M. El-Dein, J. A. Libra and U. Wiesmann, “Mechanism and Kinetic Model for the Decolorization of the Azo Dye Reactive Black 5 by Hydrogen Peroxide and UV Radiation,” Chemosphere, Vol. 52, No. 6, 2003, pp. 1069- 1077.
- N. M. Mahmoodi and M. Arami, “Numerical finite Volume Modeling of Dye Decolorization Using Immobilized Titania Nanophotocatalysis,” Chemical Engineering Journal, Vol. 146, No. 2, 2009, pp. 189-193. doi:10.1016/j.cej.2008.05.036
- T. K. Kirk and M. Tien, “Lignin Peroxidase of Phanerochaete chrysosporium,” Methods in Enzymology, Vol. 161, 1988, pp. 238-249. doi:10.1016/0076-6879(88)61025-1
- S. C. Morris and P. J. Nicholls, “An Evaluation of Optical Density to Estimate Fungal Spore Concentrations in Water Suspensions,” Phytopathology, Vol. 68, No. 8, 1978, pp. 1240-1242. doi:10.1094/Phyto-68-1240
- T. K. Kirk, M. Tien and P. J. Kersten, “Lignin Peroxidase from Fungi: Phanerochaete chrysosporium,” Methods in Enzymology, Vol. 188, 1990, pp. 159-171. doi:10.1016/0076-6879(90)88029-A
- S. Linko and R. Haapala, “A Critical Study of Lignin Peroxidase Activity Assay by Veratryl Alcohol Oxidation,” Biotechnology Techniques, Vol. 7, No. 1, 1993, pp. 75-80. doi:10.1007/BF00151094
- K. Sen, K. Pakshirajan and S. B. Santra, “Modeling the Biomass Growth and Enzyme Secretion by the White Rot Fungus Phanerochaete chrysosporium: A Stochastic Based Approach,” (in Communication), 2011,
- C. J. Mode, “Applications of Monte Carlo Methods in Biology, Medicine and Other Fields of Science,” InTech, Croatia, 2011.
- M. Agrawal, S. B. Santra, R. Anand and R. Swaminathan, “Effect of Macromolecular Crowding on the Rate of Diffusion-Limited Enzymatic Reaction,” Pramana—Journal of Physics, Vol. 71, No. 2, 2008, pp. 359-368.
NOTES
*Corresponding author.