Smart Grid and Renewable Energy
Vol.4 No.2(2013), Article ID:32197,16 pages DOI:10.4236/sgre.2013.42029
Role of Energy Storage on Distribution Transformer Loading in Low Voltage Distribution Network
![]()
School of Engineering and Technology, Higher Education Division, Central Queensland University, Rockhampton, Australia.
Email: m.arif@cqu.edu.au
Copyright © 2013 Mohammad Taufiqul Arif et al. This is an open access article distributed under the Creative Commons Attribution License, which permits unrestricted use, distribution, and reproduction in any medium, provided the original work is properly cited.
Received December 20th, 2012; revised January 20th, 2013; accepted January 27th, 2013
Keywords: Energy Storage; Distribution Network; Distribution Transformer; Impacts; Solar PV
ABSTRACT
Energy storage (ES) is a form of media that store one form of energy to be utilized at another time. Importance of ES is comprehended while intermittent nature of renewable energy (RE) generation increases and integration into the grid becomes viable in terms of economics and environment. However, technical analysis should be carried out before large scale integration into the grid. Some utilities experienced in Europe and expressed concern about issues in integrating large scale renewable energy in the areas of harmonics, voltage regulation, network protection and islanding. In Australia, distribution network (DN) is not robust compared to the European grid; moreover loads are largely distributed over large geographical areas. Installation of RE such as roof top solar photovoltaic (PV) is increasing in Australia which also boosted by the governments incentives to the individual owners. It is therefore obvious that large scale PV integration into the Australian grid is imminent. The intermittent characteristic of solar PV is expected to have greater impacts on DN in Australia compared to the DN in Europe. Therefore this paper investigated the impacts of solar PV on low voltage (LV) DN where loads connected through distribution transformer (DT) and finally further investigation was conducted with the deployment of ES into the respective load centers. It was found that storage reduced the overall peak load condition on the DT, and also reduced the energy fluctuation in the DN. It was also found that storage improved the voltage regulation on the LV side of DT and stabilized node voltage.
1. Introduction
In large network, voltage drop and voltage capacity will play major role in determining various future network augmentation. Voltage regulation is an important issue of power system control as it needs to maintain steady acceptable voltage under normal operating and distribution conditions [1]. Electrical loads are connected to the DN through DT. In normal operating condition in the DN, the receiving end voltage is less than the sending end voltage due to voltage drop in cables or conductors, bus impedance and transformers throughout the system. Figure 1 shows different voltage profiles under different load conditions considering fixed sending end voltage [2]. Under no load condition, the voltage at the receiving end is greater than the sending end as shown in Figure 1, this type of scenario is known as Ferranti effect. The introduction of distributed generator (DG) into the network has given great uncertainty into the network. Large scale introduction of DG such as solar PV adds uncertainty due to environmental factors such as sunshine with duration
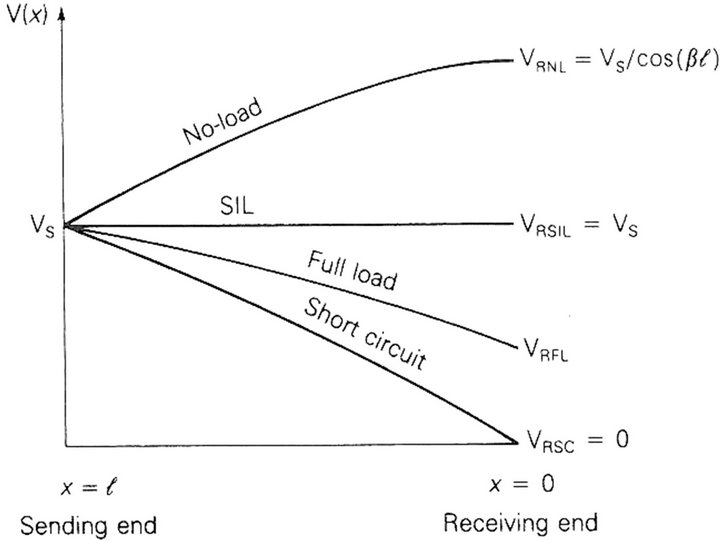
Figure 1. Voltage profile from source to end load [2].
of solar radiation, temperature, cloud movement etc. This uncertainty can cause voltage rise at the receiving end while DG generates more than the required power, and also receiving end voltage may drop if DG is unable to support load especially in the evening when load demand is high. Intermittent nature of PV output could generate fluctuations and large scale such fluctuation could affect the loads connected into the network also uneven generation could exceed the capacity of connected DT. Moreover connection of DG into the network could unload one phase and overload other phase and could lead in phase unbalance condition. These unwanted characteristics can be avoided by buffering excess energy from DG and by supporting load from buffered energy when required.
Energy storage as buffer is essential with renewable energy (RE) such as solar photovoltaic (PV) for stable operation of grid by load management and by keeping voltage, frequency within allowable limit. However performance of PV module depends on load resistance, solar irradiance, cell temperature, cell shading and PV crystalline structure. Electricity generated from DG introduces bi-directional power flow at the point of connection in the DN that influences the voltage regulation, balancing between phases and loading on distribution transformer (DT). Storage can delay the bi-directional power flow by supporting load. By supporting the load demand, storage reduces load on grid and eventually increases the node voltage. Therefore investigation is required to identify the storage impacts on DT and on DN while storage and solar PV is integrated into the network.
2. Background
In LV network, loads particularly residential loads are connected in single phase line of DN through DT. Each DT has specific loading or utilization capacity at a particular time. To ensure quality in power supply to the end user, DT always operated within its safe operating limit which is set by the local distribution network service provider (DNSP). Disturbance in one DT could affect all the loads connected from that DT. Awareness about the effects of greenhouse gas (GHG) emission introduces the interest of generating energy from RE sources. Most of the developed countries set the goal to integrate electricity from RE sources and Australia set the target to introduce 20% electricity from RE by 2020 [3], moreover Australia committed national GHG emission target of 60% below 2000 level by 2050 [4]. To achieve this target roof top solar PV received the maximum boost at the LV level integration. However the output from PV clearly depends on the solar radiation, not on the load demand. Different natural factors introduce fluctuations in the solar radiation which directly adds into the connected network as inverter directly converts the available energy from DC (Direct current) to AC (Alternating current). Moreover solar radiation is not available 24 hours a day, but load demand continues for 24 hours a day. Therefore large number of such PV installation and integration into the DN could lead to some problem which was unseen before.
Austria, France, Germany, Spain, Netherlands and UK are the six leading countries representing 98% of installed PV power in European Union and expressed concern about voltage regulation, harmonics, network protection, islanding, electromagnetic compatibility (EMC) of multiple inverters, unbalanced condition due to large integration of PV into the grid [5]. Energy storage (ES) system can overcome these limitations imposed by the solar PV. ES acts as a buffer that isolates the grid from the frequent and rapid power fluctuations by high penetration of renewable resources [6]. Storage improves the grid penetration of PV energy [7]. However introduction of storage with PV into any particular phase could begin phase unbalance into the network.
Therefore investigation is necessary before large scale storage and PV integration into the distribution network for any potential impact. The following subsections describe the DN structure in Australia, distributed generation and its integration and standard guideline to integrate into the grid.
2.1. Distribution Network
Many elements constitute the DN to supply electricity to the end consumers. The high voltage (HV) transmission network transfers bulk electricity at voltages above 110 kV to the bulk supply substations (BSS). In Queensland, Australia, BSS supply power to the zone substations (ZS) and large customers via 33 kV, 66 kV, 110 kV and 132 kV networks operated as radial, parallel radial or meshed network [8,9] as shown in Figure 2. ZS supplies to the DN by stepping down the voltage to 11 kV, 22 kV or 33 kV. ZS provides protection and control to the local DN. In Australia, DN is a combination of, HV, SWER (Single Wire Earth Return) and LV networks. The distribution network service providers (DNSP) have to meet certain regulated voltages that supplied to the customer via DT. The standard voltages associated with DN in Queensland are:
Ÿ HV DN—11 kV, 22 kV and sometimes 33 kV;
Ÿ LV DN—415 V (Line-Line)/240 V (Line-Ground);
Ÿ SWER—11 kV, 12.7 kV and 19.1 kV.
The popular roof top solar PV mostly installed to meet residential customer needs connected at the LV DN. Although the size of this single customer is very small, however the combined total demand is significant. Similarly combined total solar PV installed in these houses have great influence on the total network performance. The combined maximum capacity of all PV installations connected without a dedicated transformer must remain <30% of the rated capacity of the DT [10]. Akatsuka Motoki et al. [11] mentioned fluctuation in output of megawatt class PV system may disturb stable operation of power system.
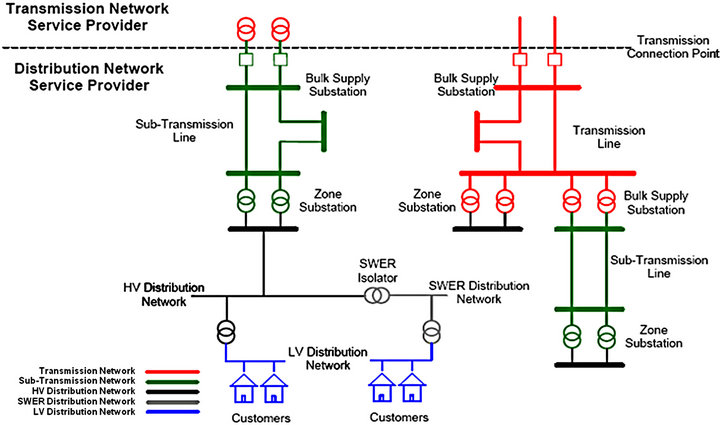
Figure 2. Power distribution network [8].
2.2. Distributed Generation
It is the production of electricity at the customer premises point-of use in the DN. This is an alternate to the conventional method. Renewable energy, co-generation plant and standby generators are considered as DG [12]. RE is defined as an inexhaustible and sustainable energy source, moreover RE reduces the CO2 emission [13]. Two primary RE technologies integrated into the distribution level are rooftop solar PV and small scale wind turbine. However to manage generated electricity from these sources requires energy storage to store electricity when generates excess energy and to supply at a later time. Therefore storage also considered as a DG. For typical household, storage integrated grid connected PV and wind system presents a sustainable and economically viable solution [14-16].
2.3. Integration of Distributed Generators
Electricity generated by the DG is exported to the grid via grid connected inverters. Grid-Tie Inverter (GTI) converts Direct Current (DC) electricity from DGs into Alternating Current (AC) and feed into the LV DN at point of common coupling (PCC). The LV DN is connected to the HV DN through DT and the DT has defined load capacity which set by the DNSP based on the load demand. Figure 2 shows the Network configuration of Ergon Energy where end loads are connected through DT. Maximum DT load capacity recommended by Ergon Energy is 80% however DT can sustain up to 120% of load demand for short duration. Ergon Energy in Queensland serves approximately 680,095 customers of different capacity through 90,500 DTs.
LV DN connects different types of load especially single phase residential load. Residential load profile is different than the total load profile of DN. In Australia, Queensland’s electricity demand will continue to grow more than 3.5% per year [17] and average each household daily peak demand is 1.72 kW [18]. To meet the need of demand growth there should be enough supply from generator side which will eventually increase loading on DT. DNSP in Queensland [19] allows 1.3 kW of PV in each installation in rural areas for DT up to 50 kVA and in urban area 4 kW of PV in each installation for DT up to 100 kVA [19]. Therefore it is required to investigate the loading impacts on DT by adding ES with RE which is a great concern of power quality.
2.4. Power Quality and Regulatory Standards
There is no concrete standard developed yet for integration of bulk and large storage into the grid. However IEEE 1547-2003 [20] provides guideline to connect distributed resources (DR) such as solar PV, wind and energy storage to the power grid at the distribution level. AS-4777 [21] provides guideline to connect RE and storage to the distribution network (DN) via inverters up to 10 kVA for single phase and 30 kVA for three phase unit. As mentioned earlier that DT should be operated within its allowable capacity to ensure required power quality. On the other hand to upgrade DT capacity involves additional cost for DNSP. DT loaded maximally in peak demand time. As mentioned earlier residential load peak demand time is between 16:00 PM to 20:00 PM when solar PV is unable to support the load therefore overall DT loading increases during peak demand. In Queensland Australia, approximately 10% electricity network was built to support only the extreme peak loads [17], similarly utility operators maintain costly short time generators to support peak load. By integrating proper sized ES with RE, this peak load demand can be minimized and eventually helps to reduces the cost of energy. Therefore storage can be the key enabler to support future load demand especially in peak demand period and to extend the use of RE.
When load demand is low, for example during midday residential load is very low and solar PV produces maximum energy which increases voltage at the PCC and increases load on DT. Energex and Ergon Energy indicated allowable voltage regulation as 240 V ± 6% for phase to neutral and 415 V ± 6% for phase to phase voltage [22]. Ergon Energy photovoltaic planning criteria allows voltage rise due to PV energy at PCC is 1% at 240 V line to neutral voltage [19].
If the installation of PV is not distributed among all phases in a planned way, the load demand and PV generation could lead to voltage unbalance condition among phases. Moreover it could increase the phase voltage beyond the acceptable limit. In a balanced sinusoidal system, the 3 phase-to-neutral voltages are equal in magnitude and phase difference from each other is 120 degree. Any difference in voltage magnitude and/or phase shift results in system unbalanced. According to IEEE-1195 [23], acceptable voltage imbalance in magnitude is 0.5% to 2.0% during steady state operation.
Therefore this study investigates the impacts on DT capacity, voltage rise/drop and unbalances condition due to rooftop PV and finally investigates the same impacts while storage integrated along with the PV system. In order to conduct the investigation a symmetrical scenario was developed in a software model.
3. Model Evaluation
Model was developed considering three groups of residential houses connected to the main (Grid) supply through the DT. Residential houses are connected to the single phase line of DN. Figure 3 shows a road side view of residential electricity connection from the DN in Rockhampton in Queensland, Australia. As mentioned earlier each residential house peak load demand is 1.72 kW or 1.91 kVA considering the power factor as cosφ = 0.9. This model considered 5 such houses are connected in each phase in each node, also considered same load for each house. Therefore 15 houses are connected in each node and total of 45 houses are connected in three nodes from the DT with a total load of 85.95 kVA. It was also considered that 5 such houses installed roof top solar PV in each node and connected to phase-1 in Node-1, phase-2 in Node-2 and phase-3 in Node-3 as shown in Figure 4.
All three nodes are 500 m apart from each other. Model was developed in PSS SINCAL indicating PV connected to the DN through inverter. It was considered that load was uniformly distributed among three phases in each node before installing roof top solar PV. Storage was integrated with the PV integrated loads to improve performance and maximize the use of RE. Other considerations for the model are explained below:
3.1. Load Allocation
The average Australian household electricity use is about 16 kWh/day [24]. Daily household load profile is based on the working nature of the residents and the average
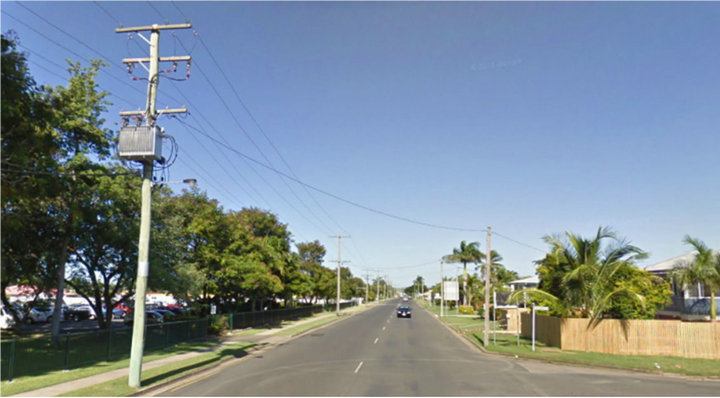
Figure 3. Roadside view of residential load connection from DN.
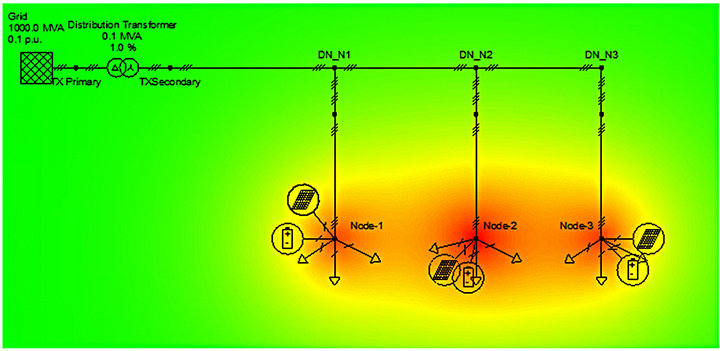
Figure 4. Model shows (load-flow) residential load connection from DN to nodes.
load pattern as shown in Figure 5. In Queensland, Australia, peak demand generally occurs between 4:00 PM to 8:00 PM, when most householders return home and turn on energy intensive appliances [17].
Model considered urban area load with DT (11 kV/415 V) capacity of 100 kVA. LV residential load was considered for unbalanced load flow and time varying load curve analysis. Without PV and storage, DT was 87.22% loaded in peak demand time considering total load and line impedance. Load allocation as shown in Table 1.
3.2. Solar PV and Storage Allocation
Average daily residential load, solar radiation in Rockhampton and allowable PV limit set by local DNSP was considered in selecting the required PV capacity. Ergon Energy, local DNSP in Rockhampton allows 4 kW capacity of PV for each urban area house. Therefore allowed PV capacity is 210% of the peak load demand of 1.72 kW. As the output from PV is not available for 24 hours period and the residential load demand is lowest when PV generates highest energy and the excess energy supplies to the grid eventually increases the voltage at the connected node. In Australia yearly average sunlight hours varies from 5 to 10 hours/day and maximum area is over 8 hours/day [25]. It was found that for the solar radiation and residential load in Rockhampton the required daily PV output should be around 2.05 times the daily load demand considering PV module efficiency of 12.5% and required storage is the same as daily total load demand considering DC system voltage as 24 V [13]. In model, inverter efficiency was considered as 97% and loss until inverter was considered 5%. For this investigation, it was considered that five houses in Node-1 installed 5 kW PV/house in phase-1, similarly 5 houses in Node-2 and 5
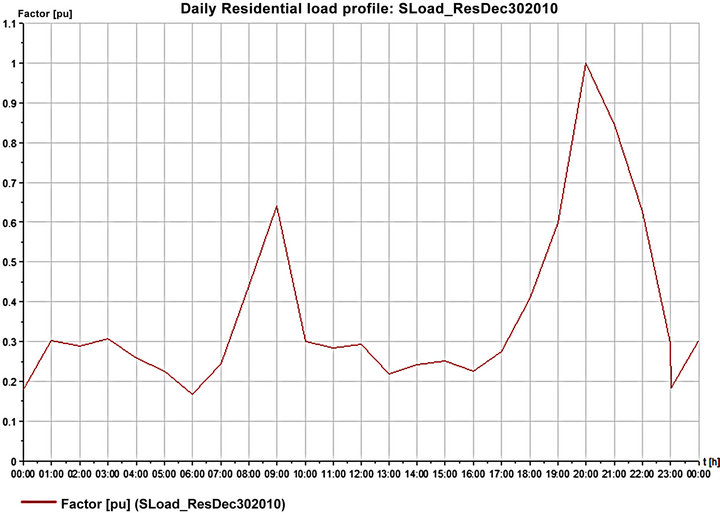
Figure 5. Daily residential summer load profile in Rockhampton [13.14].
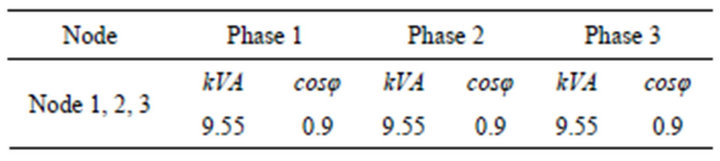
Table 1. Load allocation in three nodes.
houses in Node-3. It was considered that storage was installed with the same peak capacity of load which is 1.72 kW in each house where solar PV was installed. Tables 2
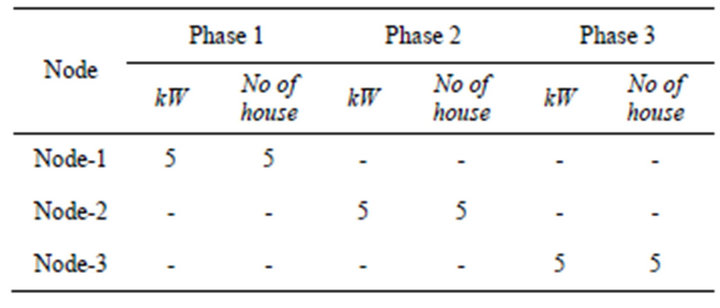
Table 2. Installed solar PV in different nodes.
and 3 shows the installed PV and storage in different nodes.
Based on allocated load, the daily utilization of DT is shown in the Figure 6 and the peak utilization is 87.22% of DT capacity at the time of 20:00 PM.
Solar PV was added to phase-1 in Node-1 and summer time solar radiation in Rockhampton was considered. Daily solar radiation data of Rockhampton was collected from [25] and daily profile is as shown in Figure 7. However due to cloud movement energy level received by the PV array fluctuates. Figure 8 shows short fluctuation due to continuously varying short interval cloud movement, Figure 9 shows dip fluctuation for short period and Figure 10 shows the dip fluctuation for longer
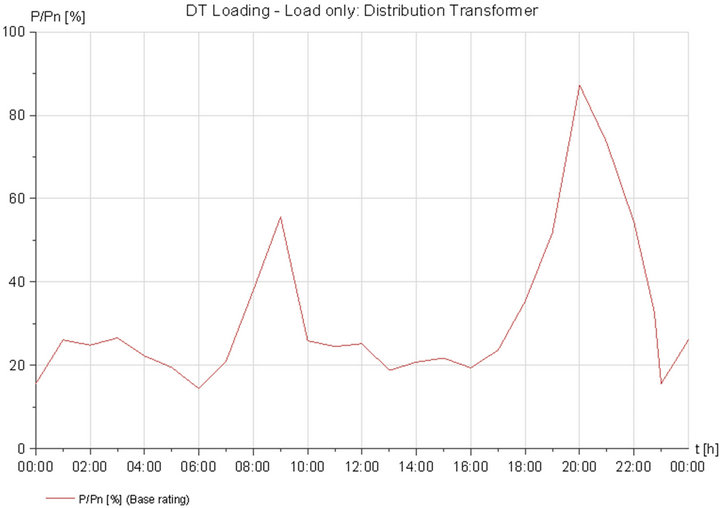
Figure 6. Distribution transformer loading due to load only.
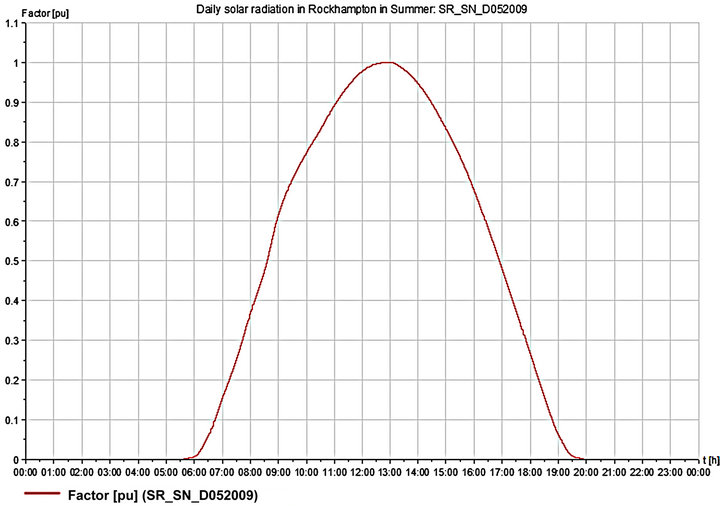
Figure 7. Daily solar radiation profile in Rockhampton, Australia.
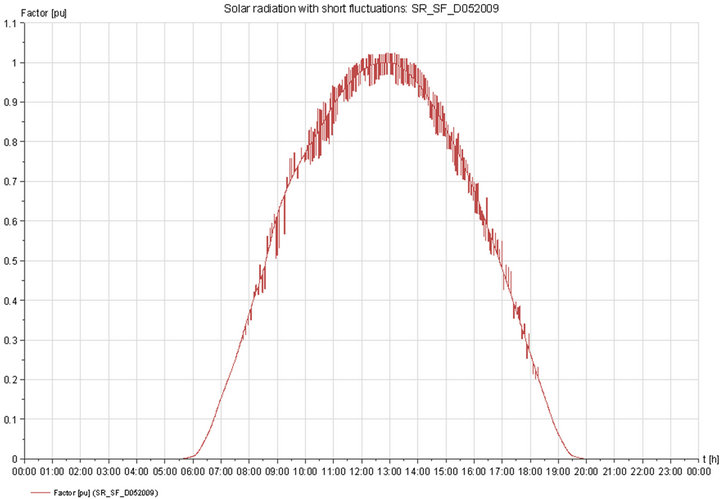
Figure 8. Solar radiation with continuous short fluctuation.
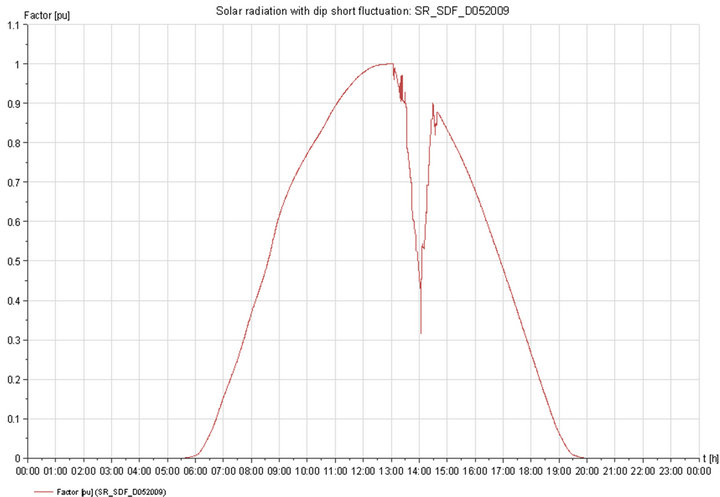
Figure 9. Solar radiation with short deep fluctuation.
period. These fluctuating solar radiations was considered in the model to investigate the response from the storage.
Model was simulated for load flow (LF) and load curve (LC) analysis. LF is an effective tool for calculat-
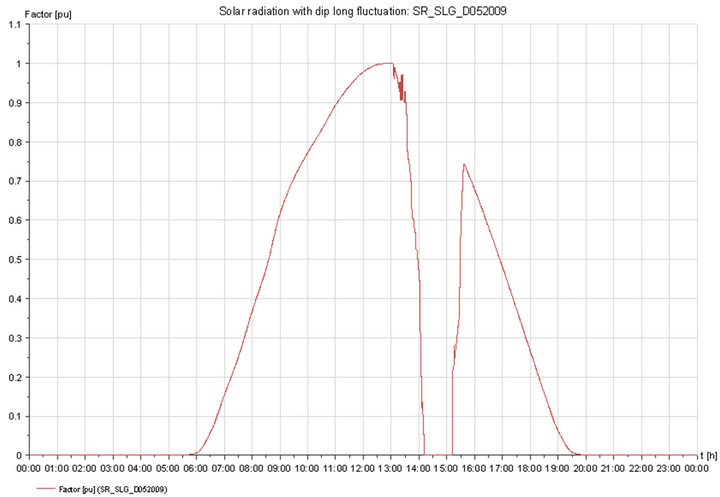
Figure 10. Solar radiation with long deep fluctuation.
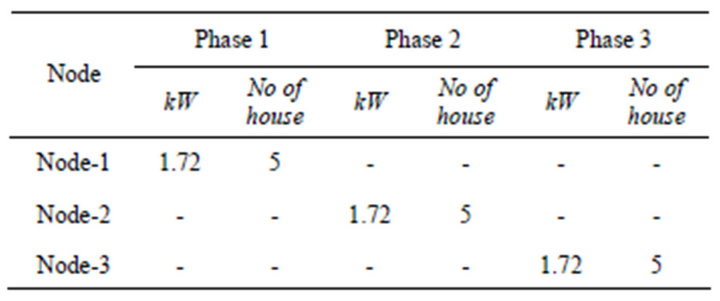
Table 3. Installed storage in different nodes.
ing the operational behavior of electrical transmission and distribution network. LF calculates current and voltage distribution from generation to the consumer on rated power or voltage at the node elements. LC is a load flow calculations with load values varied over time. The investigation was done in the following seven case configurations as shown in Table 4 with PV and storage in different nodes and the findings are shown in the result section.
4. Results and Discussions
The model was simulated to evaluate the impacts of storage on DT and DN. LF simulation was done in investigating the voltage regulation on the LV side of DT while LC simulation was done in investigating the loading on DT and fluctuation handling capability of storage. The investigation identified the impacts of storage in DT
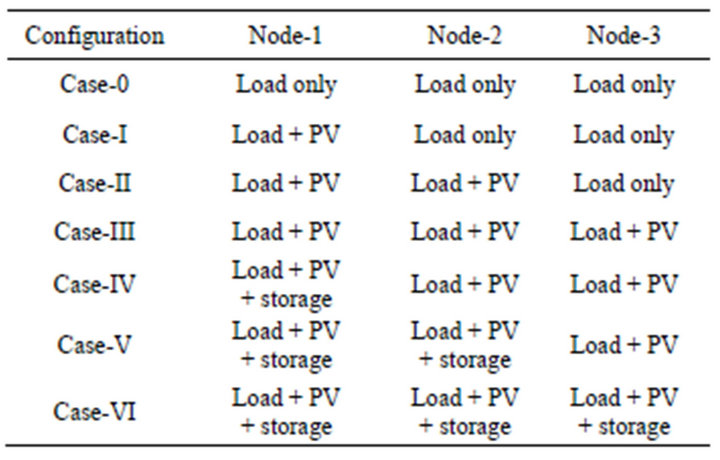
Table 4. Model simulation configurations.
loading, voltage regulation and managing energy fluctuations generated by the PV output. The findings are summarized below.
4.1. Loading on Distribution Transformer
It was found from LC simulation that PV increases the DT loading during day time (especially at 13:00 PM) when load demand was low and when storage was not integrated with the system. However maximum loading was at 20:00 PM when residential load demand is highest and when PV was not able to support the load therefore maximum load on DT remains 87.22% as shown in Figure 11. After integrating PV in all 3 nodes, three phases in 3 nodes becomes balanced in loading and supports the load in the morning which lowers the DT loading in the morning at 08:00 AM and afternoon at 18:00 PM as shown in Figure 11. However PV increases DT loading during midday (52.06% at 13:00 PM) between 10:00 AM to 16:00 PM also peak load in the evening remains same as 87.22%.
However, after adding storage only in Node-1 and connected to phase-1, storage supports the phase-1 load although which was not enough compared to the total load on phase-1, therefore it was not reflected on overall DT loading. By adding storage in Node-2 and connecting to phase-2 load, it was found that maximum/peak loading on DT now reduced to 80.51% moreover midday loading also reduced to ~42% at 13:00 PM. Gradually storage was added in phase-3 in Node-3 and found that loading on DT reduced not only during midday but also in peak demand time in the evening. Figure 12 shows the charging and discharging period of storage connected in phase-3 in Node-3.
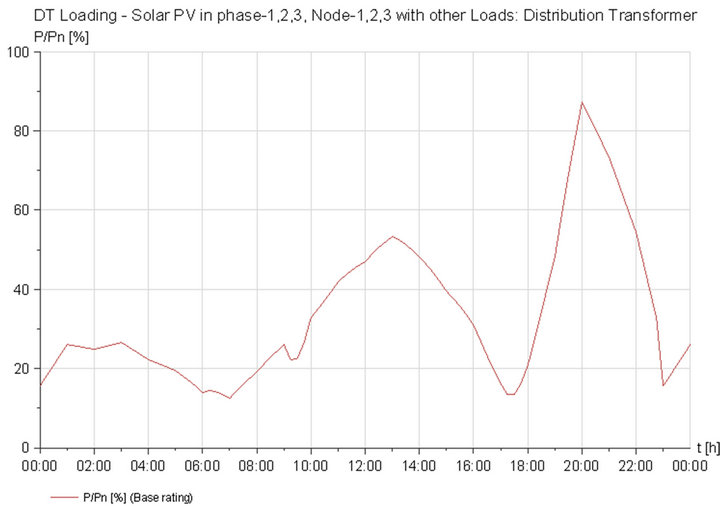
Figure 11. DT loading due to PV in all 3 phases.
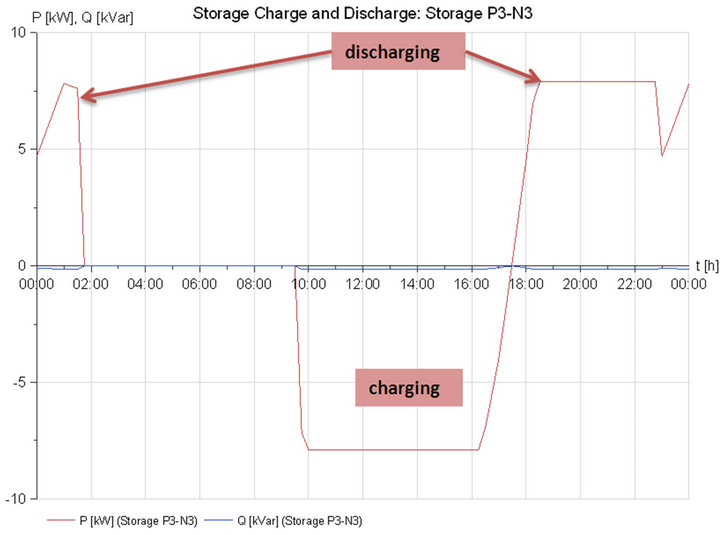
Figure 12. Charging/discharging of storage in Node-3.
After adding storage in all three phases it was found that maximum or peak time loading reduced to 66.76% as shown in Figure 13 which is a great improvement in RE utilization and also reduces the risk of changing/upgrading the DT capacity. Moreover storage also reduces the load on DT during day time when residential load demand is low particularly during 10:00 AM to 16:00 PM and during this time maximum loading reduced to ~30% of DT capacity at 13:00 PM.
4.2. Voltage Regulation on LV Side of DT
The load flow modeling of unbalanced system shows that voltage level gradually drops from source (Grid point) to the end load. Figure 14 is the surface plot of phase voltages with 0.5 volt interval and shows how the voltage level changes with load, PV and storage in different cases from LV side of transformer (Tx secondary) to the end node (Node-3). Case-0 shows gradual voltage drop due to load, case-I to case-III shows change in phase voltage due to PV but from case-IV to case-VI shows stable voltage in all phases after adding storage.
In six different case configurations it was observed that PV increases the phase voltages and changes phase angles which increase the risk of phase unbalance. Phase-1 voltage (V1) increases after adding PV in phase-1 in case-I, similarly PV in phase-2 and phase-3.
However, introduction of storage in case-IV, V and VI shows that storage keeps the phase voltage stable as shown in Figures 15-17. Figure 15 shows the percentage change in phase-1 voltage (V1), Figure 16 shows percentage change in phase-2 voltage (V2) and Figure17 Shows percentage change in phase-3 voltage (V3) in different case configurations Phase unbalance condition was observed after adding PV and/or storage in one phase and found that voltage and
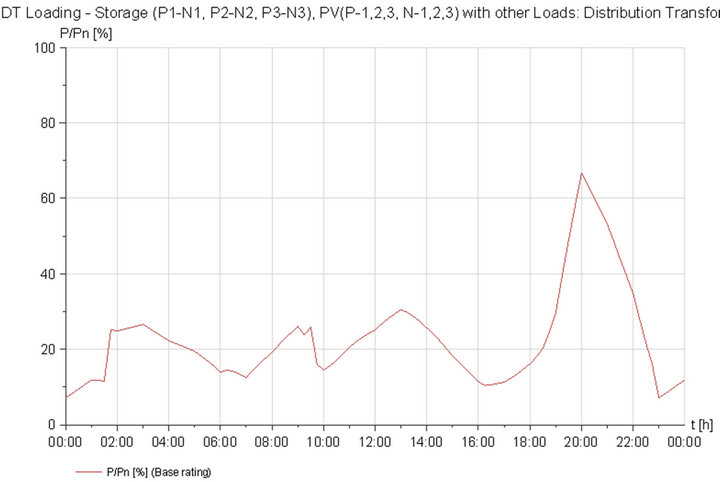
Figure 13. DT loading after adding storage in all 3 phases.
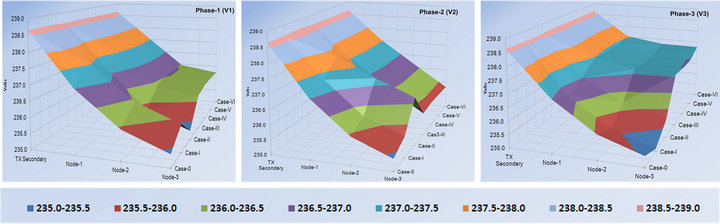
Figure 14. Surface plot of voltage change in 3 phases in different case configurations.
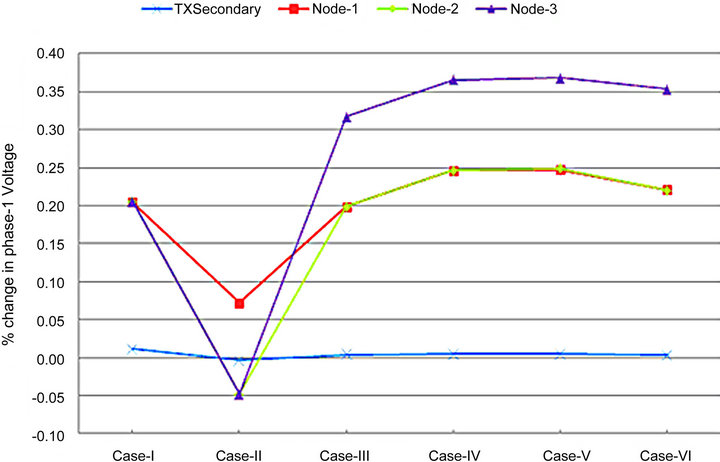
Figure 15. Percentage voltage change in phase-1.
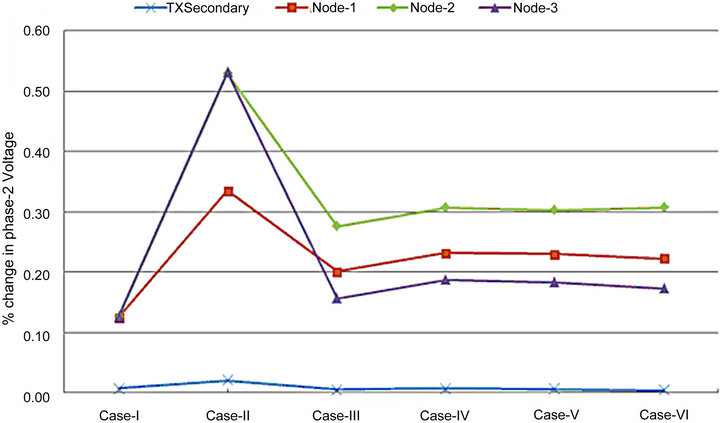
Figure 16. Percentage voltage change in phase-2.
phase angle increases with such installation. Table 5 shows the result after adding PV and storage only in phase-3 in Node-3.
4.3. Storage Impacts during Solar Fluctuations
Cloud movement or various natural conditions could change the solar radiation profile from ideal type to solar radiation with short fluctuation, short deep fluctuation and long deep fluctuation as shown earlier in Figures 8-10. Due to these fluctuations in solar radiation, storage sup-
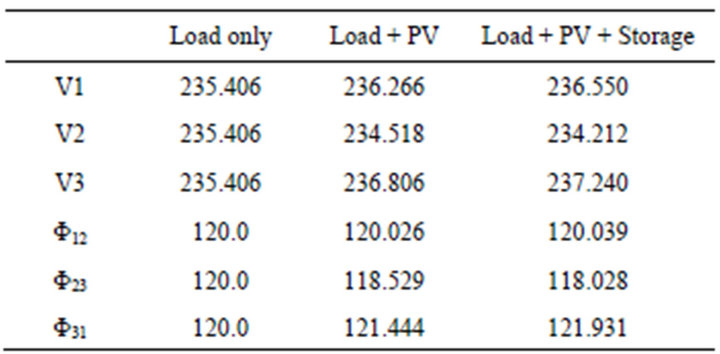
Table 5. Phase voltage and angle in Node-3.
port the load and DT loading with storage integrated condition (Case-VI) as shown in Figures 18-20 respectively.
During short fluctuation in solar radiation, PV output also fluctuates and storage supports the load when the PV output reaches below the load demand. Figures 21-23 show the storage charge by PV output and discharge to support the load while PV output fluctuates due to short, short deep and long deep fluctuations in solar radiation. Short deep fluctuation interrupts storage charging for short
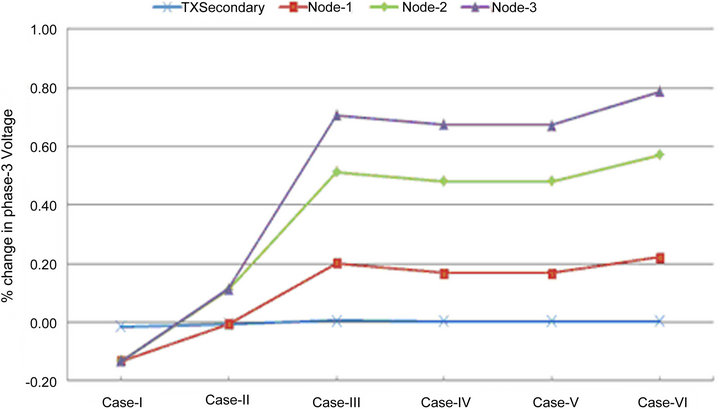
Figure 17. Percentage voltage change in phase-3.
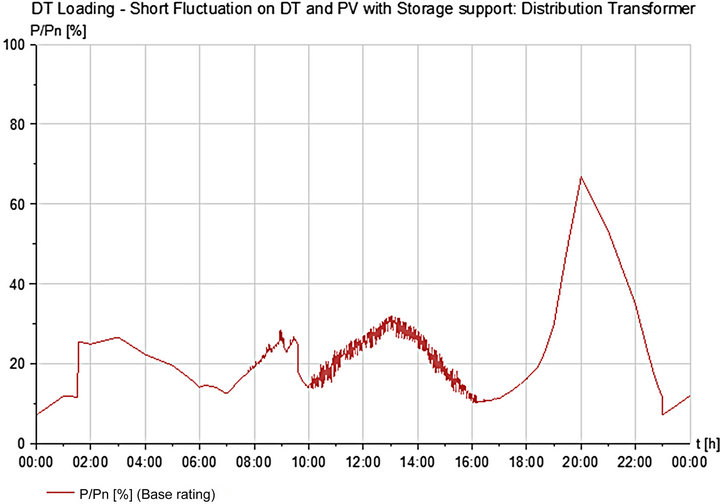
Figure 18. DT loading-PV & Storage integrated when solar radiation continuously fluctuates.
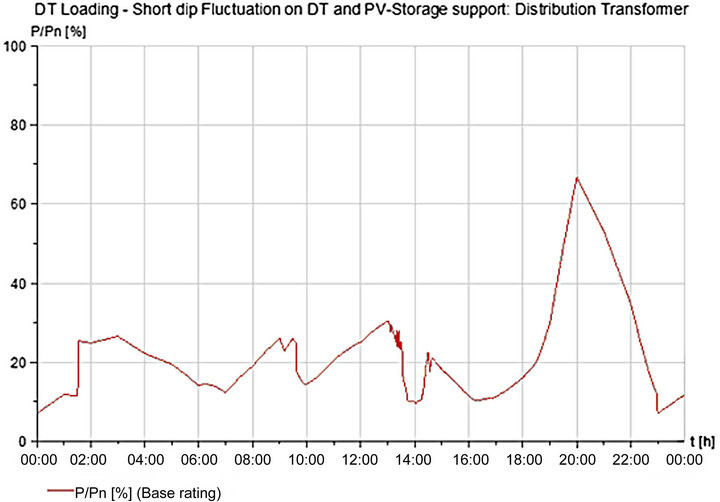
Figure 19. DT loading-PV with storage while solar radiation has short deep fluctuation.
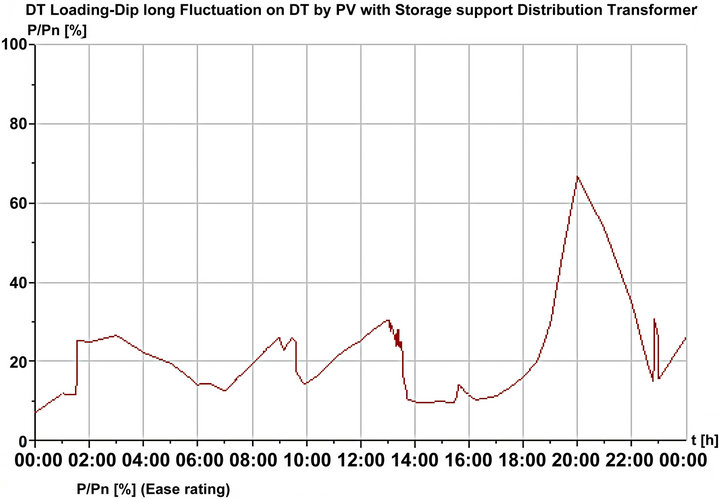
Figure 20. DT loading-PV with storage while solar radiation has short deep fluctuation.
time. Figure 23 shows the storage charge by PV output and discharge to support the load while PV output being fluctuates due to long deep fluctuations in solar radiation. While the PV output interrupts for long time storage connected in 3 nodes in 3 phases also supports the load by discharging stored electricity as shown in Figure 23.
Therefore it is evident from this investigation that, storage effectively reduces the load on DT, improves voltage regulations and supports the load when RE generation fluctuates and reaches lower than the load demand.
5. Conclusions
Energy storage is the key enabler in reliable utilization of RE. This paper investigates how grid connected solar PV and storage behaves with residential load. Investigation
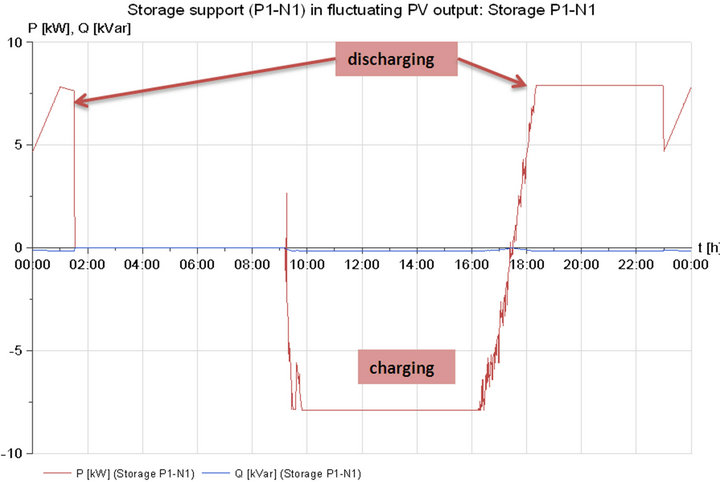
Figure 21. Storage support load when PV output fluctuates.
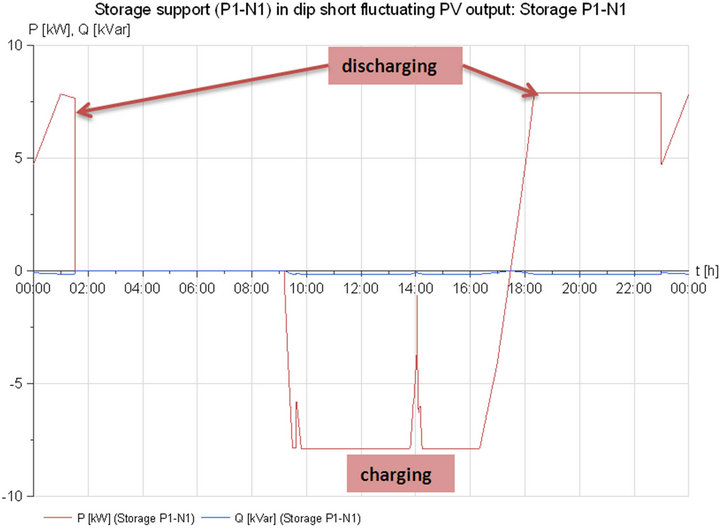
Figure 22. Storage support load when PV output has short deep fluctuation.
was done considering symmetrically distributed residential load on three different nodes from a DT. It was found after adding PV on different phases in different nodes that PV increases load on DT when it is generating maximum energy, however fails to support the load during peak demand time in the evening. PV increases phase voltages while connecting PV in different nodes and also changes the phase angle between phases which can lead
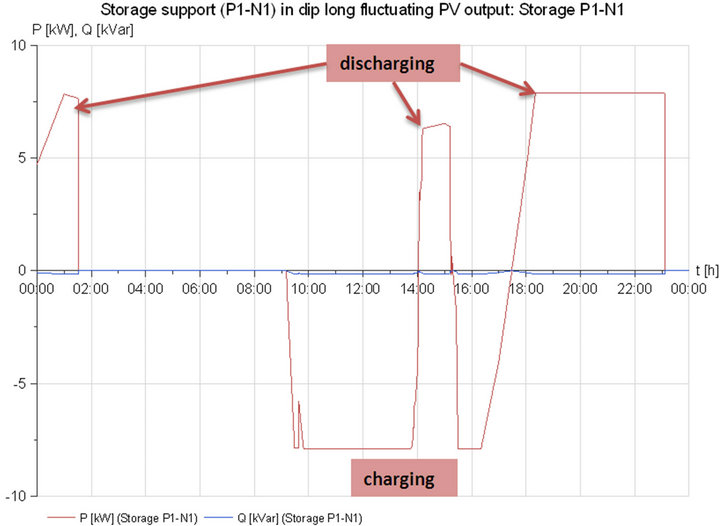
Figure 23. Storage support load when PV output has long deep fluctuation.
to the unbalanced conditions. Moreover fluctuating PV output induces fluctuations to the grid power and introduces power interruption for long deep solar fluctuation situation. After adding storage with the PV integrated loads in different nodes it was found that loading on DT reduces when storage stores excess energy during maximum generation time of PV. It was found that storage reduces more than 20% DT loading at peak demand time by releasing stored energy to support the load demand. Storage improves the voltage regulation by minimizing the unbalanced situation introduced by the PV. Moreover, storage reduces fluctuations from the PV and supports the load when fluctuation or interruptions fall into the load demand time. Therefore the investigation clearly showed the storage impacts on DT and DN by improving the loading on DT, stabilizing voltage regulation and reducing fluctuations introduced by the solar PV, accordingly storage helps in increasing PV utilization.
This study investigates considering only one DT and its associated loads in three phases. Moreover PV and storage was also not integrated with all loads therefore the impacts shown from this investigation can be a major concern for the future in large scale such integration into the grid. This study indicates the future scope of research with larger network and with various load profiles.
REFERENCES
- Y. Guo, D. J. Hill and Y. Y. Wang, “Global Transient Stability and Voltage Regulation for Power Systems,” IEEE Transactions on Power Systems, Vol. 16, No. 4, 2001, pp. 678-688. doi:10.1109/59.962413
- J. D. Glover, M. S. Sarma and T. J. Overbye, “Power System Analysis and Design,” 4th Edition, Thompson Corporation, Stamford, 2008, p. 255.
- ABARE, “Energy in Australia 2010,” Australian Bureau of Agricultural and Resource Economics and Sciences, Department of Resources, Energy and Tourism, Australia, 2010. http://www.daff.gov.au/abares/publications_remote_content/publication_series/energy_in_australia?sq_content_src=%2BdXJsPWh0dHAlM0ElMkYlMkYxNDMuMTg4LjE3LjIwJTJGYW5yZGwlMkZEQUZGU2VydmljZSUyRmRpc3BsYXkucGhwJTNGZmlkJTNEcGVfYWJhcmVicnM5OTAxNDQ0NF8xMmEueG1sJmFsbD0x
- Queensland-Government, “The Queensland Renewable Energy Plan, a Clear Energy Future for Queensland,” 2009. http://www.cleanenergy.qld.gov.au/queensland_renewable_energy_plan.cfm
- E. Caamaño, D. Suna, J. Thornycroft, S. Cobben, M. Elswijk, B. Gaiddon, T. Erge and H. Laukamp, “Utilities Experience and Perception of PV Distributed Generation,” 2007. http://www.pvupscale.org/IMG/pdf/WP4_D4-2_Utilities-Experience-PVDG_v5.pdf
- Y. Makarov, P. Du, M. C. W. Kintner-Meyer, C. Jin and H. Illian, “Optimal Size of Energy Storage to Accommodate High Penetration of Renewable Resources in WECC System,” Innovative Smart Grid Technologies (ISGT), 19-21 January 2010, pp. 1-5.
- A. A. Solomon, D. Faiman and G. Meron, “Properties and Uses of Storage for Enhancing the Grid Penetration of very Large Photovoltaic Systems,” Energy Policy, Vol. 38, No. 9, 2010, pp. 5208-5222. doi:10.1016/j.enpol.2010.05.006
- Ergon Energy, “Distribution Feeder Database 2010,” Collected Information from Ergon Energy, 2010.
- Ergon Energy, “Network Configuration Diagram,” 2012. http://www.ergon.com.au/about-us/the-electricity-industry/electricity-distribution-pricing-methodologies/distribution-loss-factor-calculation-methodology#content-id-4876
- ActewAGL, “ActewAGL Guidelines for Grid-Connected Photovoltaic Installations via Inverter,” 2009.
- R. H. M. Akatsuka, H. Kita, T. Ito, Y. Ueda and Y. Saito, “Estimation of Battery Capacity for Suppression of PV Power Plant Output Fluctuation,” 35th IEEE Photovoltaic Specialists Conference (PVSC), 20-25 June 2010, pp. 000540-000543.
- Queensland-Government, “Distributed Generation,” Department of Energy and Water Supply, 2012. http://www.cleanenergy.qld.gov.au/distributed-generation/default.htm
- M. T. Arif, A. M. T. Oo and A. B. M. S. Ali, “Estimation of Required Storage System for Solar PV and Wind Energy and Feasibility Analysis of Storage Systems,” A. Zobaa, Ed., 2013. http://www.intechopen.com/books/energy-storage-technologies-and-applications/estimation-of-energy-storage-and-its-feasibility-analysis
- M. T. Arif, A. M. T. Oo and A. B. M. S. Ali, “Investigation of Energy Storage Required for Various Location in Australia,” Central Queensland Regional Engineering Conference 2012, Queensland, 10-11 August 2012.
- H. Nfaoui, J. Buret, A. A. M. Sayigh and P. D. Dunn, “Modelling of a Wind/Diesel System with Battery Storage for Tangiers, Morocco,” Renew Energy, Vol. 4, No. 2, 1994, pp. 155-167. doi:10.1016/0960-1481(94)90001-9
- A. Zahedi, “Technical Analysis of Electric Power System Consisting of Solar PV Energy, Wind Power and Hydrogen Fuel Cell,” Australasian Universities Power Engineering Conference (AUPEC 2007), Perth, 9-12 December 2007, pp. 1-5.
- “Queensland Energy Management Plan,” Department of Employment, Economic Development and Innovation, Queensland Government, 2011. http://rti.cabinet.qld.gov.au/documents/2011/may/qld%20energy%20management%20plan/Attachments/Qld%20En ergy%20Mgt%20Plan.pdf
- Origin Energy, “Household Peak Demand,” 2012. http://www.originenergy.com.au/3404/Mt-Stuart-Power-Station
- A. Thomas, “Photovoltaic Planning Criteria, Network Planning and Development Distribution Planning and Capability, Ergon Energy, Australia,” Technical Note, 2011.
- IEEE, “IEEE STD 1547-2003, IEEE Standard for Interconnecting Distributed Resources with Electric Power Systems,” Standard, 2003, pp. 1-16.
- Standard Australia, “AS 4777.1-2005, Grid Connection of Energy Systems via Inverters, Part 1: Installation Requirements,” 2005. http://www.saiglobal.com
- “Network Standard, Standard for Network Performance, Joint standard between ENERGEX and Ergon Energy,” Standard.
- IEEE and Standards, “IEEE STD 1159-1995, IEEE Recommended practice for Monitoring Electric Power Quality,” Standard, 1995.
- Energy Matters, “Average Household Electricity Consumption per Day in Australia,” 2012. http://www.energymatters.com.au/climate-data/grid-electricity-usage.php
- Bureau of Meteorology, “Weather Data,” Bureau of Meteorology, Australian Government, 2011. http://reg.bom.gov.au/