Smart Grid and Renewable Energy
Vol.2 No.4(2011), Article ID:8281,10 pages DOI:10.4236/sgre.2011.24048
Potential of Natural Ventilation in Mexico According to Its Hours of Hygrothermal Comfort
![]()
Department of Mechanics and Energy, Institute of Engineering, National Autonomous University of Mexico, Mexico City, Mexico.
Email: *iop@civil.aau.dk, damg@pumas.iingen.unam.mx
Received July 5th, 2011; revised August 10th, 2011; accepted August 17th, 2011.
Keywords: Natural Ventilation, Energy Saving Factor, Geographic Feasibility, Energy Saving
ABSTRACT
This work shows, through monthly maps, the potential of natural ventilation in order to cool down buildings in the different climatic regions of Mexico. By using the method of energy evaluation of buildings in Brazil applied to Mexico, a monthly electric-power saving factor is calculated to use natural ventilation for the forty-three biggest cities of the country according to their hours of hygrothermal comfort. Then, with the Geographical Information System Map Maker, monthly maps were created from the potentials of saving for the Mexican territory. Then, energetic, economic and environmental benefits were estimated for year 2006, in comparison to the realistic energy consumption in the same year.
1. Introduction
The study of natural ventilation has been gradually growing during the last years because human being has known, with the right conditions, the great benefits for ventilating a building in terms of health, comfort and welfare [1]; also, there are big savings of energy and money by avoiding or by reducing mechanical ventilation and artificial systems of air-conditioning, especially in warm regions [2].
For doing good natural ventilation it needs to know climatic and atmospheric conditions of every place to analyze [3]. Also, it is necessary to do a well-done design for the building considering the needs of the occupants and the outside conditions [4].
Although the study of natural ventilation within buildings can be described for general equations [5], as every building in Mexico has particular needs of acclimatization, it was made an atlas with recommendations for buildings of the 43 main cities in the country depending on wind characteristics, climate conditions etc. [6], and that is reflected on the maps of this document. Also, in this work the potential of introducing natural ventilation as a passive system of acclimatization instead air-conditioning in Mexico has been analyzed. The geographic feasibility for that and the calculated energetic, economic and environmental benefit is shown as well.
2. Methodology
For getting the energy saving factor by using natural ventilation in a building is necessary to build a mathematical model which simulates with the different elements and parameters to measure the amount of heat that is expelled by flow of air.
In this case, the mathematical model characterized from the energy saving of buildings used in Brazil was taken [7] and adapted to Mexico, and with it, an energy saving factor was calculated for different cities of Mexico in different climatic regions.
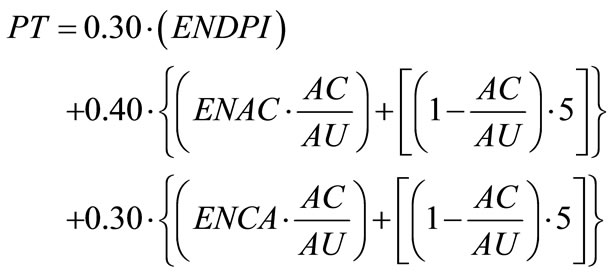 (1)
(1)
The second term of the Equation (1) analyzes the energetic efficiency of a building by its air-conditioning, and has a value of 40% in the complete equation. ENAC means the efficiency of air-conditioning within the building. The first term refers to the envelopment and it has a value of 30% in the overall evaluation, ENDPI is the efficiency of the envelopment according to the relationship between heat gains and heat loses by convection heat transfer. The third term refers to illumination and it has a value of 30%. ENCA refers to the efficiency that the artificial lights have within the building [7]. As the three terms are independent from each other, the energetic efficiency by air-conditioning is separated.
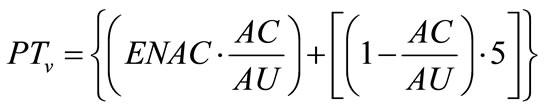 (2)
(2)
In this document, two mathematical facts were found: the energetic efficiency by using natural ventilation is equal to the energy saving; and the factor denominated AC/AU, which means the relationship between the conditioned zone and the used one, is about equal to the relationship between the comfort hours and the occupied hours within a building.
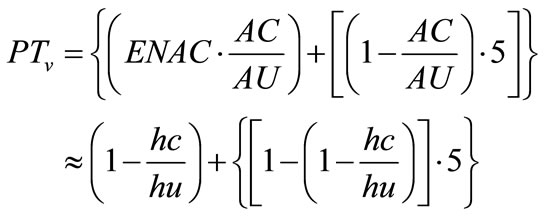 (3)
(3)
Therefore, an energy saving factor Pv, is found
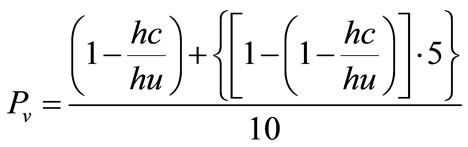 (4)
(4)
Because of the climatic regions in Mexico are warm, the non-comfort hours are standardized to warm hours, which need to take out the heat somehow [8].
For a general case, the occupied hours within the buildings were the 24 hours of the day; this is that building must be cooled (passively or actively) all day long.
Thus, Pv is multiplied by the energy consumption by air-conditioned, in kWh, then, the energy saving is found.
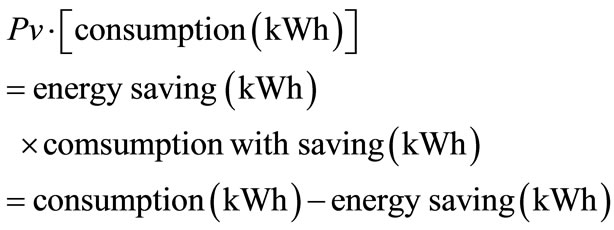 (5)
(5)
3. Results
3.1. Atlas of Natural Ventilation in Mexico
With equation (4) the energy saving factors were calculated for the 43 main Mexican cities in function of their monthly comfort hours [9]. With this, maps were drawn, showing Pv in Mexico. These maps were made from the 43 vector points that represent the 43 main cities in the country, and then were drawn for their respective climatic region [10]. Regions have been clustered in three groups: with Pv from 0.10 to 0.19 (low saving), from 0.20 to 0.29 (medium saving) and from 0.30 to 0.49 (high saving).
Figures 1-12 show the geographic feasibility for the potential of introducing natural ventilation as a passive system of acclimatization instead air-conditioning in Mexico.
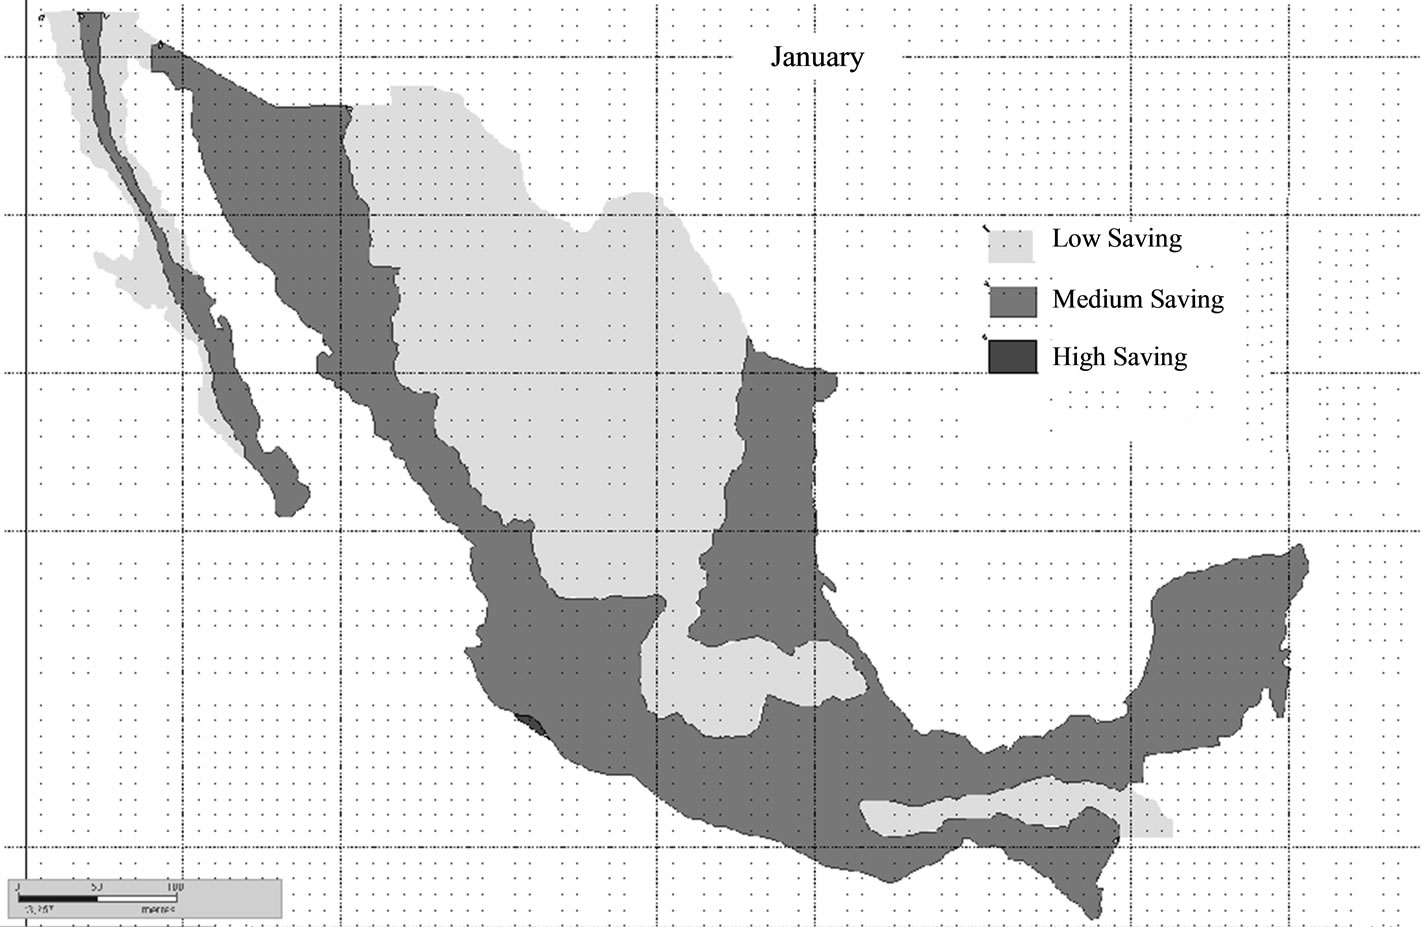
Figure 1. Saving factor, Pv for January.
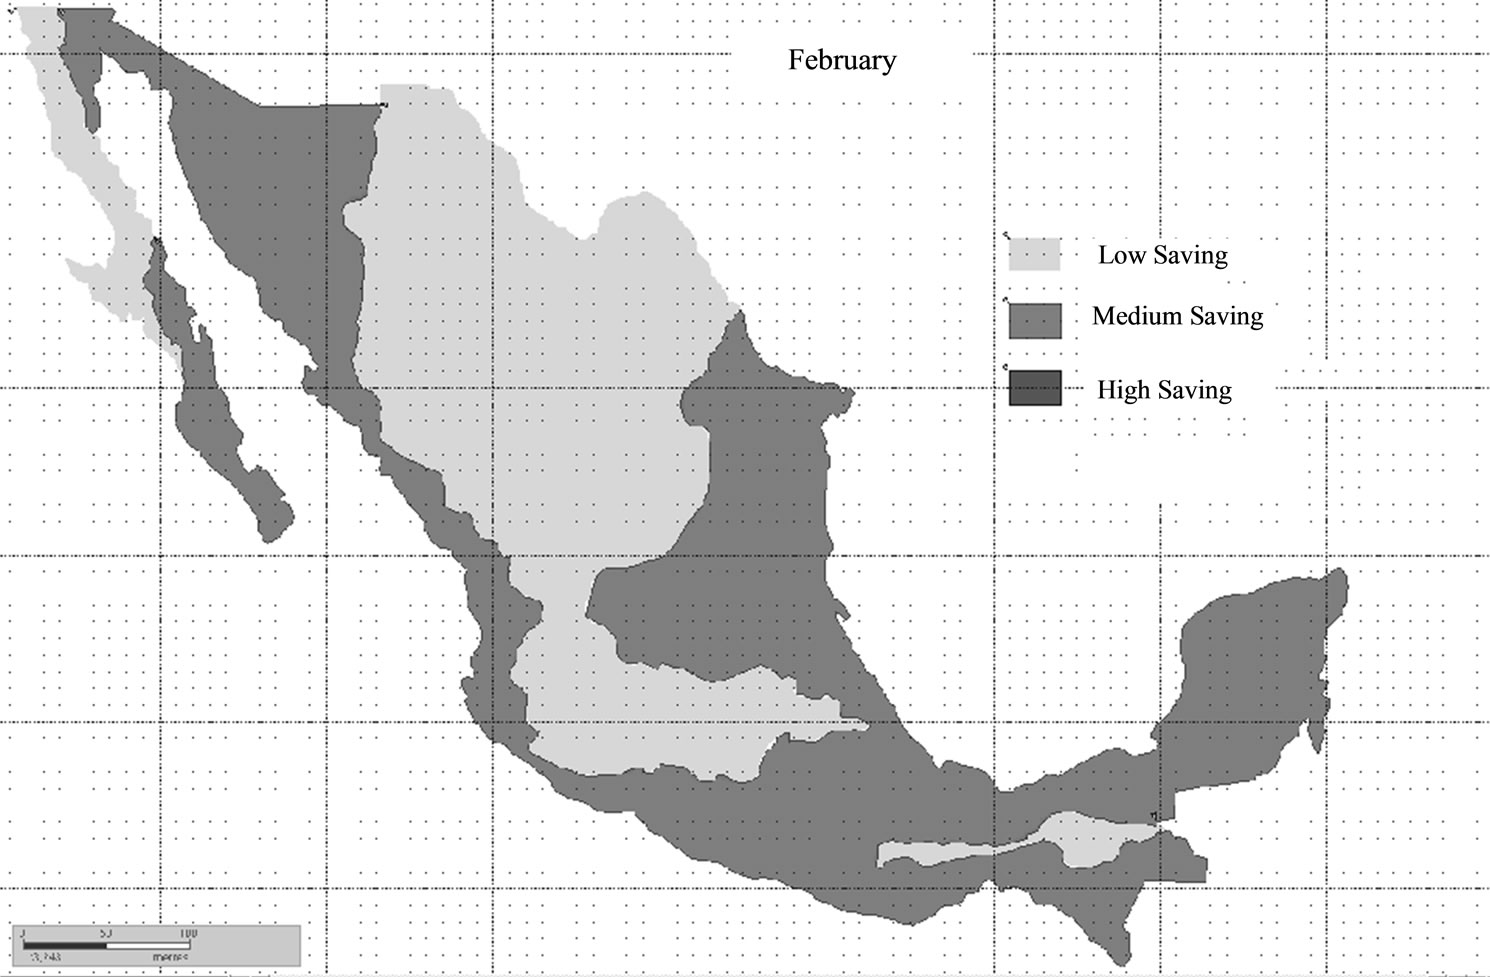
Figure 2. Saving factor, Pv for February.
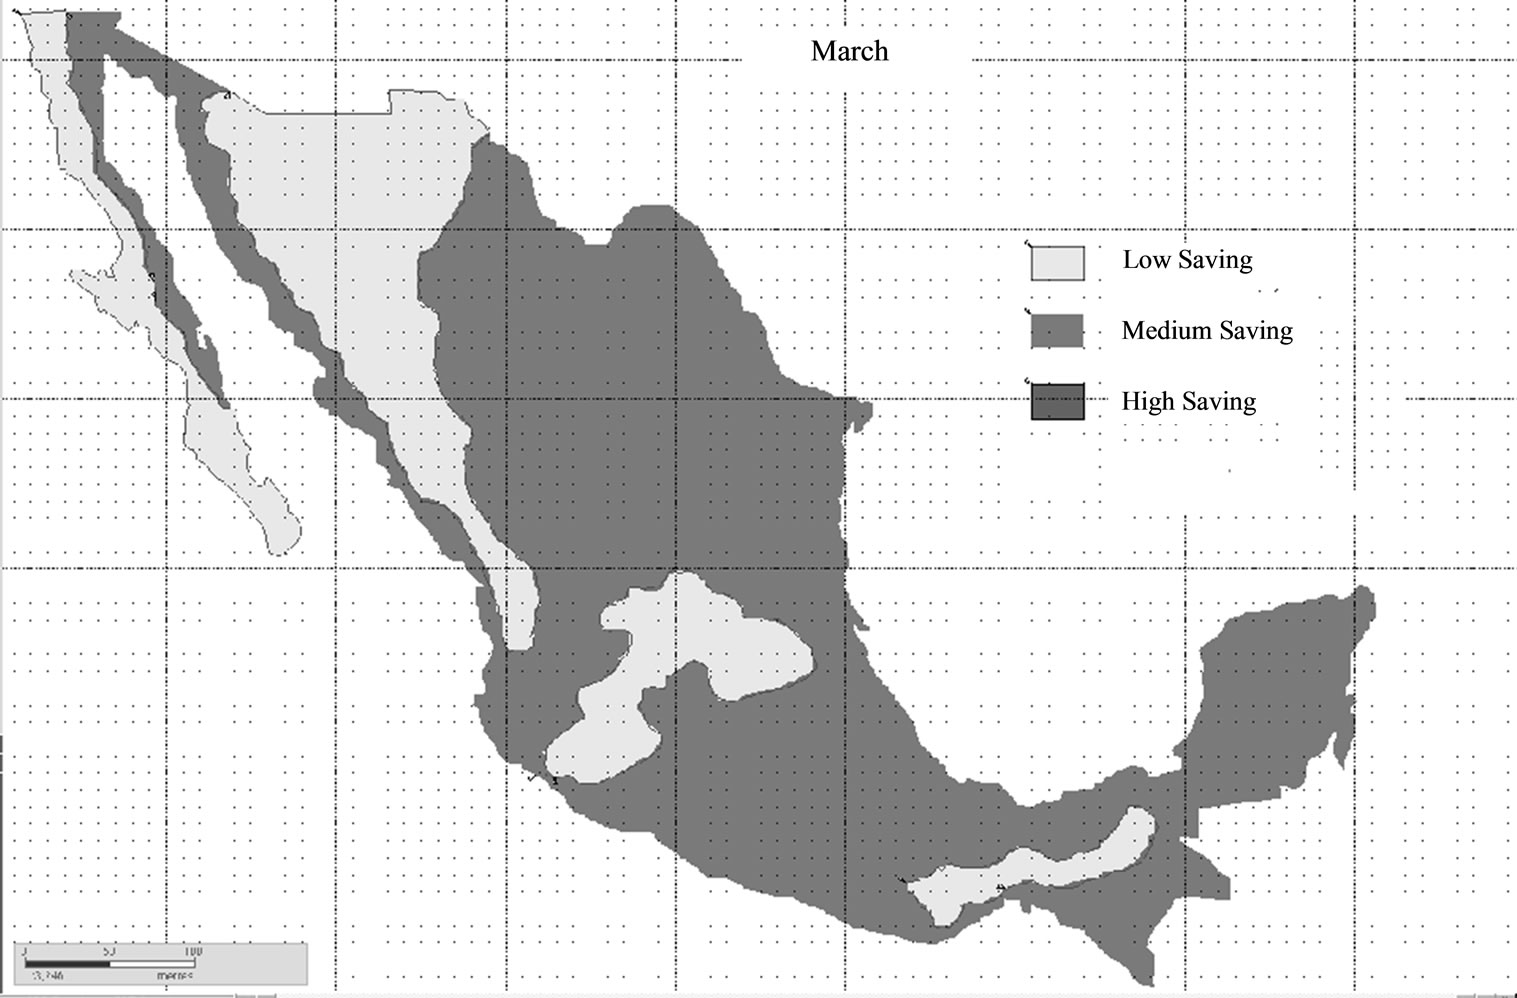
Figure 3. Saving factor, Pv for March.
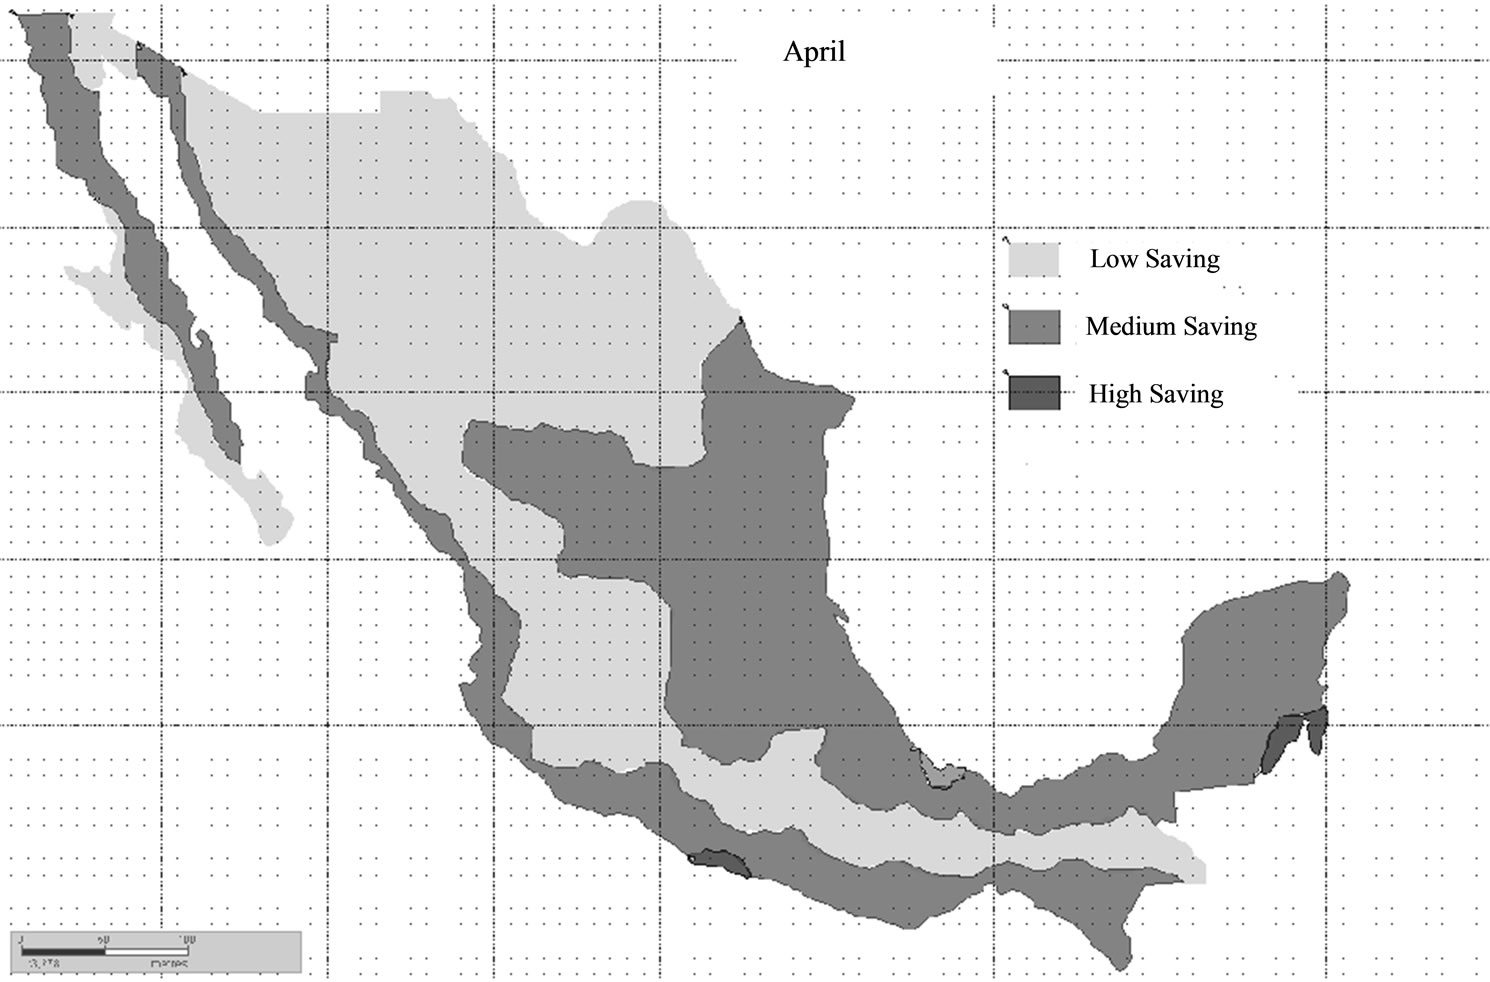
Figure 4. Saving factor, Pv for April.

Figure 5. Saving factor, Pv for May.
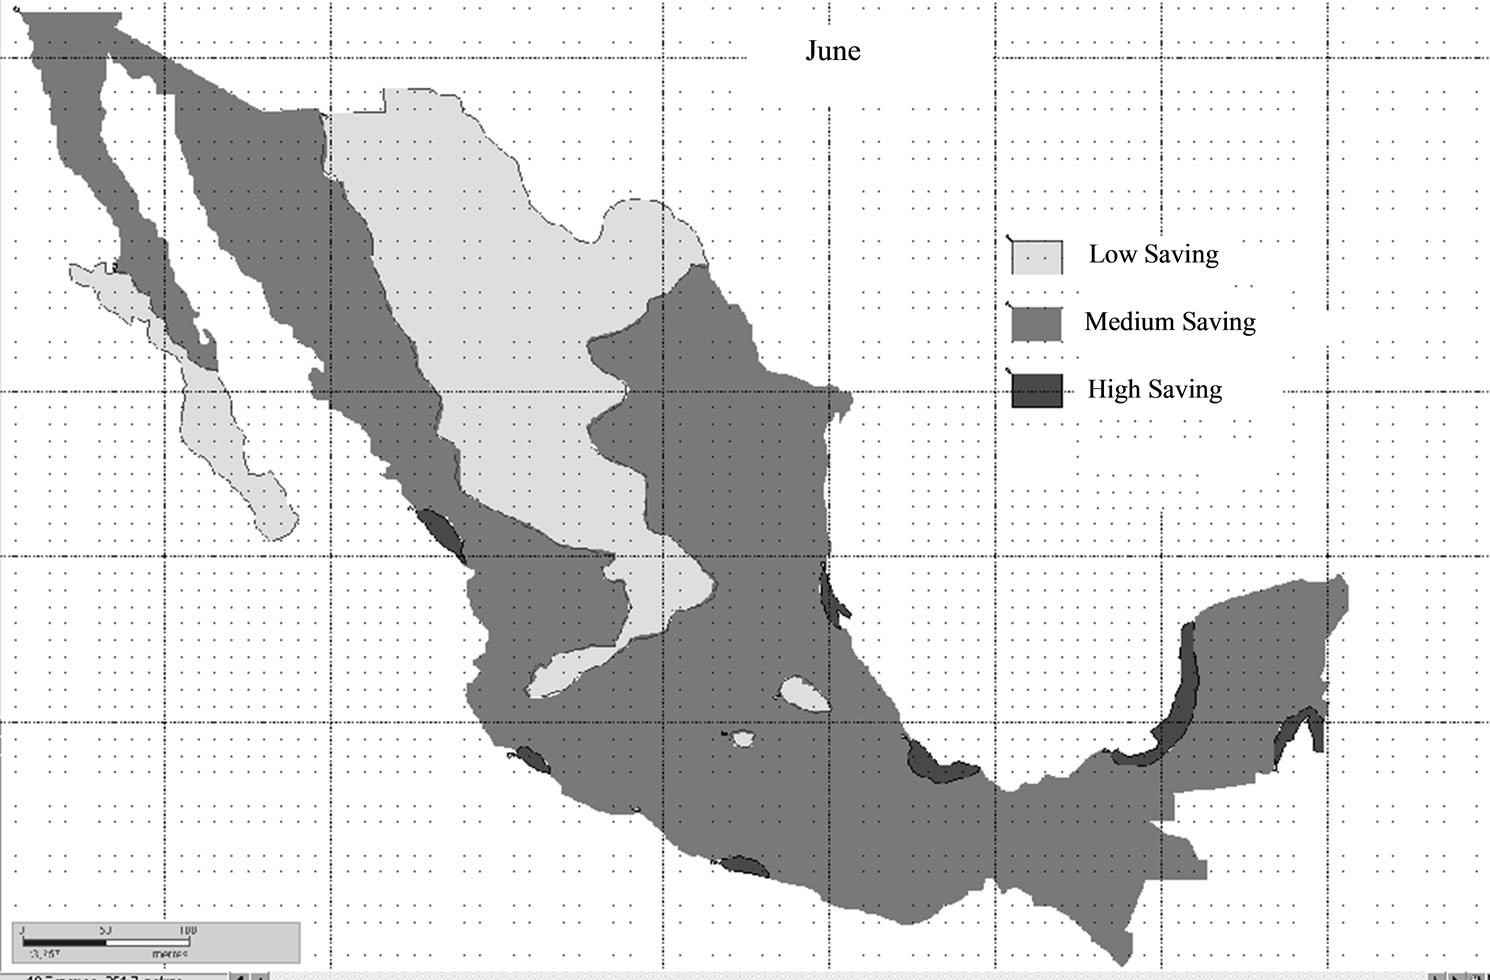
Figure 6. Saving factor, Pv for June.
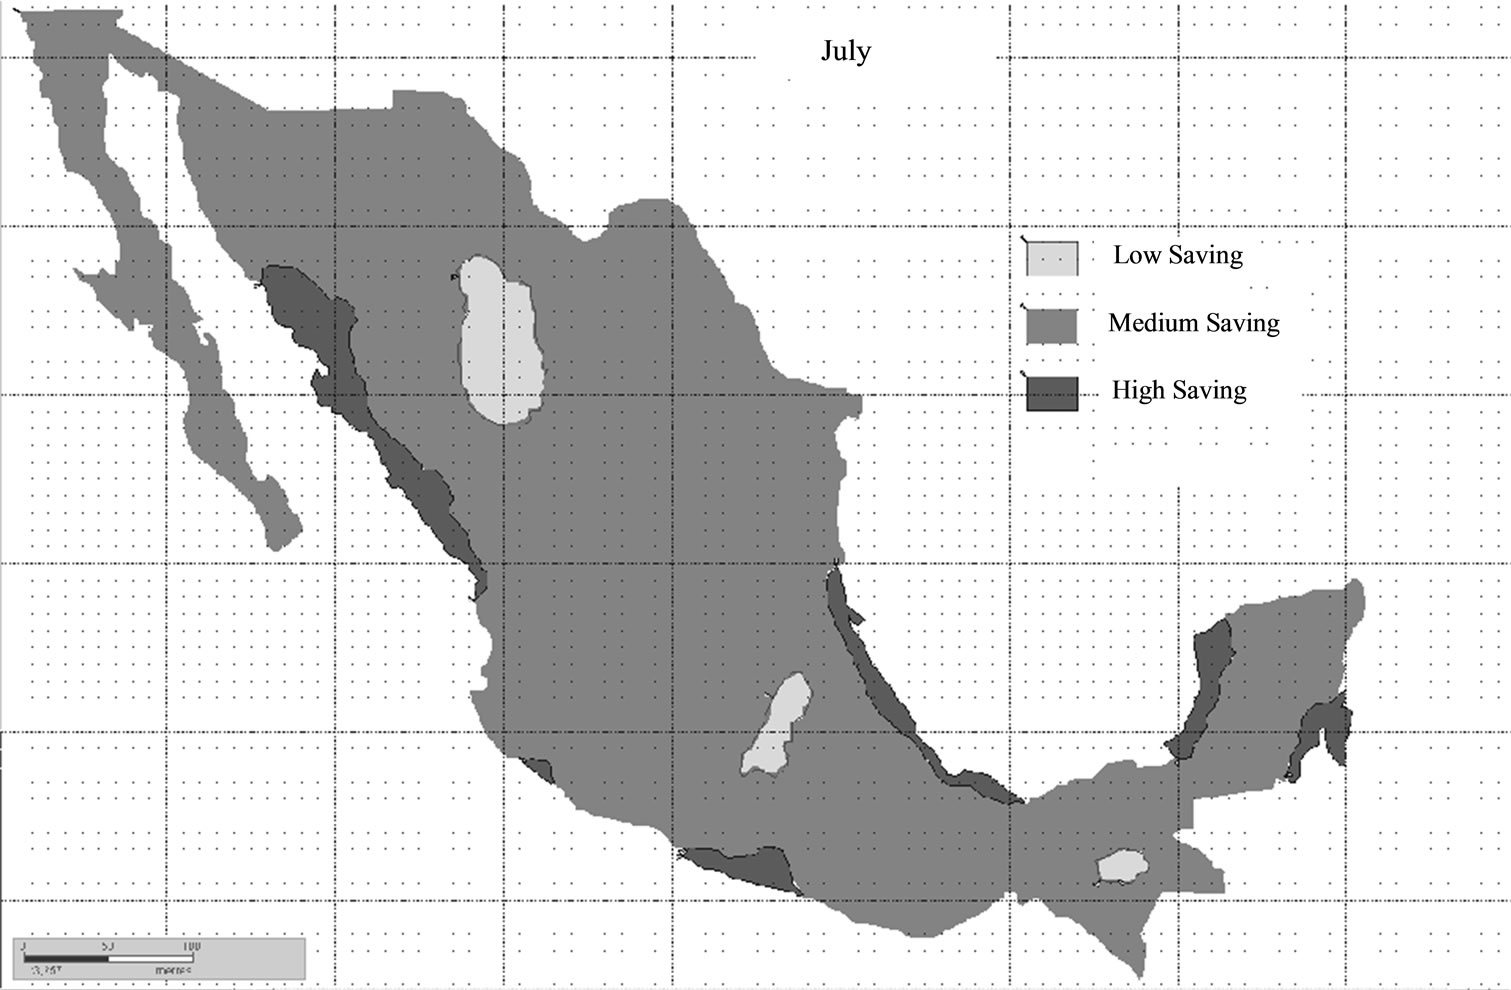
Figure 7. Saving factor, Pv for July.

Figure 8. Saving factor, Pv for August.

Figure 9. Saving factor, Pv for September.
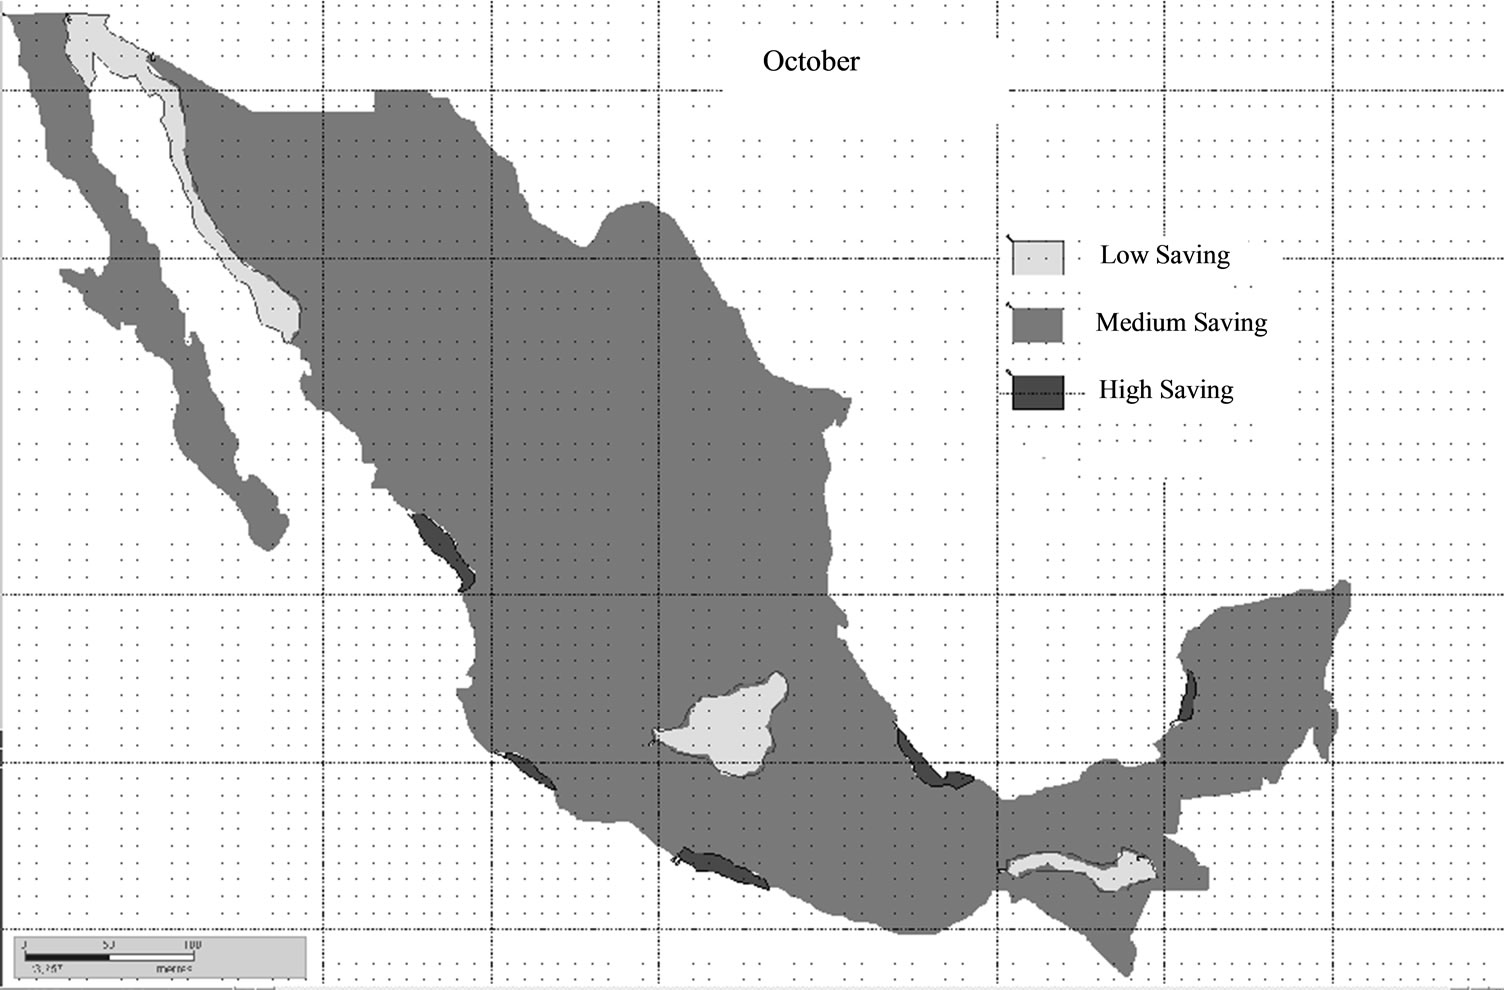
Figure 10. Saving factor, Pv for October.
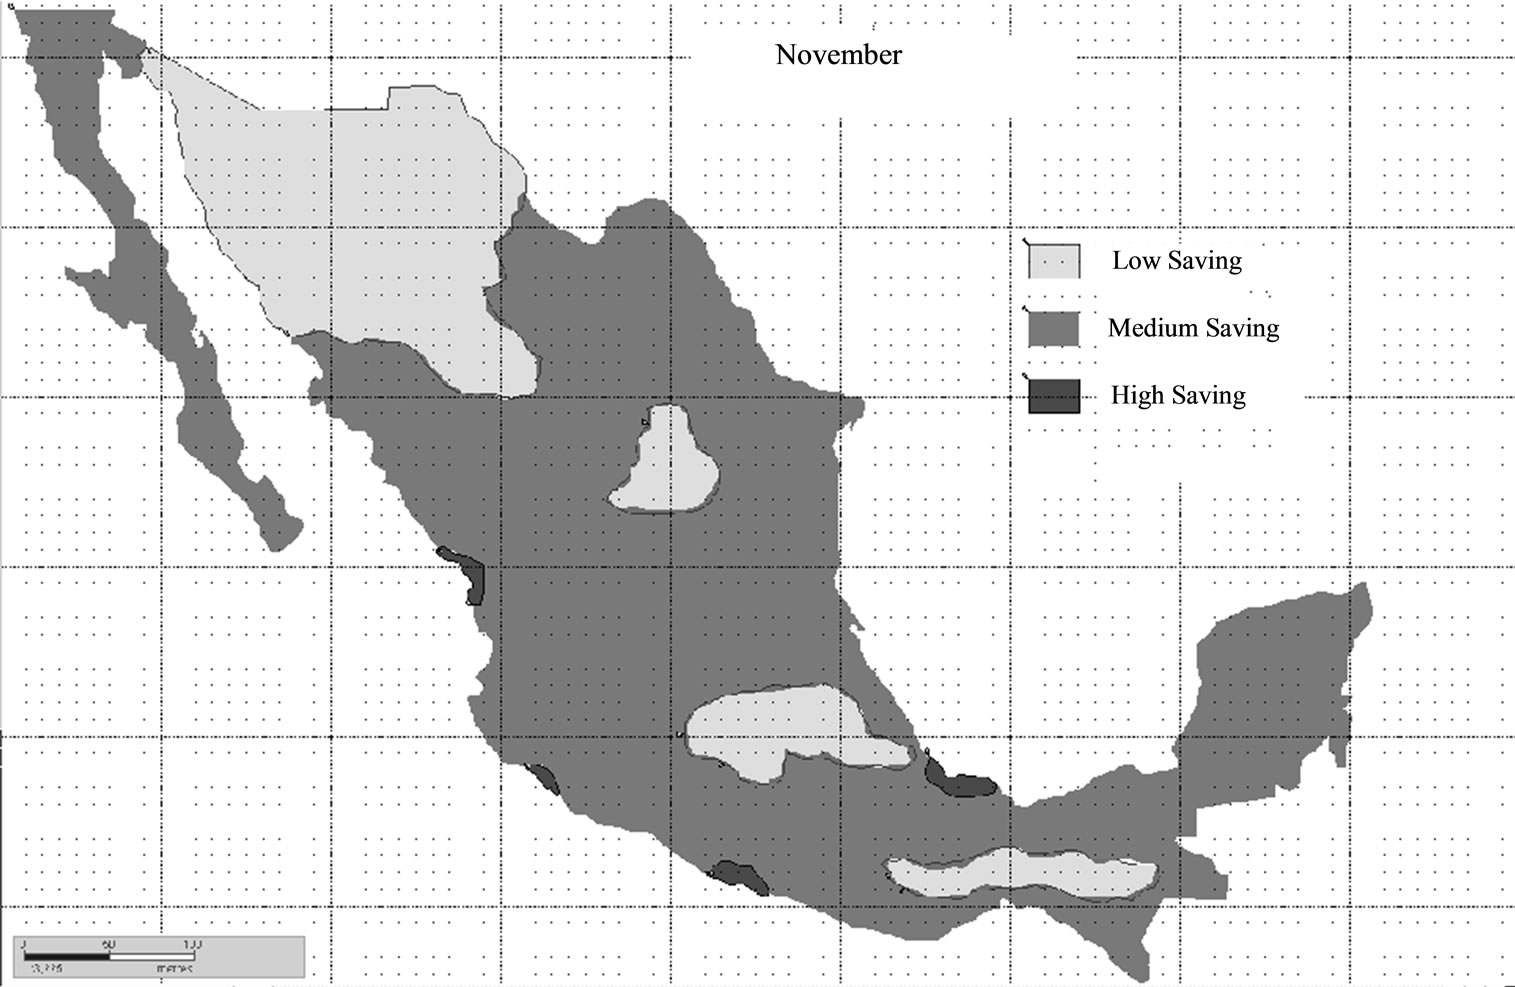
Figure 11. Saving factor, Pv for November.
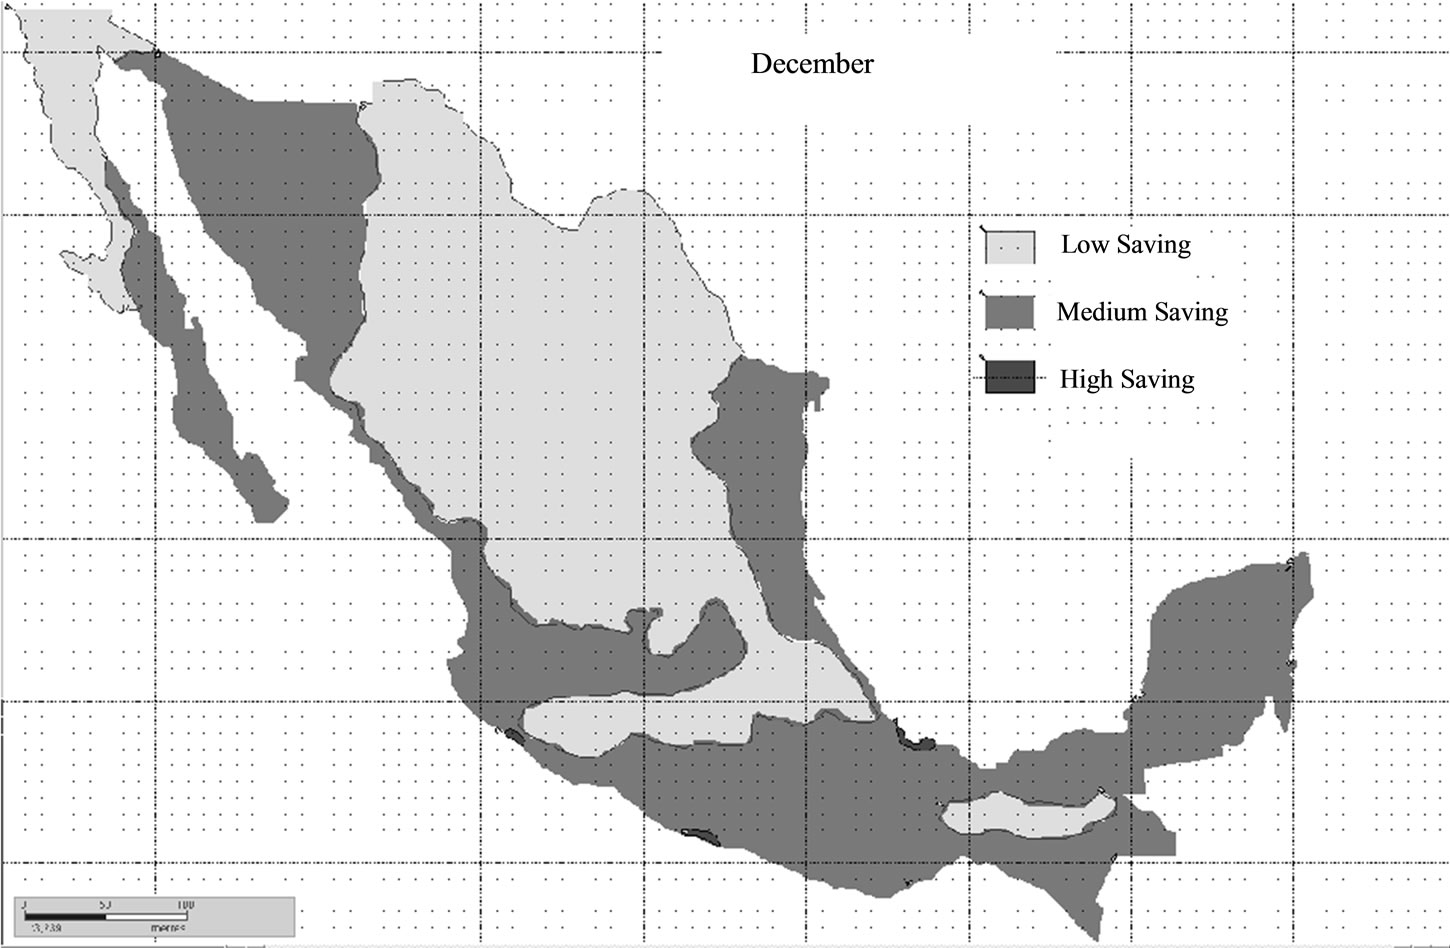
Figure 12. Saving factor, Pv for December.
4. Discussion
According to the maps shown above, all Mexican territory has a potential of saving by using natural ventilation instead using air-conditioning.
During the cool season, January, February, November and December, Pv is low, especially in the north-center part, where the climate is hot-dry. In March, April, May and June Pv increases but not so much due to high temperature and low humidity which do not help to achieve well natural ventilation. During July, August, September and October, the hot and humid season, Pv has the highest values, especially in the coasts.
Thus, statistically and according to the data tables of the energy saving factor of the cities during all year, the mean value of Pv in Mexico has a value of 0.2187.
Therefore, the energetic, economic and environmental benefits by using natural ventilation will be found by applying this mean value of Pv.
4.1. Energetic Benefits
4.1.1. Residential Sector
The average consumption of energy within a Mexican regular conditioned house gas and electricity is distributed on the following way: 44% house warming and air conditioning, 33% illumination and appliance, 14% refrigerator, and 9% water heating and stove [11].
From the 44% of house warming and air-conditioning, 8% is for house warming and 36% is for air-conditioning. But not all houses in Mexico have systems of air conditioning; from all electricity consumed in the house sector in Mexico at 2006, 17% correspond to airconditioning [11]. Therefore, the energy consumption in household sector in Mexico at 2006 was 44 452 408 MWh [12] then.
As is shown in Table 1, the consumption of air-condi-tioning in Mexico at 2006 was 7.5 TWh. Thus, the energy consumption by air-conditioning is multiplied by a general average all-over factor of energy saving.
According to Table 2, by using natural ventilation in households a saving of 1.65 TWh is gotten. In comparison to the Daylight Saving Time (DST) at 2006 in Mexico, which was 1.14 TWh [13], only in residential sector the energy saving is almost 1.5 times than DST.
4.1.2. Commercial Sector
By doing an analogy for commercial sector, where the
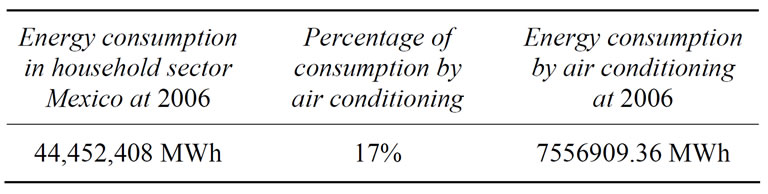
Table 1. Electric energy consumption of residential sector by air conditioning in Mexico at 2006.
consumption was 13,229,246 MWh, and the percentage of consumption at 2006 was 38% by air conditioning [11], the result are shown in Table 3.
Multiplying this consumption of 5 TWh by the average saving factor, the result is as follows
Table 4 shows that the saving was 1.09 TWh, almost the 2006 Daylight Saving Time.
4.1.3. Both Commercial and Household Sector
For both sectors, the saving is 2.75 TWh. This saving is about equal to the individual consumption of one of the Mexican states of Campeche, Colima or Nayarit [14].
4.1.4. Demand Reduction
Also, it is calculated a reduction of the maximum coincident demand of the National Electric System, in comparison to the 2006 Daylight Saving Time, which is 2265 MW, equal to three times a power plant of 750 MW [14].
4.2. Economic Benefits
4.2.1. House Sector
Considering an average price of kWh of 0.075 US Dollars [14,15] in house sector there is a saving of 131 millions US Dollars.
4.2.2. Commercial Sector
With an average price of kWh of 0.177 US Dollars [14, 15] in commercial sector there is a saving of 192 millions US Dollars.
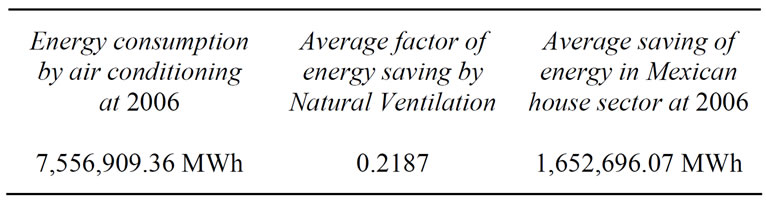
Table 2. Energy saving by natural ventilation in the Mexican household sector at 2006.
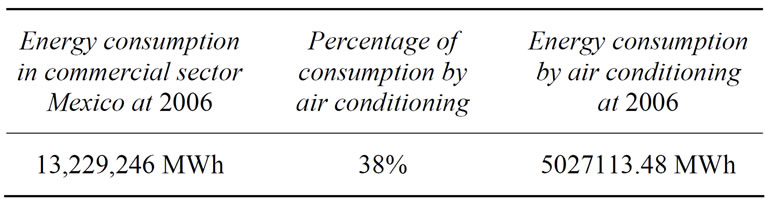
Table 3. Electric energy consumption of commercial sector by air conditioning in Mexico at 2006.
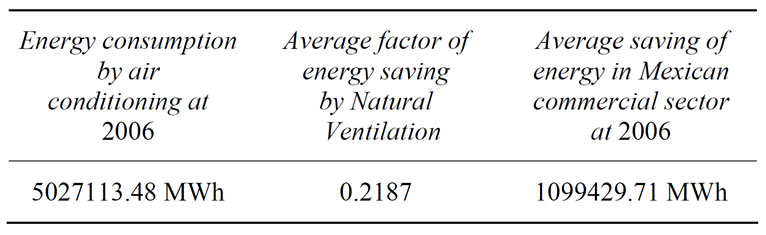
Table 4. Energy saving by natural ventilation in the Mexican commercial sector at 2006.
4.2.3. National Demand
By avoiding the construction of a power plant of 750 MW, there is a saving of 1.8 billions US Dollars [14,15]. This is equivalent to avoid a power plant which generates electricity for turning on 36 millions of 60 W lamps at the same time [14].
4.3. Environmental Benefits
In Mexico, almost 75% of the generated electricity is through fossil fuels burning [12]. Therefore, application of natural ventilation could avoid the burning of 6 million barrel of oil equivalent [16] at 2006 and the emission of 1.23 million tons of CO2 [16].
5. Conclusions
This document shows that any zone in Mexico has the option of energy saving by using natural ventilation because the model is oriented to tropical climates. As the general case was the acclimatization 24 hours at day, Pv did not pass over 0.417; but if a building has to be conditioned less hours Pv increases.
As benefits, the use of natural ventilation in household and commercial sector saves almost 0.19% of the final total consumption in Mexico at 2006. The economic benefit is the saving of 2.12 billion US Dollars in total. And the environmental benefit is the mitigation of 1.2 million tons of CO2.
Nevertheless, implementation of massive use of natural ventilation in the whole country is not an easy task. The biggest difficulties to do that are the bad architectural designs, in energy terms, of the projected and already-built buildings; as well as the low energy efficiency behaviour of the users, among others.
Thus, the key to get these benefits is to create conscience and to show the advantage of using natural ventilation among the big actors of the country (government, constructor companies etc) to take into account designs of buildings that use natural ventilation in the projected and already-built buildings; as well as small actors (occupants, self constructors etc) who can change their behavior in order to use natural ventilation as a good way to save energy and money, also in their projected and already-built buildings.
A last comment is that this document shows the benefits that could have occurred in 2006 with natural ventilation; however, these ones have to be verified every year with the corresponding data.
REFERENCES
- F. Allard, “Natural Ventilation in Buildings,” James & James, London, 1998.
- D. Croome and B. Roberts, “Air Conditioning and Ventilation of Buildings,” Pergamon Press, Oxford, 1981.
- N. Milbank, “Energy Savings and Peak Power Reduction through the Utilization of Natural Ventilation,” Energy and Buildings, Vol. 1, No. 1, 1977, pp. 85-88. doi:10.1016/0378-7788(77)90015-9
- F. Sinden, “Wind, Temperature and Natural VentilationTheoretical Considerations,” Energy and Buildings, Vol. 1, No. 3, 1978, pp. 275-280. doi:10.1016/0378-7788(78)90007-5
- M. H. Sherman and D. T. Grimsrud, “A Comparison of Alternative Ventilation Strategies,” 18th Intersociety Energy Conversion ENGNG. Conference on Energy for the Marketplace, Orlando, 1983.
- I. Oropeza and D. Morillón, “Atlas de la Ventilación Natural para la República Mexicana: Potencial para el Ahorro de Energía en la Climatización de Edificios,” Universidad Nacional Autónoma de México, México, 2010.
- R. Lamberts, S. Goulart, J. Carlo and F. Westphal, “Regulation for Energy Efficiency Labeling of Commercial Buildings in Brazil,” 2nd PALENC Conference and 28th AIVC Conference on Building Low Energy Cooling and Advanced Ventilation Technologies in the 21st Century, Crete Island, 2007.
- C. C. de Dearc, R. J. Lamberts and L. Bittencourtd, “Air Movement Acceptability Limits and Thermal Comfort in Brazil’s Hot Humid Climate Zone,” Building and Environment, Vol. 45, No. 1, 2010, pp. 222-229. doi:10.1016/j.buildenv.2009.06.005
- D. Morillón, R. Saldaña and A. Tejeda, “Human Bioclimatic Atlas for Mexico,” Solar Energy, Vol. 76, No. 6, 2004, pp. 781-792. doi:10.1016/j.solener.2003.11.008
- R. Vidal, “Las Regiones Climáticas de México,” Serie Temas selectos de la Geografía Mexicana, Instituto de Geografía UNAM, México, 2004.
- C. Petersen, F. Guillen, “Sistema de Información Energética,” 2007. http:// sie.energia.gob.mx
- G. Kessel, J. Herrera and E. Pedraza, “Balance Nacional de Energía 2006. Secretaría de Energía,” 2007. http://www.energia.gob.mx/webSener/res/PE_y_DT/pub/Balance%20Nacional%20de%20Energia%202006.pdf
- J. F. Montiel and S. L. Arriaga, “Comisión Nacional para el Uso Eficiente de Energía,” 2007. http:// www.conuee.gob.mx
- J. G. Serdan, “Comisión Federal de Electricidad,” 2007. http://www.cfe.gob.mx
- R. Del Cueto, M. Ramos, M. Sanchez and J. J. Sidaoui, “Banco de México,” 2007. www.banxico.org.mx/tipo/estadisticas/index.html
- ICE Data North America, “Chicago Climate Exchange,” 2007. http://www.chicagoclimatex.com
Nomenclature
hc = Comfort hours in a month
hu = Occupation hours in the building in a month
ENDPI = Numerical equivalent for the efficiency of envelope
ENAC = Numerical equivalent for the efficiency of air-conditioning
ENCA = Numerical equivalent for the efficiency of illumination
PT = Efficiency level in the building
PTv = Energetic efficiency for using natural ventilation
Pv = Saving factor for using natural ventilation
AC/AU = Relationship between the areas of the conditioned zone and the used zone