Atmospheric and Climate Sciences
Vol.4 No.2(2014), Article ID:45167,15 pages DOI:10.4236/acs.2014.42030
Trends and Interannual Variability of Winds and Turbulent Heat Flux in the Indian Ocean Sector of Southern Ocean during 2000-2009
Alvarinho J. Luis
Earth System Science Organization-National Centre for Antarctic and Ocean Research Ministry of Earth Sciences, Government of India, Headland Sada, India
Email: alvluis@ncaor.org, alvluis1@gmail.com
Copyright © 2014 by author and Scientific Research Publishing Inc.
This work is licensed under the Creative Commons Attribution International License (CC BY).
http://creativecommons.org/licenses/by/4.0/


Received 10 February 2014; revised 9 March 2014; accepted 16 March 2014
ABSTRACT
Using satellite-based wind and sea surface temperature (SST) observations, linear trend and interannual variability of wind stress, turbulent heat flux (Q) and wind stress curl are addressed for the Indian Ocean sector of the Southern Ocean (ISO, 0˚E - 155˚E) for the period 2000-2009. The analysis reveals that spatial mean of Q varies between 70 and 73 Wm−2 in the austral summer and winter, respectively, while the mean wind stress is nearly same at 0.22 Nm−2 for both seasons. The anticyclonic curl dominates the ISO, which increases from 0.15 × 10⁻⁷ to 0.35 × 10⁻⁷ Nm−3 during the austral summer. The detrended box-mean time series of Q, wind stress, and wind stress curl exhibits a decreasing trend of –6.3 ± 1.6 Wm−2∙decade−1, −0.012 ± 0.004 Nm−2∙decade−1 and −0.48 ± 0.6 × 10⁻⁸ Nm−3∙decade−1, respectively. The Empirical Orthogonal Function (EOF) analysis was carried out to study interannual variability. EOF-1 of Q captures 25% of the total variance, which mimics the austral summer pattern; its time coefficient is highly and negatively correlated with a 2-month lagged Nino3.4 SST index (r = −0.8 at 95% confidence). EOF-1 of wind stress accounts for 35% of the total variance and its time coefficient is strongly correlated with the Antarctic Oscillation (r = 0.86 at 95% confidence). EOF-1 of wind stress curl captures 15% of the total variance; its time coefficient is correlated to the Nino3.4 SST index (r = 0.65 at 95% confidence) with the former lagging the latter by two years. The repercussions of the weakening trends of the climatic parameters on the air-sea interaction and ocean circulation are highlighted.
Keywords:Southern Ocean; Interannual Variability; Meteorology; Empirical Orthogonal Function Analysis

1. Introduction
The Southern Ocean (SO) hosts the strongest winds in the world oceans, which facilitates heat, moisture, and momentum exchanges between the ocean and atmosphere and forms the largest and important domains of the global climate. The air-sea heat fluxes play a paramount role in the redistribution of heat between the tropics and poles, thereby influencing the global climate through the meridional [1] and regional climate phenomena [2] . Momentum flux into the SO is a crucial for maintaining the eastward flowing Antarctic Circumpolar Current (ACC), Ekman pumping, upwelling along Antarctic coast, upper-ocean mixing, and large-scale ocean circulation. Determining the exchanges of momentum, sensible and latent heat flux (turbulent heat flux, hereafter Q) between the SO and atmosphere is vital to understand its role in the global climate system. The water temperature in the current remains 2˚C - 3˚C warmer in some parts and 2˚C - 3˚C colder in other parts than the average. This zonal wavenumber-2 anomaly pattern moves eastwards as Antarctic Circumpolar Wave (ACW) and takes 8 - 9 years to circumvent the SO [3] . The ACW exerts a considerable influence on the weather patterns in southern Australia, South America and South Africa; the ACW anomalies are also associated with cyclonic activity [4] . The ACC facilitates a global transport of mass, heat and momentum, and climate signals from one ocean basin to another. The modulation of air-sea fluxes by the influence of the ACC is thus important to understand the variability of the global climate system, through the global overturning circulation [5] . Positive (negative) sea surface temperature (SST) anomalies are generated by anomalous latent heat flux, propelled by southward (northward) meridional wind stress anomalies resulting from geostrophic balance [6] .
The IO sector of the SO as a whole is anomalous relative to other circumpolar regions in the following ways. It exhibits a strong relationship to extrapolar climate and termination of ACW [7] [8] . There is a lack of longterm trends in the sea-ice extent [7] . The Antarctic-SO topography initiates the wave number-3 atmospheric circulation pattern during austral winter and enhances the meridional pressure gradients north of the ice edge maxima, thereby promoting baroclinic instability which facilitates a large-scale cyclogenesis [9] . Along the western continental shelf of Australia, the poleward-flowing warm Leeuwin Current breaks in a series of eddies and cools down as it moves southward, thereby promoting convection which enhances latent heat loss during MarchNovember and contributes greatly to the rainfall in the southwest region of west Australia.
The western IO sector of the SO exhibits different characteristics from other sectors of the SO in the following ways. The positive wind stress curl promotes downwelling (0 - 20 cm∙day−1) throughout the year [10] , with little seasonal variation. Around the South African coast, coastally trapped waves are formed in the atmosphere, which propagates eastward as coastal low pressure systems in concert with the passing synoptic pressure systems to the south [11] . Therefore, the coastal winds are aligned with the coastline. The general wind patterns over the southern IO drive major currents; consequently, the wind-driven circulation overwhelms the thermohaline circulation [10] . The region exchanges a large amount of heat with atmosphere, which it received largely through the warm AC. The south IO subtropical gyre differs from its counterparts elsewhere in that most of the water recirculates in the western and central domain of the ocean basin, resulting in weak gyral circulations east of 70˚E [12] (Figure 1).
In the climate change scenario, the literature works project positive trend in global upper-ocean heat content (0.27 × 10²² ± 0.04 J∙yr–1) [13] , surface temperature (0.1˚C - 0.6˚C decade–1), IPCC-2007 Fourth Assessment Report), sea level (3.2 mm∙yr–1) [14] in the last 50 years. Moreover, the mid-depth temperature in the SO has risen by 0.17˚C between the 1950s and the 1980s [15] . Due to problems in carrying out field measurements with higher temporal and spatial coverage due to inclement weather in the SO and huge ship costs, we used satellitebased data consisting of wind maps from microwave scatterometer SeaWinds on board QuikBird satellite (hereafter referred to as QuikSCAT), SST from blended microwave and in-situ measurements. Using these data, wind stress and Q were computed through the COARE bulk flux algorithm [16] . There are several forms of bulk flux algorithms currently available [17] , but the differences between them exist in the scheme used to parameterize the transfer coefficients of heat in conditions of light wind and stable stratification, influence of sea spray, treatment of sea state, appropriate averaging scales, parameterization of mesoscale gustiness, and the behavior of scalar sub-layer transfer.
This work focuses on QuikSCAT operational period from 1999 to 2009, spanning 0˚E - 155˚E and 63˚S - 30˚S. Only a few cursory works are available that focus on individual events highlighted from cruise data of short (ranging from a week to three months) temporal coverage [18] [19] . Moreover, trends of the air-sea interaction parameters (momentum, Q, and wind stress curl) have not been reported for the study area. With the availability of a decade-long record of QuikSCAT observations with 2-day global repeatability, it is worthwhile
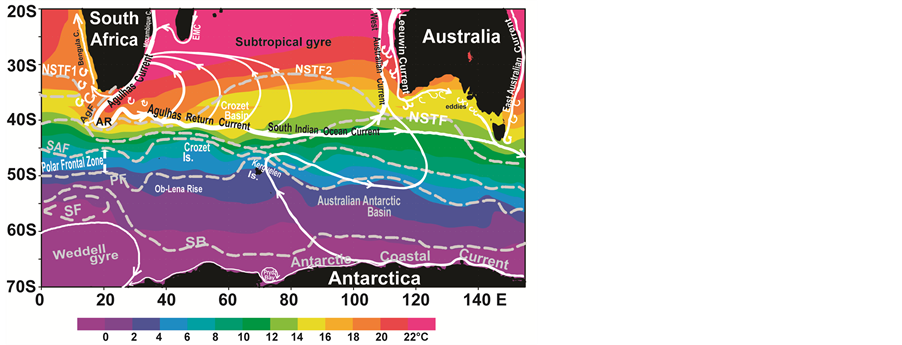
Figure 1. Study area superimposed with mean sea surface temperature (1990-2000), schematics of ocean current systems, extent of hydrological fronts [21] . Abbreviations are: AR, Agulhas Retroflection; AgF, Agulhas Front; SB: Antarctic Circumpolar Current Southern Boundary [22] ; NSTF1 and 2, north and south Subtropical Front; SAF, Subantarctic Front; PF, Polar Front; SF, Scotra Front; EMC, East Madagascar Current.
to make an integrated analysis of the surface fluxes in order to provide more systematic results for the trends and interannual variability in the study area. The processes and the wind stress variability in study area are more complex with a large interannual variability [20] .
2. Materials and Methods
This study employs wind vectors derived from QuikSCAT in June 1999. The radar backscatter measured by scatterometers is directly related to the stress on the ocean surface, which induces the waves detected by the radar. The wind stress is dependent on wind speed, surface current, and near-surface static stability, so that a particular value of wind stress can correspond to different wind speeds under different stability conditions. For this reason the radar cross section is calibrated to equivalent neutral stability winds at 10 m, U10n [23] . In a comprehensive investigation of collocated QuikSCAT measurements and mooring data from over 100 buoys, Ebuchi et al. [24] found that there is no significant dependence of QuikSCAT minus buoy U10n on either SST or on air-sea temperature difference.
Daily-mean wind vector maps referenced to 10 m above the sea surface were obtained from the Center for Satellite Exploitation and Research (CERSAT) at IFREMER. These were generated by using a statistical interpolation that uses an objective method to fill in data gaps and to generate monthly fields on 0.5˚ × 0.5˚ grid [25] . Root mean square (RMS) differences between collocated QuikSCAT and buoy data is 0.7 ms−1 for the wind speed and 13˚ for wind direction, under moderate conditions [26] . Validation using ship-based wind data suggests that the uncertainties of QuikSCAT winds are 0.45 ms−1 and 5˚ for QSCAT-1 model function and 0.3 ms−1 and 3˚ for Ku-2000 model function for a wind speed <20 ms−1 [27] . It is to be noted that the scatterometer provide an equivalent neutral wind speed. The difference between the stability-dependent and equivalent neutral wind speed for the study area is reported to be 0.2 ms–1 [28] ; their study also suggests that Q computed by using stability-dependent and equivalent neutral wind speed leads to a difference of 2 and 4 Wm−2, respectively. These differences are well below the benchmark accuracy requirements of 10 Wm–2 for heat flux observations recorded for the Tropical Ocean and Global Atmosphere (TOGA) project.
The optimum interpolated SST fields were generated on a 1˚ × 1˚ grid by blending in-situ and satellite-based observations, in addition to SSTs simulated by sea ice cover; the satellite data have been adjusted for biases [29] . The NCEP-NCAR reanalysis-based daily-mean air temperature and humidity at 2 m above the sea surface and mean sea-level pressure on 2.5˚ × 2.5˚ grids [30] were used. This Numerical Weather Forecasts (NWF) was generated by using a frozen state-of-the-art global data assimilation system with a T62 resolution version of NCEP’s medium range forecast mode. A comparison between NCEP-NCAR and ECMWF pressure fields indicate that the error variances for IO sector of the SO is 5% southward of 60˚S [31] .
The SST, wind vectors and the meteorological data were incorporated in the bulk flux algorithm [16] to estimate wind stress and Q, following the procedure outlined elsewhere [32] . The COARE bulk algorithm 3.0 is used to estimate transfer coefficients (Cd for stress, Ce for latent, and Ch for sensible heat) based on the wind velocity, air temperature, SST, humidity, atmospheric pressure, NCEP-NCAR’s surface shortwave and longwave fluxes, and the height of the atmospheric boundary layer [16] .
The COARE bulk algorithm was initially developed from the model of Liu-Katsaros-Businger [33] for using it in the light wind (0 - 12 ms−1) and strongly convective conditions over the western Pacific warm pool region [34] . The algorithm is based on iterative estimation of scaling parameters and stability functions using the similarity theory, as well as wind gustiness based on heat and moisture fluxes, temperature, and atmospheric boundary layer height. In the updated COARE algorithm 3.0 [16] , the range of wind speed validity is extended to 0 - 20 ms–1 after modifying roughness representation. The transfer coefficients are redefined in terms of conservative quantity (mixing ratio) rather than the measured quantity (water vapor density), thus eliminating the need for the Webb et al. [35] correction to latent heat flux. The mean profile stability functions are adjusted and the number of iterations to solve for stability has been shortened considerably. The COARE 3.0 is shown to be accurate within 5% for wind speeds of 0 - 10 ms–1 and 10% for wind speeds between 10 and 20 ms–1.
Monthly spatial-mean time series of Q, wind stress, and wind stress curl were obtained by box averaging. In this work, positive Q represents heat loss from the sea surface. Apart from mechanical stirring by wind stress, the wind stress curl over the SO has a big influence on the sea surface temperature: positive wind stress curl induce sea surface cooling through Ekman pumping, while negative curl facilitates surface convergence and sea surface warming. The wind stress curl was computed by using the centered finite difference scheme. Ekman pumping velocity at the base of the mixed layer was computed by using W = (1/ρf) ∇ × τ, where ρ is seawater density (1025 kg∙m–3), τ is wind stress and f is Coriolis force (2 * 7.279 * 10−5 *sinø, where ø is latitude).
Climatological fields (10-year mean) of Q, wind stress, and wind stress curl for austral summer (JanuaryMarch) and winter (July-September) were generated to provide the background of the variability. To compute the linear trend, the seasonal variability was filtered out by using a 12-month running mean at each grid point. In terms of the Fourier spectrum, the 12-month running mean is one of the shortest filters to remove frequencies higher than one cycle per year [36] . Mean value and trend were computed through a linear regression analysis. The detrended time series have been used to carry out the EOF analysis to address the interannual variability. The linear trend of a variable y is calculated from observed values yi at time ti, i = 1, 2, …, N, by fitting (ti, yi) to a linear relation yi =b0 + b1ti + εi through a least squares method. b1 represents the trend, and its uncertainty is estimated from the residuals εi, following a method described in Appendix-1 of Fang et al. [37] .
The EOF analysis was carried out on data to decompose the time series into dominant spatial and associated time coefficient function (TCF). After removing mean and linear trend from the de-seasoned fields, EOF analysis was performed. The concept of the EOF analysis can be briefly summarized as follows. An anomaly matrix X with M grid points (m = 1, 2, …, M) at time t (t = 1, 2, …, N) can be expanded into a series of modes represented by:
 (1)
(1)
where Fi(m) is the i-th EOF representing the spatial pattern of the i-th mode; αi(t) is the TCF of the i-th mode; K = min(M, N). These modes are arranged in order of magnitude of their corresponding variance λi, which is equal to the i-th eigenvalue of the covariance matrix of x(m,t). λi represents the variance explained by the i-th mode. The TCFs are normalized to satisfy
 (2)
(2)
The variance contained in the EOFs is given by
 (3)
(3)
The standard deviation of the i-th EOF is .
.
Attempts are also made to explore the relationship between the Southern Annular Mode (SAM) and surface atmospheric variables used in this study. The SAM variability is characterized by zonally-symmetric atmospheric pressure anomalies of opposite sign between Antarctica and mid-latitudes positive atmospheric pressure anomalies at mid-latitudes together with negative anomalies at high latitudes indicate a positive SAM and vice-versa for a negative SAM [38] [39] . The SAM index was constructed by projecting the monthly mean 700 hPa height anomalies from NCEP-NCAR reanalysis data set onto the leading EOF mode (http://www.cpc.ncep.noaa.gov/). The time series were normalized by the standard deviation of the monthly index for the 1979-2000 base period.
3. Results
3.1. Climatological Fields
Figure 2 depicts 10-year mean fields of Q (top row), wind stress (middle row), and wind stress curl (bottom row) for austral summer (left-hand side column) and winter (right-hand side column). Hereinafter austral summer and winter will be referred to as summer and winter, respectively. The dynamic topography contours of 0.9 and 0.35 dy m represents the northern and southern boundary of the ACC, respectively [22] . In summer and winter the basin-wide Q mean is 70 and 73 Wm−2, respectively. AR region depicts a high Q loss (160 Wm−2) due to enhanced air-sea interactions promoted by warm water transport of AC and subsequent dissipation of eddies due to retroflection (Figure 1). The latent heat flux alone contributes by 79% during both seasons for this region. Likewise, the latent heat flux accounts for 95% contribution to Q loss (170 Wm−2) in the region west of Australia during summer (Figure 2(a)); it decreases by 71% during winter when weak northward winds prevail (Figure 2(b)). The southward flow of warm tropical water via the Leeuwin Current (Figure 1) facilitates high Q loss. During winter, the wind stress over the ACC region increases by 23% from 0.23 to 0.3 Nm−2 (Figure 2(d)). Q is dominated by 90% latent heat flux contributing about 20 - 30 Wm−2 in both seasons. Warmer atmosphere during austral summer facilitates stable conditions in the MABL.
The basin-mean wind stress amounts to 0.22 Nm−2 in both seasons (Figure 2(c) and Figure 2(d)). In winter, the central IO experiences the strongest wind stress amounting to 0.4 Nm−2; the strong stress region shifts northward, which can be explained as follows. The upper troposphere of the SH has a double jet structure over the IO in winter with a strong subtropical jet near 30˚S and a mid-latitude jet centered near 50˚S. However, during summer only the subtropical jet exists. The mid-latitude jet is a source of eddies and its meridional shift is coupled to a similar shift in the eddy source region. If the eddies propagate away from the jet before breaking, there will be convergence of eddy vorticity flux at upper levels, which reinforces the jet in its shifted position. Upper-level divergence balances the convergence of eddy vorticity through divergence, which requires mass convergence at surface. This mass convergence generates vorticity and sustains the shifted jet against surface friction. The feedback loop is completed through the secondary circulation which produces adiabatic heating and cooling in such a way that the baroclinicity is maintained, thereby sustaining a balanced jet and enhancing eddy growth in the region of shifted jet. These new eddies further reinforce the jet in its anomalous location via the mechanism described above, thus creating a feedback in the IO [40] .
The strength of the basin-mean zonal wind stress (taux) is enhanced nearly ten times (0.4 Nm−2) that of the meridional wind stress component (tauy, 0.05 Nm−2) in winter. Likewise, the zonal wind stress component dominates the wind stress in summer. It is noted that the wind stress strengthens in some areas and weakens elsewhere alternately in the 45˚S - 60˚S band in both seasons. The asymmetry can be explained by small deviations in the west-to-east winds and their effect on the heat exchange between ocean and atmosphere; when cold winds blow from the south, they facilitate heat loss from the ocean and deepen mixed layers [41] . The deeper mixed layers permit deeper light penetration and supports primary productivity.
The mean anticyclonic curl varies from 0.15 × 10⁻⁷ in winter (Figure 2(f)) to 0.35 × 10⁻⁷ Nm−3 in summer (Figure 2(e)). South of 50˚S, the cyclonic wind stress curl (−0.7 × 10⁻⁷ Nm−3, Figure 2(f)) induces Ekman pumping at a rate of ~0.2 ms−1, and the upwelled water is advected northward as a part of the Ekman transport, thereby pushing the ACC and its fronts northward [42] . The anticyclonic wind stress curl weakens by a factor of 100 during austral summer (Figure 2(e)). The anticyclonic circulation to the southwest and west of South Africa promotes downwelling at a rate of ~0.2 ms−1, leading to high latent heat transfer to the atmosphere in both seasons. These air-sea interactions play a significant role in the influencing the regional weather patterns [43] .
In an attempt to underline the relationship between spatial patterns of wind stress and Q and tauy and wind stress curl, spatial correlations were computed (Figure 3). The confidence levels are highlighted by light (95%) to dark shade (99%) in Figure 3. South of Australia, a large area marked by positive correlation (>0.4) with wind stress leading Q by 22 months, is attributed to the strong interaction between eddies and Leeuwin Current [44] facilitated by seasonal reversal of winds which propels large changes in Q. Pockets of high correlation
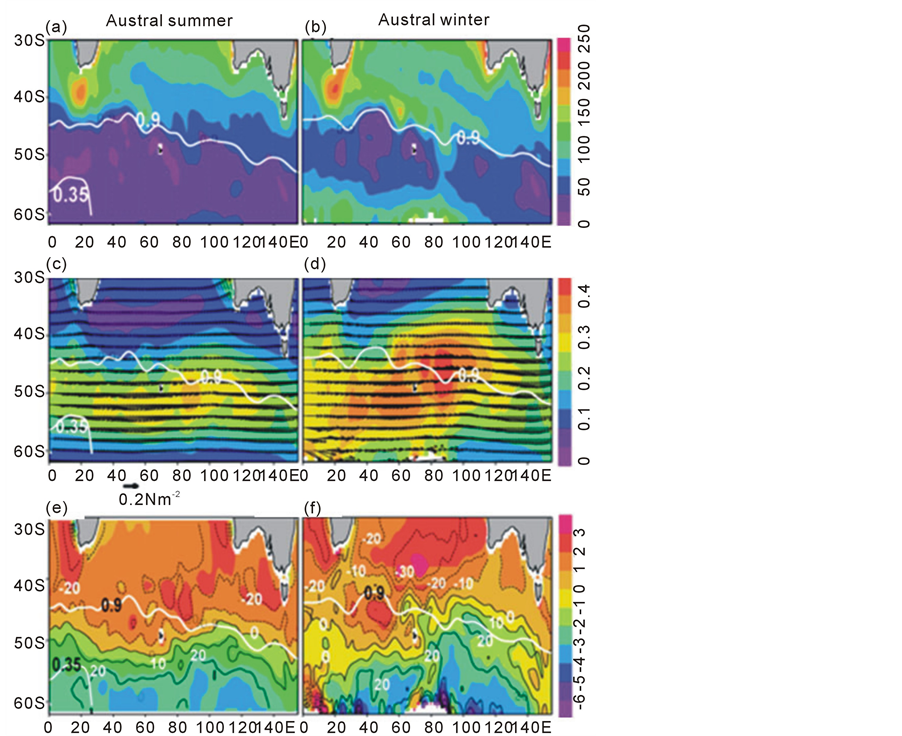
Figure 2. Climatological fields of (a) and (b) Turbulent heat flux (Wm−2); (c) and (d) Wind stress (Nm−2); (e) and (f) Wind stress curl (10 Nm−3) overlaid with contours of vertical velocity (ms−1). The left-hand (right-hand) side panel is for austral summer (winter). Following Orsi et al. [48] , the southern and northern boundaries of Antarctic Circumpolar Current are indicated by dynamic topography contours of 0.35 and 0.9 dym., respectively. Negative vertical velocity values indicate downwelling.
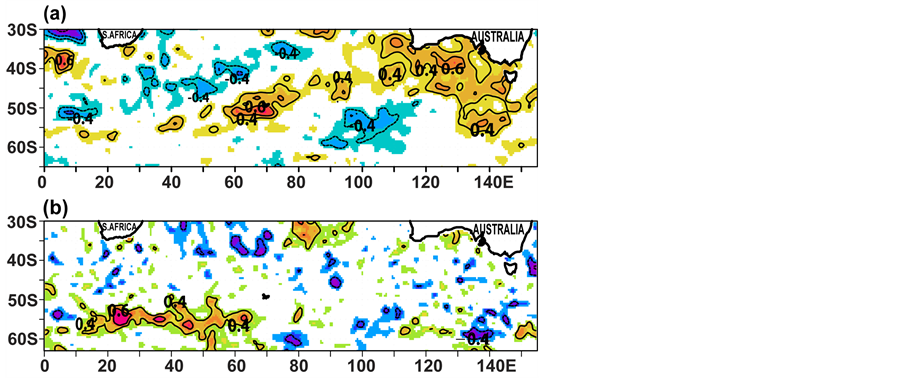
Figure 3. Correlation between spatial fields of (a) Wind stress and Q; and (b) Meridional wind stress component and wind stress curl. The confidence levels are highlighted by light (95%) to dark shade (99%).
occur in the vicinity of Crozet Archipelago suggest enhanced atmosphere-land-ocean interaction propelled by blocking effect of westerlies by elevated land mass. Pockets with negative correlation suggest that oceanic processes, such as upwelling and downwelling, dominate over the atmospheric forcing and modulate Q.
3.2. Linear Trends
The area-mean trends of Q, taux, tauy, wind stress and wind stress curl are displayed on Figure 4, where the linear trend is depicted by least square fit. Q exhibits a decreasing trend (–6.3 ± 1.6 Wm−2∙decade−1) (Figure 4(a)). This is attributed to trend in the variables which influence Q; these variables are wind speed, air-sea humidity and air-sea temperature gradients. Area-mean wind speed exhibits a decreasing trend of –0.18 ± 0.13 ms−1∙decade−1; the zonal wind speed component, which is ten times stronger than its counterpart, also shows a negative trend (–0.1 ± 0.26 ms−1∙decade−1) (not shown in Figure 4). The area-mean gradients of air-sea humidity and temperature that enters the bulk aerodynamic formulae for latent and sensible heat fluxes indicate a trend of –0.07 ± 0.025 g∙kg−1decade−1 and –0.12 ± 0.05˚C∙decade−1, respectively. Air temperature shows a weak cooling trend of –0.06 ± 0.08˚Cdecade−1. It is pertinent to note that the air temperature in the SH indicate an increase with a warming of about 0.6˚C∙decade−1 between 1880 and 1980 and a largest rate of warming between 1965 and 1980 [45] . The SST averaged over the study area exhibits a cooling trend (–0.17 ± 0.08˚C∙decade−1).
The area-mean taux shows a decreasing trend of −0.0092 ± 0.008 Nm−2∙decade−1 (Figure 4(b)), while tauy exhibits a weak increasing trend (Figure 4(c)). The wind stress reveals a decreasing trend of −0.012 ± 0.004 Nm−2∙decade−1 (Figure 4(d)). This is in contrast to the study of Huang et al. [46] , wherein they have pointed out that the wind energy input to the ACC has increased by 15% during 1948-2003. A sharp fall in the wind stress after 2006 coincides with an increase in the turbulent heat flux. The area-mean wind stress curl also exhibits a decreasing trend of −0.48 ± 0.6 × 10⁻⁸ Nm−3∙decade−1 (Figure 4(e)); however, an increase in the wind stress curl is evident after 2007. In a typical scenario of global warming, we expect a reduced equator-to-pole temperature gradient, as a result of which the wind stress may be reduced. Moreover, the wind-stress variability in the SO is closely related to the AAO and the global environmental change, especially the widening of the ozone hole over the South Pole. The area-mean trends provide limited information, so spatial field of trend are presented in Figure 5. The spatial trend pattern suggest that Q exhibits an increasing trend (>7 Wm−2∙decade−1) south of Africa propelled by warming of the AC [43] . Eddies detach from the ARC and drift into the Atlantic Ocean trapping warmer and saline water, thereby facilitating an inter-ocean heat and salt transfer (Figure 5(a)). Field data indicate that these eddies enhance the transfer turbulent heat flux to the atmosphere and renders an unstable MABL due to convective mixing. This facilitates an onshore transport of moisture through the southeasterly winds, leading to formation of clouds bands [19] . Warm core eddies which pinch off from the AR maintain their distinctive thermal characteristics as far west as 5˚E and as far south as 46˚S [47] . The ACC region also show positive trend, south of about 50˚S. The region south of Africa, which is conducive to downwelling all the year round, is dominated by zero or negative trend in wind stress (Figure 5(b) and Figure 5(c)). Pockets of negative trend in the wind stress are located at 5˚S, 56˚E and 60˚E, 52˚S (southwest of Kergulem Islands).
3.3. Interannual Variability
3.3.1. EOF of Turbulent Heat Flux
The EOF1 of Q captures 25% of the total variance (Figure 6(a)). South of Africa, pockets with high Q emerge, the one at 12˚E, 41˚S is a result of warm core eddies that detach from the AR and move into the southwest Atlantic [48] . A pocket centered on 22˚E, 42.5˚S is a consequence of the warm core eddies which are trapped in the AR loop. Along the path of the ARC, Q gradually weakens as a result of mixing with ambient water and also due to an influx of cold ACC water induced by northward Ekman drift. This path is also a zone of turbulent stirring and mixing because of high eddy kinetic energy density at both the surface and intermediate depths. Southwest of Australia, high Q variability is attributed to increased latent heat loss propelled by anomalous southeasterly winds promoted by migration of the West Coast trough formed over the west Australian coast during January-March [49] . The TCF1 exhibits two highs during the winter of 2000 and 2007 and a low in summer of 2004 (Figure 6(b)). It is pertinent to note that TCF1 is highly and negatively correlated (r = −0.8, significant at 95% confidence level) with Niño3.4 SST index, with former leading the latter by two months. The spectral energy of TCF1 peaks at 43 months period which is significant at 95% confidence interval (figure not shown).
The EOF2 of Q captures 14% of the total variance. The spatial pattern shows pockets of higher variance at
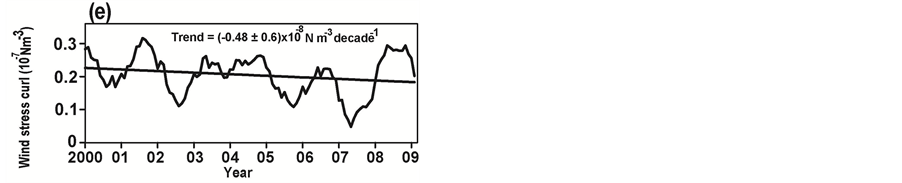
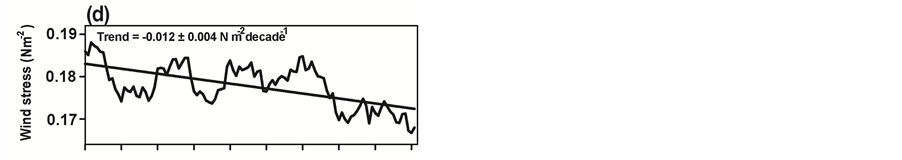
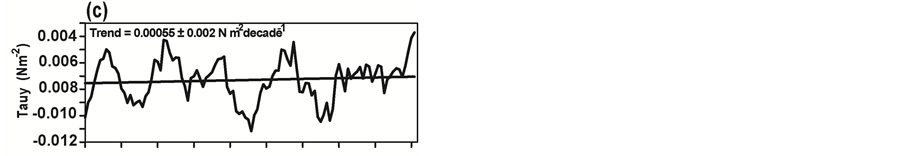
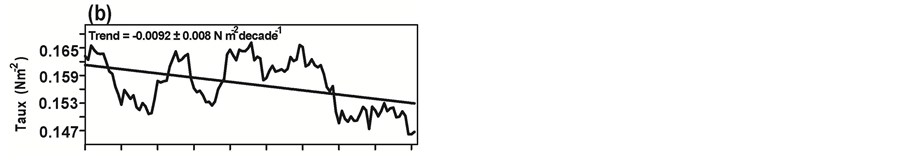
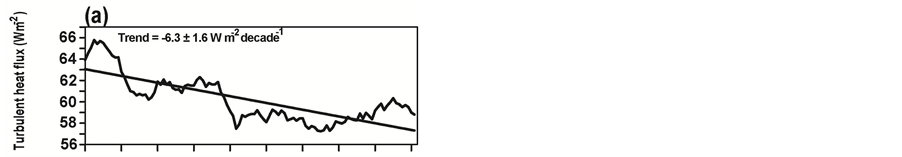
Figure 4. Box-mean time series of (a) Turbulent heat flux; (b) Wind stress; and (c) Wind stress curl. The time series were filtered through a 12-month running mean. Straight line indicates the linear trend.
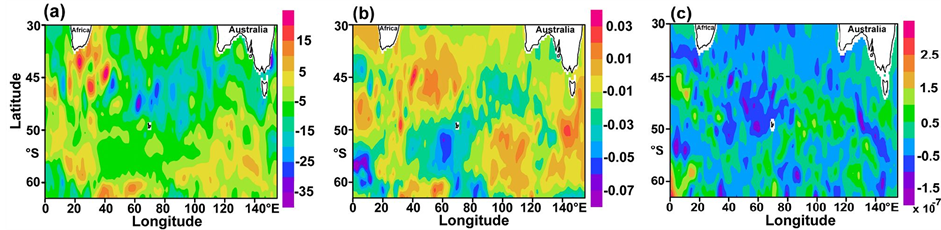
Figure 5. Spatial trend pattern for (a) Turbulent heat flux (Wm−2∙decade−1); (b) Wind stress (Nm−2∙decade−1); and (c) Wind stress curl (Nm−3∙decade−1).
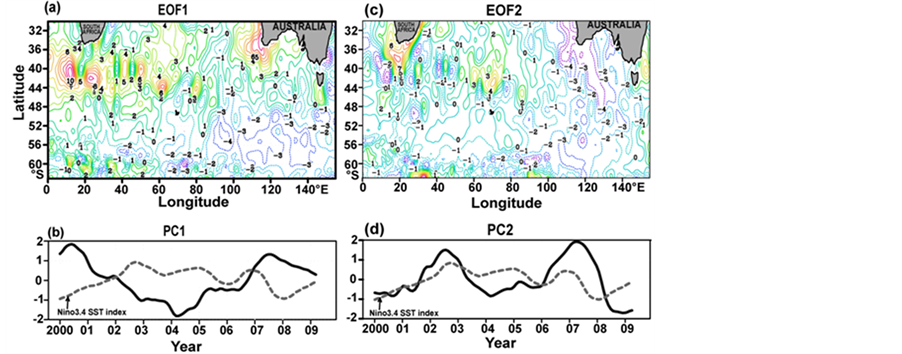
Figure 6. (a) The first EOF mode of turbulent heat flux (Wm−2); and (b) The corresponding normalized time coefficient overlaid with Niño3.4 index; (c) Same as in Figure 6(a), but for EOF2; and (d) Same a Figure 6(b), but for EOF2.
shorter time scales, when compared with EOF1, which is due to turbulent heat transfers associated with eddies in the AC, AR and along the path of the south Indian Ocean Current (Figure 6(c)). Compared to EOF1, the sign of the variance is reversed along the southwest and southeast Australia coast and south of 56˚S. TCF2 portrays bimodal pattern with peaks in July 2002 and March 2007 (Figure 6(d)). It is negatively correlated with Antarctic Oscillation (AAO) (r = –0.63, significant at 95% confidence) with TCF2 leading AAO by a month. The spectral energy of TCF2 shows peaks at 32 and 7 months.
3.3.2. EOF of Wind Stress and Wind Stress Curl
The EOF1 of wind stress accounts for 35% of the total variance. The spatial pattern displays a zonal band of reduced wind stress variance in the subtropical domain (north of 48˚S) (Figure 7(a)). In contrast, the region south of 48˚S is dominated by high variance, which coincides with the ACC regime. The associated TCF depicts peaks at nearly biannual periods (Figure 7(b)). As expected, it is strongly correlated (r = 0.86, significant at 95% confidence level) with AAO. The spectral energy of TCF2 significantly peaks at 21 and 8 month period. EOF2 accounts for 13% of the total variance, which is about half of that captured by EOF1. Pockets of higher variance are found in the choke points and long the coastal Antarctica (Figure 7(c)). TCF2 is highly correlated to Nino3.4 (r = 0.79, significant at 95% confidence level) with the former leading the latter by 18 months (Figure 7(d)). The spectral energy of TCF2 significantly peaks at 26 and 13-month period.
The EOF1 of wind stress curl captures 15% of the total variance (Figure 8(a)). Enhanced variability is a result of the physical dynamics such as upwelling that dominates south of the ACC boundary (Figure 1). TCF1 exhibits a peak coinciding with El Niño event during 2004-05 (Figure 8(b)). TCF1 is strongly correlated (r = 0.65, significant at 95% confidence level) with Nino3.4 with the former lagging the latter by 24 months. Likewise, a correlation of 0.52 was obtained with TCF1 leading Indian Ocean Dipole (IOD) index by 2 months. The spectral energy of TCF1 peaks at 43 and 1 - 2 months period. EOF2 captures 14% of the total variance and the pattern is quite similar to EOF1 (Figure 8(c)). However, TCF2 shows a dominant peak in March 2003. With a correlation coefficient of –0.89, TCF2 lags Niño3.4 by 38 months, while it leads IOD index by 24 months with a correlation of –0.66 (Figure 8(d)). The spectral energy of TCF2 peaks at 43 month period.
3.4. Spatial Linear Regression
In the preceding section it was pointed out that TCF1 of Q and Nino3.4 SST index were highly and negatively correlated (r = –0.8) when the latter lagged the former by two months. To confirm this relationship over the spatial domain, a linear regression analysis was carried between the two-dimensional fields of Q and Nino3.4 index, with the latter lagging the former by two months (Figure 9). Dark shaded (white) areas correspond to <90% (>95%) confidence level. The spatial regression pattern is quite similar to the EOF1 field of Q. Significant and high correlation coefficients are identified southward of Africa, in the central basin and off the southwest and southern coast of Australia, where the dynamical processes govern the upper-ocean dynamics and air-sea interaction in the MABL. High correlation also suggests that these processes are remotely influenced by the ENSO variability occurring in the equatorial Pacific (Figure 9).
Since TCF1 of wind stress and AAO were found to have a significant correlation (r = 0.86), the spatial regression pattern is portrayed in Figure 10. This pattern mimics the EOF1 of wind stress. High correlation coefficients are also identified in the ACC region where EOF1 displayed a high variance, possibly caused due to the weakening of the mean sea level pressure close to Antarctica in the recent decades. Recent studies support that the west wind drift has strengthened in the southern hemisphere. This wind shields Antarctic from influence of climate change signals from the low latitudes, unlike Arctic which shows a strong influence to the anthropogenic climate change. High correlation coefficient in belt 34˚S - 47˚S coincides with high variance in the EOF1 field, but with an opposite sign. Enhancement of easterly winds in this region due to increase in the surface pressure results in higher variability in the recent decade, which in turn results in positive AAO index. It is pertinent to note that in both these belts of enhanced variability, high correlations are observed in the central SO. The regression between curl and Niño3.4 was found to be disorganized.
4. Discussion and Conclusions
Trends and interannual variability of surface wind stress, Q and wind stress curl have been examined. Climatological mean fields reveal that high Q loss in the AR region constitutes 79% latent heat flux during both seasons.
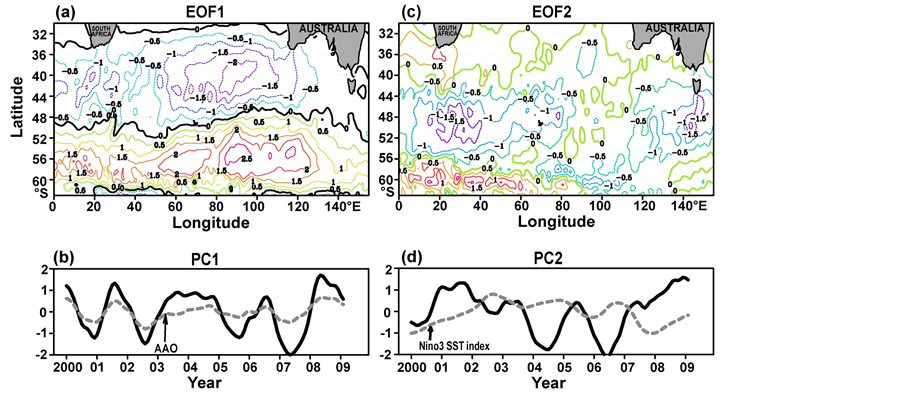
Figure 7. (a) The first EOF mode of wind stress (Nm−2); and (b) The corresponding normalized time coefficient with Antarctic Oscillation (AAO) index overlaid; (c) Same as in Figure 7(a), but for EOF2; and (d) Same a Figure 7(b), but for EOF2.
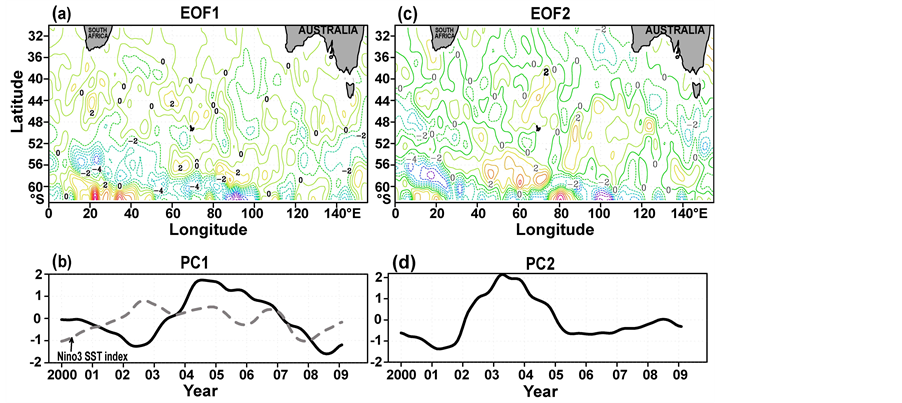
Figure 8. (a) The first EOF mode of wind stress curl (Nm−3); and (b) The corresponding normalized time coefficient with Niño3 index overlaid; (c) Same as in Figure 8(a), but for EOF2; and (d) Same a Figure 8(b), but for EOF2.
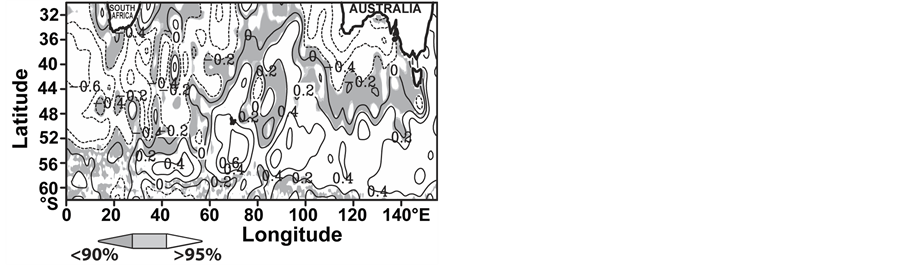
Figure 9. Linear regression between the turbulent heat flux and 2-month lagged Niño3.4 SST index. Dark shaded (white) areas correspond to <90% (>95%) confidence limit.
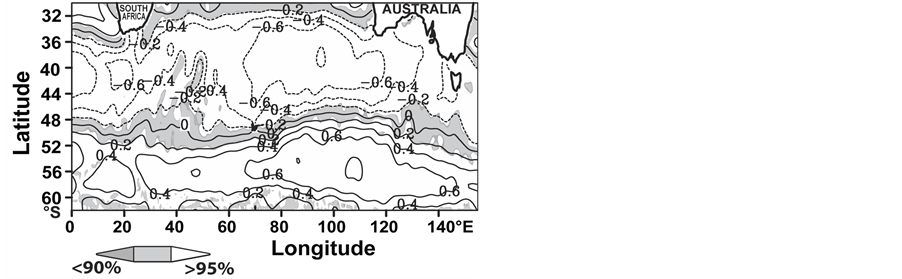
Figure 10. Linear regression between the wind stress and Antarctic Oscillation Index. Dark shaded (white) areas correspond to <90% (>95%) confidence limit.
West of Australia, latent heat flux accounts for 95% of Q during austral summer which decreases to 71% during austral winter when wind speed weakens. Over the ACC region the wind stress increases by 23% during the austral winter. The Q loss is dominated by 90% latent heat flux during both seasons. The wind stress curl is dominantly cyclonic favoring upwelling at the Antarctic Divergence (Figure 1).
The area-mean time series Q revealed a decreasing trend of –6.3 ± 1.6 Wm−2∙decade−1. To confirm this, analysis was carried out by using NCEP-NCAR reanalysis, which also indicated a decreasing Q trend of −2.7 ± 0.05 Wm−2∙decade−1. Since the NCEP-NCAR heat fluxes are estimated based exclusively on model physics, which is independent on the observations, the estimated trend is lower by 57%. Likewise, a negative trend is observed for area-mean wind stress (−0.012 ± 0.004 Nm−2∙decade−1), while the trend estimated from NCEP-NCAR data is found to be –0.004 ± 0.00007 Nm−2∙decade−1. It is noted that trend from latter data set is weaker by a factor of three because the NCEP-NCAR wind stress is estimated based on model physics. Area-mean time series of wind stress curl exhibits a decreasing trend of −0.48 ± 0.6 × 10⁻⁸ Nm−3∙decade−1, while that computed from NCEPNCAR showed −0.73 ± 0.013 × 10⁻⁸ Nm−3∙decade−1. In the global warming scenario, the wind stress will be reduced. So the input of mechanical energy to ocean surface, which is one of the important sources for the maintenance of a quasi-steady circulation in the world ocean, will be reduced. Research work shows a reduction of the wind-energy input to the surface currents in the recent decade, which is estimated as 1.16 TW averaged over the period from 1993 to 2003 [46] . With decreasing wind stress trend, ocean barotropic and baroclinic eddy activity will be reduced, propelling a reduction of the northward Ekman mass transport leading to a slow down the meridional overturning circulation in the world Ocean. Reduced wind intensity will minimize sea spray that contributes to the formation clouds. Reduced cloud cover will permit more incoming radiation, thereby warming the SH. Furthermore, as the ozone hole recovers accelerated warming in the SH is expected [50] .
A decreasing Q trend can be attributed to weakening latent heat flux during the decade, which, in addition to wind speed, is also dependent on air-sea humidity gradients. Through extended analysis we found that the SST, which exhibits an increasing trend since 1993, is showing a negative trend from 2000. This lowers the humidity gradient at the sea surface leading to a negative trend in Q. The weak wind stress in the SO has many repercussions on ocean dynamics. A weak zonal wind stress could lower the northward Ekman flux, thereby reducing the supply of relatively fresh, cold and low saline, and oxygenated water to the mid-latitudes. As a consequence of weakening thermohaline stratification and circulation, export of Weddell Sea Deep Water through the Weddell-Scotia Confluence region will be weakened. This in turn will impact the conveyor system that maintains and rejuvenates the global pathways connecting with different ocean sectors, in terms of water masses, primary productivity, recruitment of species, and migration of organisms that respond to seasonal changes in the temperature. Numerical modeling study suggest that changes in thermohaline circulation directly affect regional and global sea level through changes in specific volume of sea water and variations induced by ocean currents and redistribution of mass in the horizontal and vertical domains [51] .
The decreasing trend in wind stress curl is expected to perturb the cyclonic circulation in the seas surrounding Antarctic continent in Indian sector of the SO. This would result in a decrease in Ekman pumping leading to poor replenishment of nutrients and oxygen-rich water required to sustain biological activity in the surface Ekman layer. Furthermore, weaker upwelling could impede thermohaline circulation and suppress the convective activity, thereby increasing stratification supported by the seasonal melting and freezing of fresh water. This could allow the sea ice to survive the melt season and promote formation of multilayer sea ice, which would increase the albedo and alter the surface heat budget. A slowdown of wind stress curl could diminish the spatial extent of the gyral circulation which would reduce export of sea ice to the north. The integrative effect of all these mechanisms will create a scenario that could induce a negative feedback on the food chain as well as on the regional weather. A statistical study performed on 20 years (1979-1998) of monthly sea ice concentration, sea ice drift and sea level pressure data in the Weddell Sea suggest that a large sea-ice export of ice to the east is abetted by strong easterly winds every 3 - 4 years [52] . So the weakening wind stress trend and its curl could shutoff this export, thereby increasing the chances of multilayer sea-ice formation. More sea-ice formation will increase the salinity leading to formation of more dense water, and shield the ocean from interacting with the atmosphere, which could trap heat in the subsurface. These possible aspects need to be probed in detail by using a global ocean-atmosphere coupled model driven by realistic present day forcing.
The correlation between ENSO and SAM has been reported in the different SO sectors and in marginal seas in the Arctic. Kwok and Comiso [53] constructed spatial structure of the correlation between the SST anomalies and southern oscillation index (SOI) and inferred that these were localized in Amundsen, Bellingshausen and Weddell Seas where positive (negative) phases of SOI were associated with cooler (warmer) SST. In the present study, it is found that Q and 2-month lagged Niño3.4 index exhibit a negative (positive) correlation south of about 45˚S (north of 45˚S). This suggests that the ACC region is strongly influenced by the remote forcing. This may have a significant impact not only on the climatic indices such as surface pressure, SST, chlorophyll and sea-ice which leads to interannual variability in the form of ACW, but also on the species that adapt to the midlatitudes. Stammerjohn et al. [54] pointed out that a longer sea-ice season in coastal Antarctic regions (6.8 - 7.9 months) versus a shorter sea-ice season over the shelf (4.1 - 5.3 months) imposes large perturbations in the seasonality of the marine habitat which occurs in association with ENSO and SAM variability. The local atmospheric response to these climate modes is largely a strengthening of the meridional winds from spring to autumn, which in turn affect the timing of the sea-ice retreat and subsequent advance.
Acknowledgements
The scatterometer wind data was provided by IFREMER; SST and Numerical weather forecasts were provided by the NOAA/OAR/ESRL PSD, Boulder, Colorado, USA, through their website www.esrl.noaa.gov. COARE flux code was obtained from http://coaps.fsu.edu/COARE/flux_algor/flux.html. This is NCAOR contribution 03/2014.
References
- Rintoul, S.R., Hughes, C. and Olbers, D. (2001) The Antarctic Circumpolar Current System. In: Siedler, G., Church, J. and Gould, J., Eds., Ocean Circulation and Climate: Observing and Modelling the Global Ocean, Academic, San Diego, 271-302. http://dx.doi.org/10.1016/S0074-6142(01)80124-8
- White, W.B. (2000) Influence of the Antarctic Circumpolar Wave on Australian precipitation from 1958-1996. Journal of Climate, 13, 2125-2141. http://dx.doi.org/10.1175/1520-0442(2000)013<2125:IOTACW>2.0.CO;2
- White, W.B. and Peterson, R. (1996) An Antarctic Circumpolar Wave in Surface Pressure, Wind, Temperature, and Sea Ice Extent. Nature, 380, 699-702. http://dx.doi.org/10.1038/380699a0
- Simmonds, I. (2003) Modes of Atmospheric Variability over the Southern Ocean. Journal of Geophysical Research, 108, SOV 5-1-SOV 5-30. http://dx.doi.org/10.1029/2000JC000542
- Schmitz Jr., W.J. (1996) On the World Ocean Circulation: Volume I. Technical Report WHOI-96-03. Woods Hole Oceanographic Institution, Woods Hole.
- Cai, W., Baines, P.G. and Gordon, H.B. (1999) Southern Midto High-Latitude Variability, a Zonal Wavenumber-3 Pattern, and the Antarctic Circumpolar Wave in the CSIRO Coupled Model. Journal of Climate, 12, 3087-3104. http://dx.doi.org/10.1175/1520-0442(1999)012<3087:SMTHLV>2.0.CO;2
- Yuan, X.J. and Martinson, D.G. (2000) Antarctic Sea Ice Extent Variability and Its Global Connectivity. Journal of Climate, 13, 1697-1717. http://dx.doi.org/10.1175/1520-0442(2000)013<1697:ASIEVA>2.0.CO;2
- Nuncio, M., Luis A.J. and Yuan, X. (2011) Topographic Meandering of the Antarctic Circumpolar Current and the Antarctic Circumpolar Wave in Ice-Ocean-Atmosphere System. Geophysical Research Letters, 38. http://dx.doi.org/10.1029/2011GL046898
- Yuan X.J., Martinson, D.G. and Liu, W.T. (1999) Effect of Air-Sea-Ice Interaction on Southern Ocean Subpolar Storm Distribution. Journal of Geophysical Research, 104, 1991-2007. http://dx.doi.org/10.1029/98JD02719
- Hellerman, S. and Rosenstein, M. (1993) Normal Monthly Wind Stress over the World Ocean with Error Estimates. Journal of Physical Oceanography, 13, 1093-1104. http://dx.doi.org/10.1175/1520-0485(1983)013<1093:NMWSOT>2.0.CO;2
- Gill, A.E. (1977) Coastally Trapped Waves in the Atmosphere. Quarterly Journal of the Royal Meteorological Society, 103, 431-440. http://dx.doi.org/10.1002/qj.49710343704
- Stramma, L. and Lutjeharms, J.R.E. (1997) The Flow Field of the Subtropical Gyre in the South Indian Ocean into the Southeast Atlantic Ocean: A Case Study. Journal of Geophysical Research, 99, 14053-14070.
- Levitus, S., Antonov, J.I., Boyer, T.P., Locarnini, R.A., Garcia, H.E. and Mishonov, A.V. (2009) Global Ocean Heat Content 1955-2008 in Light of Recently Revealed Instrumentation Problems. Geophysical Research Letters, 36, Article ID: L07608. http://dx.doi.org/10.1029/2008GL037155
- Rahmstorf, S., Foster, G. and Cazenave, A. (2012) Comparing Climate Projections to Observations up to 2011. Environmental Research Letters, 7, Article ID: 044035.
- Gille, S.T. (2002) Warming of the Southern Ocean since the 1950s. Science, 295, 1275-1277. http://dx.doi.org/10.1126/science.1065863
- Fairall, C.W., Bradley, E.F., Hare, J.E., Grachev, A.A. and Edson, J.B. (2003) Bulk Parameterization of Air-Sea Fluxes: Updates and Verification for the COARE Algorithm. Journal of Climate, 16, 571-591. http://dx.doi.org/10.1175/1520-0442(2003)016<0571:BPOASF>2.0.CO;2
- Brunke, M.A., Zeng, X. and Anderson, S. (2002) Uncertainties in Sea Surface Turbulent Flux Algorithms and Data Sets. Journal of Geophysical Research, 107, 5-1-5-21. http://dx.doi.org/10.1029/2001JC000992
- Luis, A.J. and Sudhakar, M. (2009) Upper-Ocean Hydrodynamics Along Meridional Sections in the Southwest Indian Ocean Sector of the Southern Ocean during Austral Summer 2007. Polar Science, 3, 13-30. http://dx.doi.org/10.1016/j.polar.2009.03.001
- Luis, A.J. and Pednekar, S.M. (2010) Hydrodynamics between Africa and Antarctica during Austral Summer 2008. Journal of Marine Systems, 83, 45-57. http://dx.doi.org/10.1016/j.jmarsys.2010.06.011
- Luis, A.J. and Ravindra, R. (2008) Quikscat-Based Momentum Flux Analysis over the Southern Ocean. Indian Journal of Marine Sciences, 37, 1-10.
- Belkin, I.M. and Gordon, A.L. (1996) Southern Ocean Fronts from the Greenwich Meridian to Tasmania. Journal of Geophysical Research, 101, 3675-3696. http://dx.doi.org/10.1029/95JC02750
- Orsi, A.H., Whitworth, T. and Nowlin Jr., W.D. (1995) On the Meridional Extent and Fronts of the Antarctic Circumpolar Current. Deep Sea Research Part I: Oceanographic Research Papers, 45, 641-673. http://dx.doi.org/10.1016/0967-0637(95)00021-W
- Wentz, F.J. and Smith, D.K. (1999) A Model Function for the Ocean Normalized Radar cross Section at 14 GHz Derived from NSCAT Observations. Journal of Geophysical Research, 104, 11499-11514. http://dx.doi.org/10.1029/98JC02148
- Ebuchi, N., Graber, H.C. and Caruso, M.J. (2002) Evaluation of Wind Vectors Observed by QuikSCAT/SeaWinds Using Ocean Buoy Data. Journal of Atmospheric and Oceanic Technology, 19, 2049-2062. http://dx.doi.org/10.1175/1520-0426(2002)019<2049:EOWVOB>2.0.CO;2
- Bentamy, A., Quilfen, Y. and Flament, P. (2002) Scatterometer Wind Fields—A New Release over the Decade 1991- 2001. Canadian Journal of Remote Sensing, 28, 431-449. http://dx.doi.org/10.5589/m02-041
- Wentz, F.J., Smith, D.K., Mears, C.A. and Gentemann, C.L. (2001) Advanced Algorithms for QuikSCAT and SeaWinds/AMSR. Paper presented at IGARSS’01, Institute of Electrical and Electronics Engineers, Sydney.
- Bourassa, M.A., Legler, D.M., O’Brien, J.J. and Smith, S.R. (2003) SeaWinds Validation with Research Vessels. Journal of Geophysical Research, 108, 3019. http://dx.doi.org/10.1029/2001JC001028
- Kara, A.B., Wallcraft, A.J., Barron, C.N., Hurlburt, H.E. and Bourassa, M.A. (2008) Accuracy of 10 m Winds from Satellites and NWP Products near Land-Sea Boundaries. Journal of Geophysical Research, 113, Article ID: C10020. http://dx.doi.org/10.1029/2007JC004516
- Reynolds, R.W., Rayner, N.A., Smith, T.M., Stokes, D.C. and Wang, W. (2002) An Improved in Situ and Satellite SST Analysis for Climate. Journal of Climate, 15, 1609-1625. http://dx.doi.org/10.1175/1520-0442(2002)015<1609:AIISAS>2.0.CO;2
- Kalnay, E., et al. (1996) The NCEP/NCAR 40-Year Reanalysis Project. Bulletin of the American Meteorological Society, 77, 437-471. http://dx.doi.org/10.1175/1520-0477(1996)077<0437:TNYRP>2.0.CO;2
- Ponte, R.M. and Dorandeu, J. (2003) Uncertainties in ECMWF Surface Pressure Fields over the Ocean in Relation to Sea Level Analysis and Modeling. Journal of Atmospheric and Oceanic Technology, 20, 301-307. http://dx.doi.org/10.1175/1520-0426(2003)020<0301:UIESPF>2.0.CO;2
- Luis, A.J. and Kawamura, H. (2002) Mechanism for Sea Surface Temperature Cooling in the Gulf of Oman during Winter. Geophysical Research Letters, 29, 16-1-16-4. http://dx.doi.org/10.1029/2001GL014148
- Liu, W.T., Katsaros, K.B. and Businger, J.A. (1979) Bulk Parameterization of Air-Sea Exchanges of Heat and Water Vapor Including the Molecular Constraints at the Interface. Journal of the Atmospheric Sciences, 36, 1722-1735. http://dx.doi.org/10.1175/1520-0469(1979)036<1722:BPOASE>2.0.CO;2
- Fairall, C.W., Bradley, E.F., Rogers, D.P., Edson, J.B. and Young, G.S. (1996) Bulk Parameterization of Air-Sea Fluxes for Tropical Ocean-Global Atmosphere Coupled-Ocean Atmosphere Response Experiment. Journal of Geophysical Research: Oceans, 101, 3747-3764. http://dx.doi.org/10.1029/95JC03205
- Webb, E.K., Pearman, G.I. and Leuning, R. (1980) Correction of Flux Measurements for Density Effects Due to Heat and Water Vapour Transfer. Quart. Quarterly Journal of the Royal Meteorological Society, 106, 85-100. http://dx.doi.org/10.1002/qj.49710644707
- Emery, W.J. and Thomson, R.E. (2001) Data Analysis and Methods in Physical Oceanography. Elsevier, New York, 638.
- Fang, G., Chen, H., Wei, Z, Wang, Y., Wang, X. and Li, C. (2006) Trends and Interannual Variability of the South China Sea Surface Winds, Surface Height, and Surface Temperature in the Recent Decade. Journal of Geophysical Research, 111, Article ID: C11S16. http://dx.doi.org/10.1029/2005JC003276
- Thompson, D.W.J. and Wallace, J.M. (2000) Annual Modes in the Extratropical Circulation. Part I: Month-to-Month Variability. Journal of Climate, 13, 1000-1016. http://dx.doi.org/10.1175/1520-0442(2000)013<1000:AMITEC>2.0.CO;2
- Thompson, D.W.J., Wallace, J.M. and Hegerl, G.C. (2000) Annular Modes in the Extratropical Circulation. Part II: Trends. Journal of Climate, 13, 1018-1036. http://dx.doi.org/10.1175/1520-0442(2000)013<1018:AMITEC>2.0.CO;2
- Barnes, E.A. and Hartmann, D.L. (2010) Dynamical Feedbacks of the Southern Annular Mode in Winter and Summer. Journal of the Atmospheric Sciences, 67, 2320-2330. http://dx.doi.org/10.1175/2010JAS3385.1
- Sallée, J.B., Speer, K.G., Rintoul, S.R. (2010) Zonally Asymmetric Response of the Southern Ocean Mixed-Layer Depth to the Southern Annular Mode. Nature Geoscience, 3, 273-279. http://dx.doi.org/10.1038/ngeo812
- Luis, A.J. and Pandey, P.C. (2004) Seasonal Variability of QSCAT-Derived Wind Stress over the Southern Ocean. Journal of Geophysical Research, 31, Article ID: L13304. http://dx.doi.org/10.1029/2003GL019355
- Rouault, M., Reason, C.J.C., Lutjeharms, J.R.E. and Belaars, A. (2003) NCEP and ECMWF Reanalyses Underestimate Latent and Sensible Heat Fluxes above the Agulhas Current. Journal of Climate, 16, 776-782. http://dx.doi.org/10.1175/1520-0442(2003)016<0776:UOLASH>2.0.CO;2
- Cresswell, G.R. and Griffin, D.A. (2004) The Leeuwin Current, Eddies, and Sub-Antarctic Waters off South-Western Australia. Marine and Freshwater Research, 55, 267-276. http://dx.doi.org/10.1071/MF03115
- Hansen, J. and Lebedeff, S. (1987) Global Trends of Measured Surface Air Temperature. Journal of Geophysical Research, 92, 13345-13372. http://dx.doi.org/10.1029/JD092iD11p13345
- Huang, R.X., Wang, W. and Liu, L.L. (2006) Decadal Variability of Wind-Energy Input to the World Ocean. Deep Sea Research Part II: Topical Studies in Oceanography, 53, 31-41. http://dx.doi.org/10.1016/j.dsr2.2005.11.001
- Lutjeharms, J.R.E. and van Ballegooyen, R.C. (1988) The Retroflection of the Agulhas Current. Journal of Physical Oceanography, 18, 1570-1583. http://dx.doi.org/10.1175/1520-0485(1988)018<1570:TROTAC>2.0.CO;2
- Boebel, O., Lutjeharms, J.R.E., Schmid, C., Zenk, W., Rossby, T., Barron, C. (2003) The Cape Cauldron: A Regime of Turbulent Inter-Ocean Exchange. Deep Sea Research Part II: Topical Studies in Oceanography, 50, 57-86. http://dx.doi.org/10.1016/S0967-0645(02)00379-X
- Behera, S.K. and Yamagata, T. (2001) Subtropical SST Dipole Events in the Southern Indian Ocean. Geophysical Research Letters, 28, 327-330. http://dx.doi.org/10.1029/2000GL011451
- Yang, X.-Y., Huang, R.X., Wang, D.X. (2007) Decadal Changes of Wind Stress over the Southern Ocean Associated with Antarctic Ozone Depletion. Journal of Climate, 20, 3395-3410. http://dx.doi.org/10.1175/JCLI4195.1
- Levermann, A., Griesel, A., Hofmann, M., Montoya, M. and Rahmstorf, S. (2005) Dynamic Sea Level Changes Following Changes in the Thermohaline Circulation. Climate Dynamics, 24, 347-354. http://dx.doi.org/10.1007/s00382-004-0505-y
- Venegas, S.A. and Drinkwater, M.R. (2001) Sea Ice, Atmosphere and Upper Ocean Variability in the Weddell Sea, Antarctic. Journal of Geophysical Research, 106, 16747-16765. http://dx.doi.org/10.1029/2000JC000594
- Kwok, R. and Comiso, J.C. (2002) Southern Ocean Climate and Sea Ice Anomalies Associated with the Southern Oscillation. Journal of Climate, 15, 487-501. http://dx.doi.org/10.1175/1520-0442(2002)015<0487:SOCASI>2.0.CO;2
- Stammerjohn, S.E., Martinson, D.G., Smith, R.C. and Iannuzzi, R.A. (2008) Sea Ice in the Western Antarctic Peninsula Region: Spatio-Temporal Variability from Ecological and Climate Change Perspectives. Deep Sea Research Part II: Topical Studies in Oceanography, 55, 2041-2058. http://dx.doi.org/10.1016/j.dsr2.2008.04.026