Atmospheric and Climate Sciences
Vol.3 No.4(2013), Article ID:37125,6 pages DOI:10.4236/acs.2013.34056
Surface Temperature Anomalies in the River Niger Basin Development Authority Areas, Nigeria
1Department of Geography, Adeyemi College of Education, Ondo, Nigeria
2Department of Physics, Adeyemi College of Education, Ondo, Nigeria
Email: rufus782000@yahoo.com
Copyright © 2013 Joseph Sunday Babatolu, Rufus Temidayo Akinnubi. This is an open access article distributed under the Creative Commons Attribution License, which permits unrestricted use, distribution, and reproduction in any medium, provided the original work is properly cited.
Received August 2, 2013; revised September 1, 2013; accepted September 9, 2013
Keywords: Temperature; Anomalies; River Niger Basin Development Authority Area
ABSTRACT
The study investigates the trends in temperature in the Upper and Lower Niger Basin Development Authority Areas using standardized Anomaly Index, Gaussian Low Pass and Spearman’s correlation coefficient. From the data collected and analyzed, the mean annual temperature and mean annual maximum temperature demonstrated pronounced temporal increasing trend in the period 1951-2010 while the mean annual minimum temperature showed no trend. The rate of increase in mean annual temperature, mean annual maximum and minimum temperatures was 0.45˚C, 0.40˚C and 0.20˚C respectively. The mean annual maximum temperature warmed faster than the mean annual minimum leading to increase in diurnal range of temperature. The annual temperature anomaly in the study area tracks the observed anomalies for the Northern Hemisphere in the 20th century. The decadal temperature increase is very small particularly as from 1980.
1. Introduction
Global warming is occurring worldwide and almost all climate scientists today believe that it is primarily caused by increases in the amount of greenhouse gases in the atmosphere produced by human activities such as burning of fossil fuels and deforestation [1,2]. Global warming is certain as it is now evident from shift in temperature and precipitation patterns, widespread melting of snow and ice, increasing incidents of weather extremes (e.g. Flood, drought, heat wave) and rising mean sea level.
Observations of surface air temperature in weather stations indicate that global mean surface air temperature increased about 0.4˚C since early 1970’s. Parner [3] concluded that the earth’s average surface temperature rose by 0.74 over the period 1960-2005 with a more rapid warming trend over the past 50 years. Also land temperatures have been found to increase about twofold as fast as ocean temperatures: 0.25˚C per decade against 0.13˚C per decade since 1979. Surface temperature has increased by about 0.7˚C since the beginning of Industrial Revolution and this trend is accelerating with average global mean temperature rising at 0.2˚C per decade [3]. Widespread changes in extreme temperatures have been observed over the last 50 years. Current estimates by the Climate Research Unit show 2005 as the second year behind 1998, with 2003 and 2010 as the third warmest year (http://www.cru.uea.ac.uk/cru/info/warming/Retrieved 2011).
However, recent estimates by NASA’s Goddard Institute for Space Studies show that 2005 and 2010 are the warmest year in planets since reliable widespread instrumental measurements became available in the late 19th century exceeding 1998 by a few hundredths of a degree. Although the magnitude of warming varies locally, the warming trend is widespread. Shen [4] observed a cooling trend in the south-western China and Tibetan Plateau and a clear warming trend in North China. Babatolu [5] reported an increase of 0.6˚C in Ondo, Nkemdirim [6] reported that data collected in 1987 showed that warming in excess of 2˚C was as prevalent in the tropics as it was in the temperate latitudes.
A decrease in the diurnal range was identified in the U.S where large area trends showed that maximum temperatures have remained constant or increased only slightly, whereas minimum temperatures have increased at a faster rate [7,8]. The mean temperature in southern China has decreased by 0.8˚C from 1950s to 1980s. It has been observed that temperatures are rising on the African landmass. Colloer [9] observed that Africa is warming faster than the global average and this is likely to continue. Warming has been at an average rate of about 0.5˚C in Africa through the twentieth century with the six warmest years having occurred since 1987, similar to patterns in the rest of the world [10]. From instrumental temperature records, a greater warming trend since the 1960s has been observed although the changes vary from one region to others. Based on the review of a number of studies, Boko [11] observed that there has been a decadal warming rate of 0.29˚C in African tropical forests and 0.10˚C - 0.3˚C in South Africa. He also found that in Ethiopia and South Africa, minimum temperatures have increased slightly faster than maximum or mean temperatures; between 1961 and 2000, there was an increase in the number of warm spells over Southern and Western Africa and a decrease in the number of extremely cold days, while in Eastern Africa there have been some decreasing trends in temperature.
While it is obvious that warming trend is spatially widespread, the magnitude of warming varies locally making empirical studies of climate change at regional and national levels imperative. This study is to fill this gap. Unlike rainfall variability which is well documented in Africa and Nigeria, empirical studies on air temperature trends are very scanty in the country. This study, therefore documents air temperature trends in the Upper and Lower River Niger Basin Development Authority Areas in Nigeria.
2. Materials and Method
2.1. The Study Area
The Upper and Lower River Niger Basin Development Authority Areas (U&LNRBDA) lie mainly between latitudes 7˚N and 12˚N and between longitudes 3˚E and 9˚E in Nigeria (Figure 1). The relief is made up of low pla-
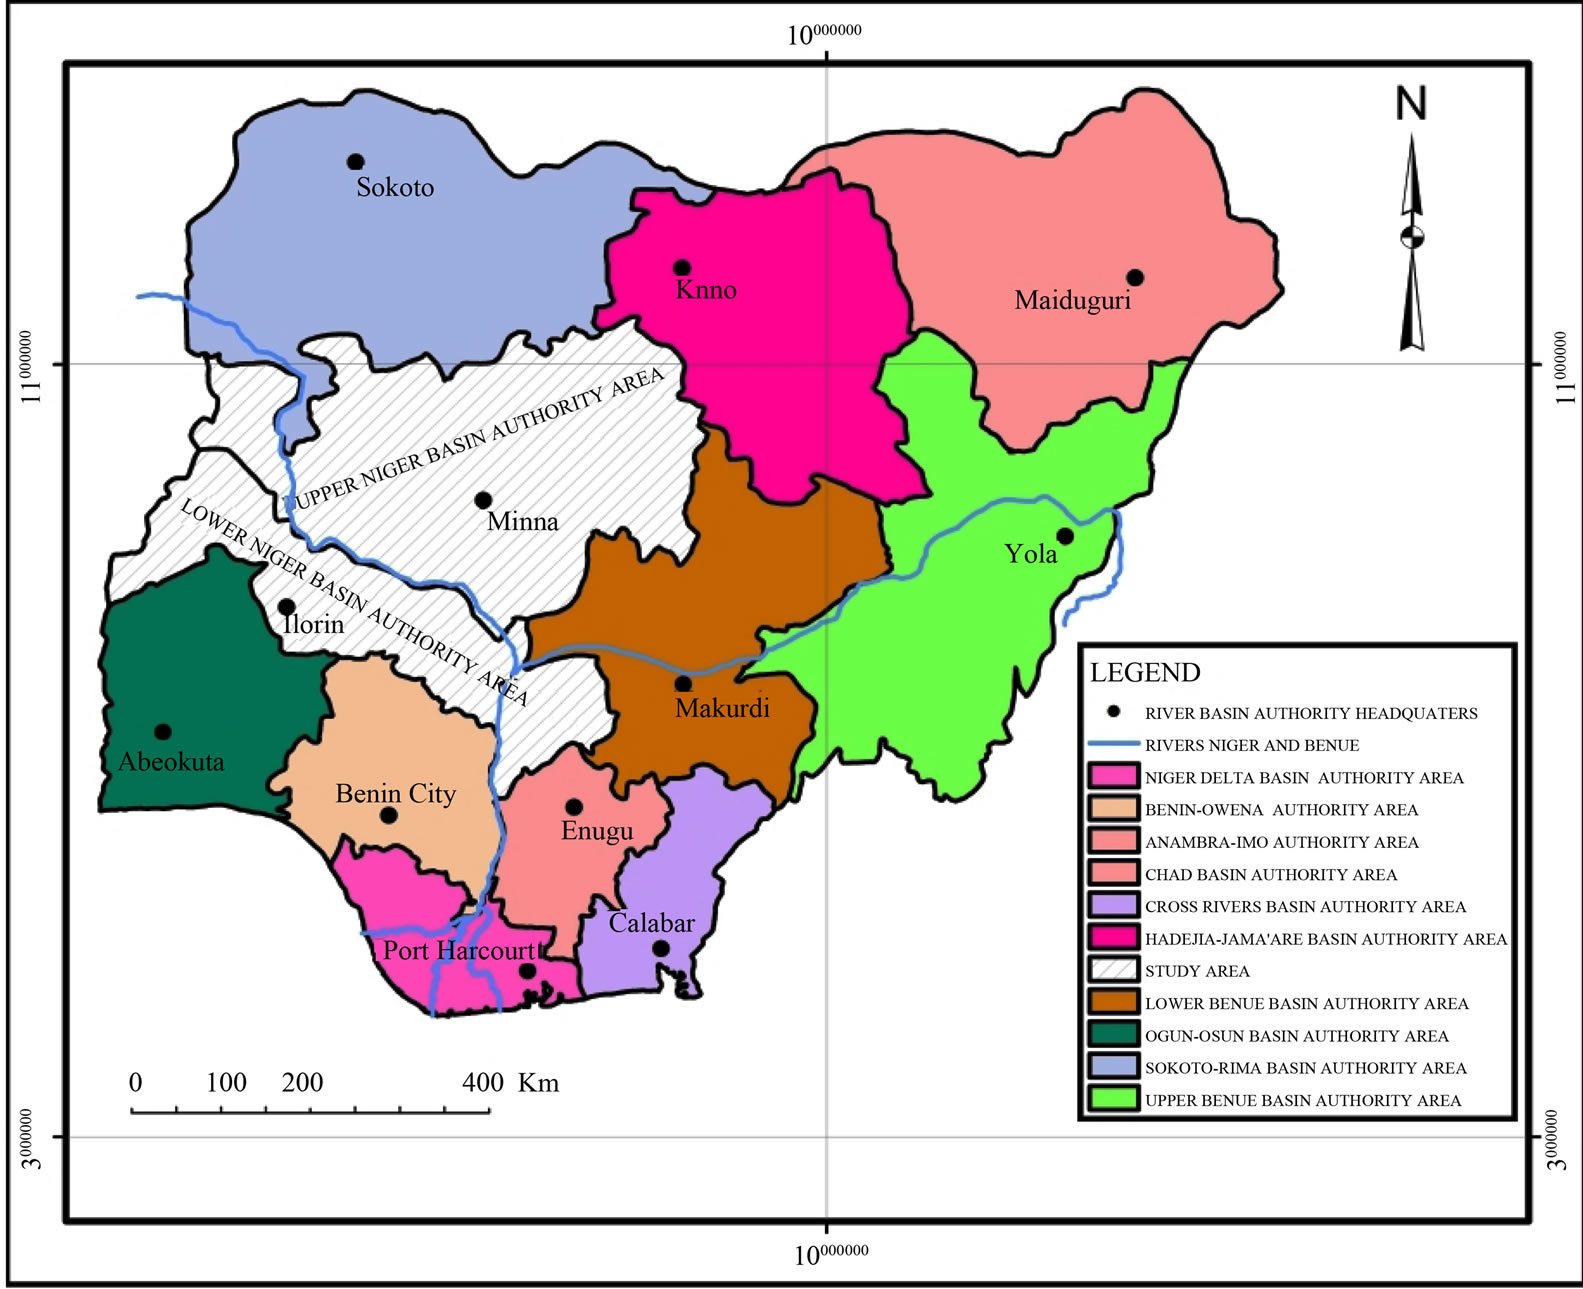
Figure 1. Map of Nigeria showing the Upper and Lower Niger River Basin development authorities.
teau in the northern and eastern part while the southern and western parts are occupied by low hills with an average height of about 600 metres above sea level. These two highlands are separated by the Niger Trough in which older sedimentary rocks were deposited.
U&LNRBDA has wet and dry climates which are respectively associated with prevalence of the moist maritime south-westerly monsoon from the Atlantic Ocean and the dry continental north-easterly wind from the Sahara desert. The sequence of weather types experienced in this region during the course of a given year is determined primarily by the surface position of the Inter Tropical Discontinuity. The data collected for the base period show that the mean rainfall ranges between 1000 m in the north to 130 mm in the north-east while the mean annual temperature ranges between 27˚C in the south to 22˚C in the northeast.
The vegetation of the study area is mainly grassland decreasing in luxuriance northward away from the equator.
2.2. Data Collection
The data base used in this study consists of individual monthly minimum, maximum and annual mean temperatures from 1951-2010 for six stations (Figure 2)
collected from the archives of the Nigeria Meteorological Agency, Oshodi. The stations selected are those that possess complete data set for the base period and also show adequate spatial distribution.
2.3. Data Analysis
Each of the station mean, annual mean, annual minimum and mean annual maximum temperature series were analyzed for fluctuation using Standardized Anomaly Index (SAI) which is a commonly used index for regional climate change studies. Station temperature is expressed as a standardized departure  from the longterm mean (i.e. the mean of the base period), calculated as:
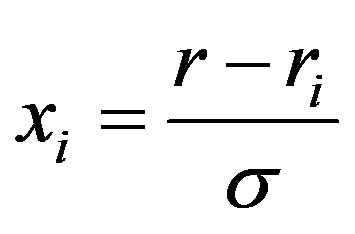
where r is the mean temperature in the year, ri is the long-term mean, and σ is the standard deviation of annual mean temperature for the long-term mean. For a given region or zone, area integrated temperature R is calculated as
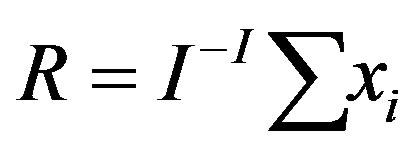
where I is the number of stations and summation is made over all I stations. Thus, a value of I indicates an average
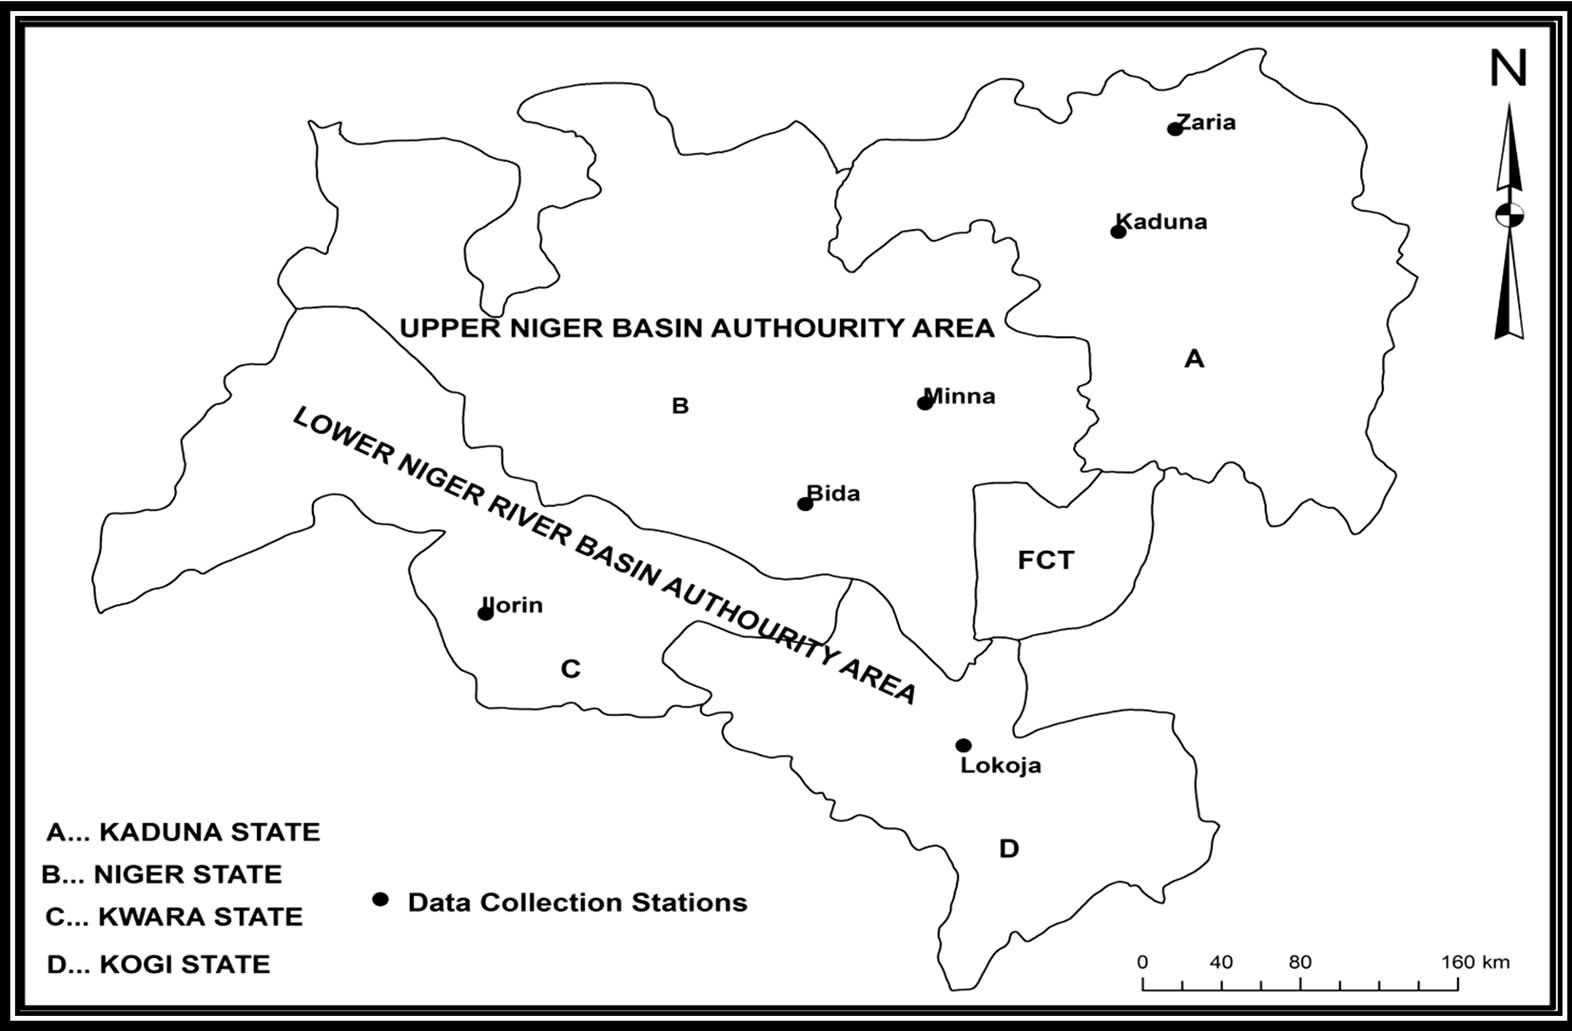
Figure 2. Map of the Upper and Lower Niger River Basin development authorities showing climate data collection stations.
regional anomaly of one standard deviation from the mean.
The regional temperature series were also investigated for trends using Spearman’s rank correlation coefficient.
3. Result and Discussion
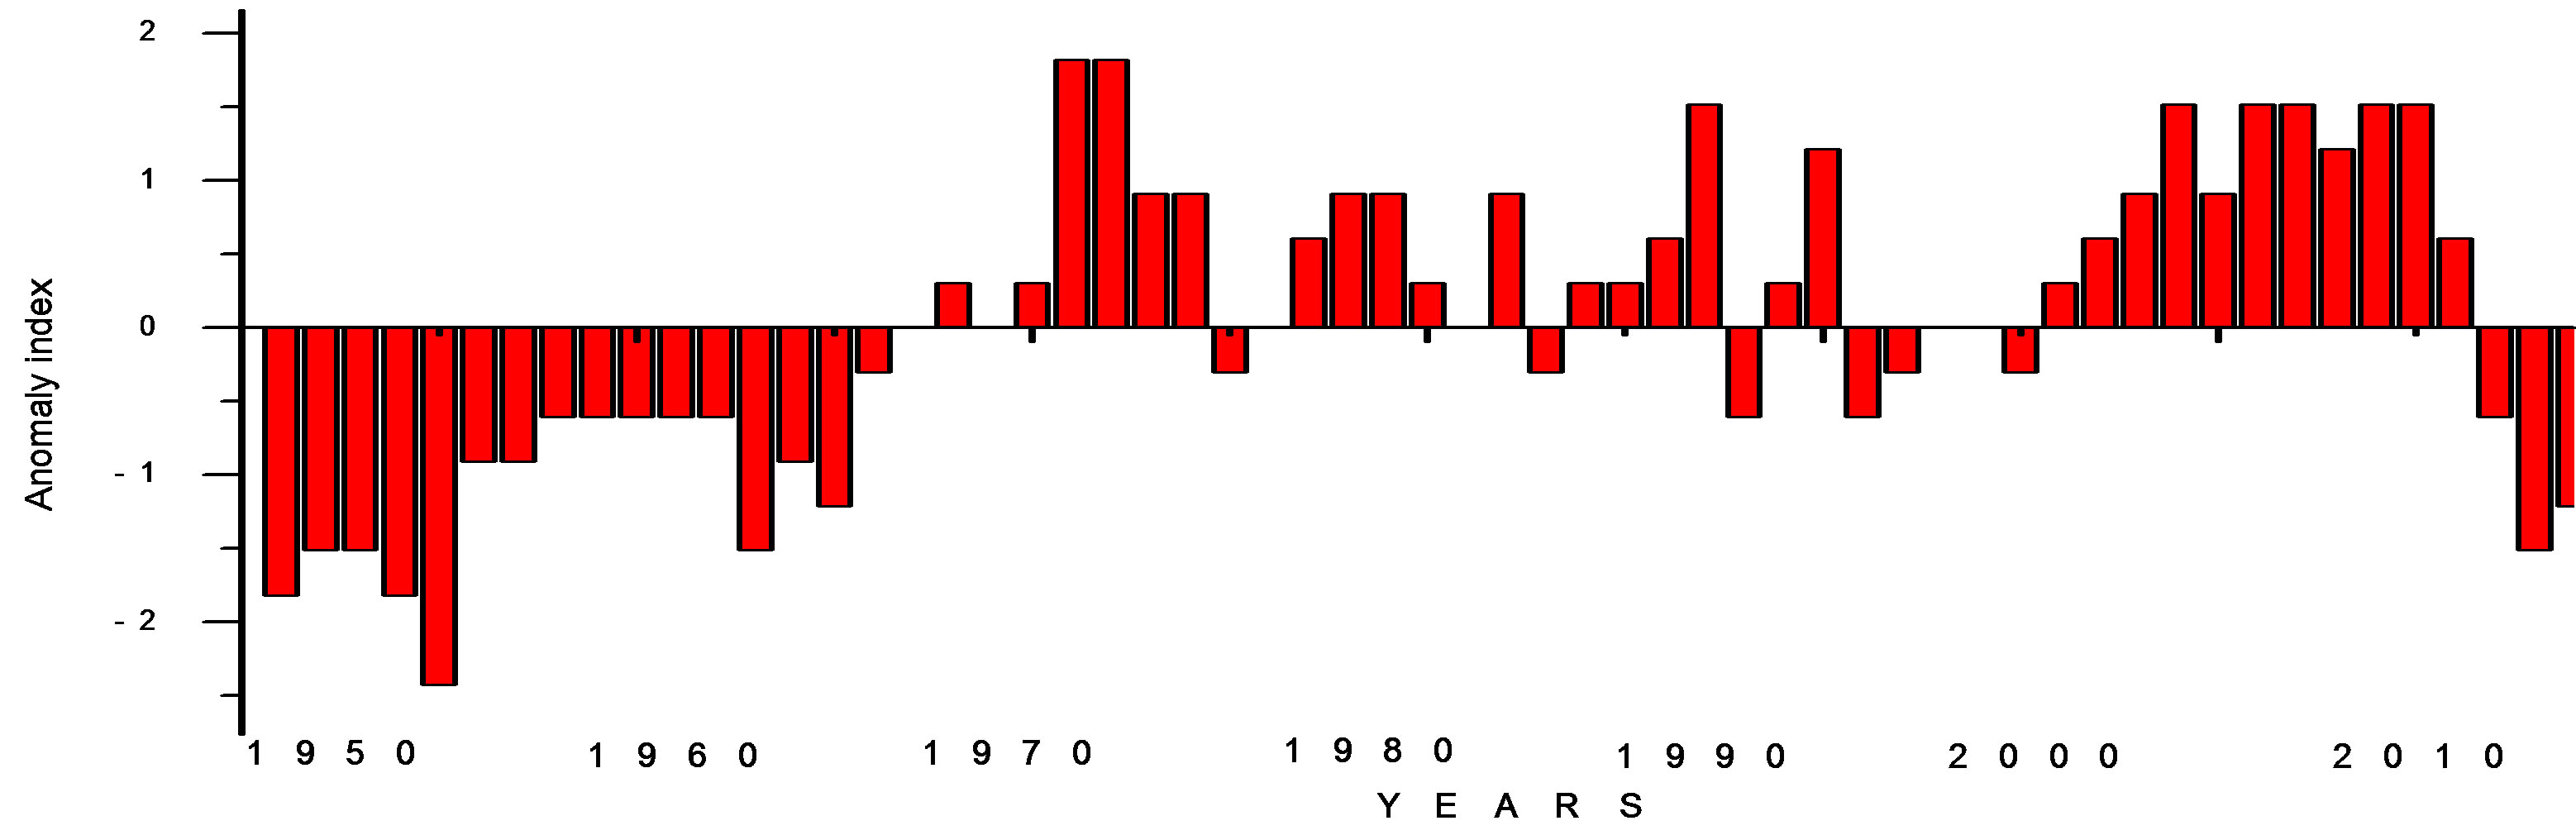
The temperature anomalies which occur in the U& LNRBDA during 1951-2010 periods are described for the mean annual, mean annual maximum and minimum temperatures. Figure 3 shows two distinct patterns of temperature anomalies-a period when below long-term average was dominated (cooling) and a period when above long-term average was most persistent (warming). For mean annual temperature, the period 1951-66 was marked with below long-term average indicating a period of cooling. The remarkable thing about this period is that the cooling which start from 1951 continued with no respite till 1966. In contrast, above average mean annual temperature was observed for the period 1967-2007. Temperatures increased steadily with few respites and from 1996 above average temperatures were very consistent till 2007. During this 45-year period only seven years have below average temperature.
The anomalies in the mean annual maximum temperature followed the patterns of the mean annual temperature anomalies (Figure 3(b)), below long-term average maximum temperatures persisted during the period spanning 1951-70. This period has only three years of above average temperature (1957, 1961 and 1967). There is preponderance of warm years in the period 1971-2007 with only six years recording below average temperatures. Most of the years of this period experienced strong positive departures.
Figure 3(c) shows that it is short-term of below and above average temperature conditions of 2 - 5 years that characterized the mean annual minimum temperature
 (a)
(a)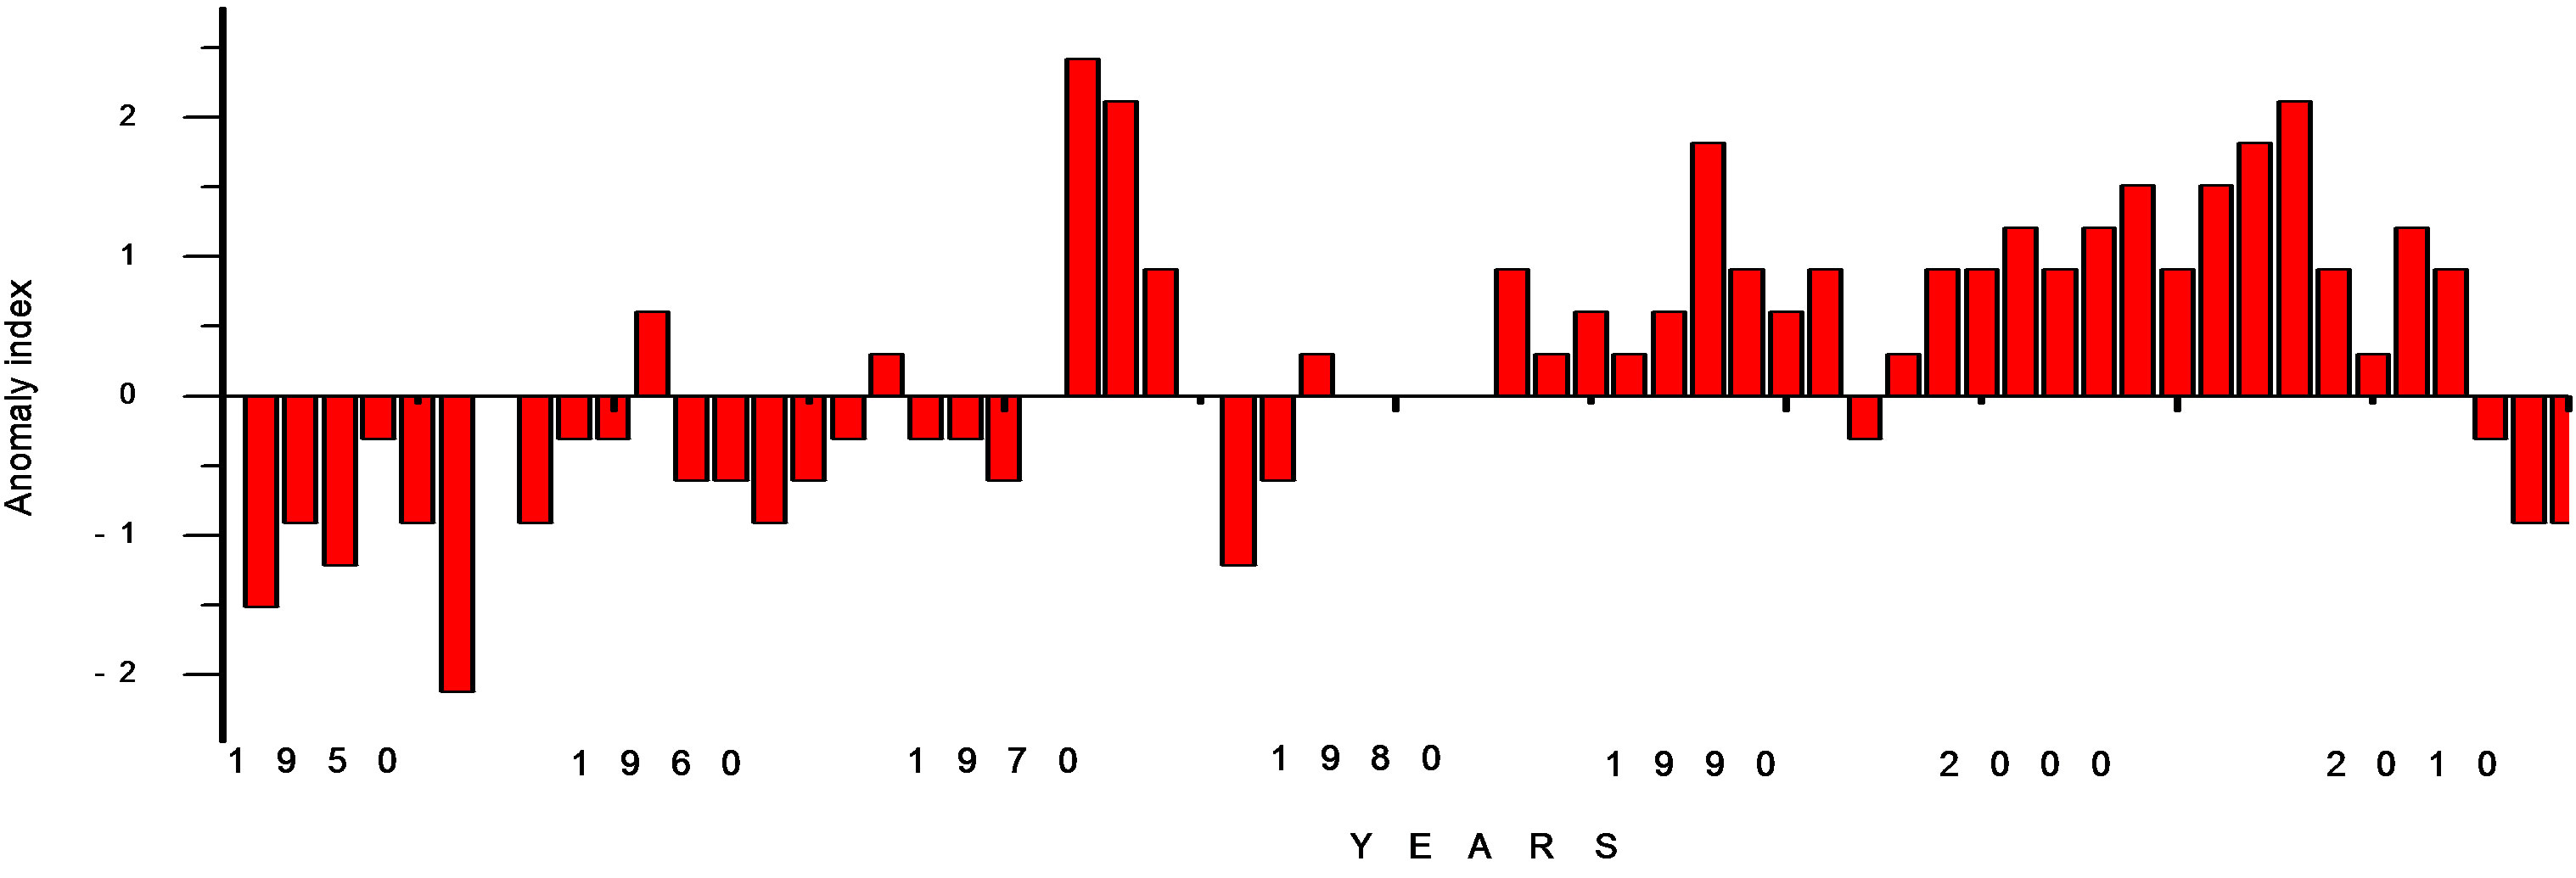 (b)
(b)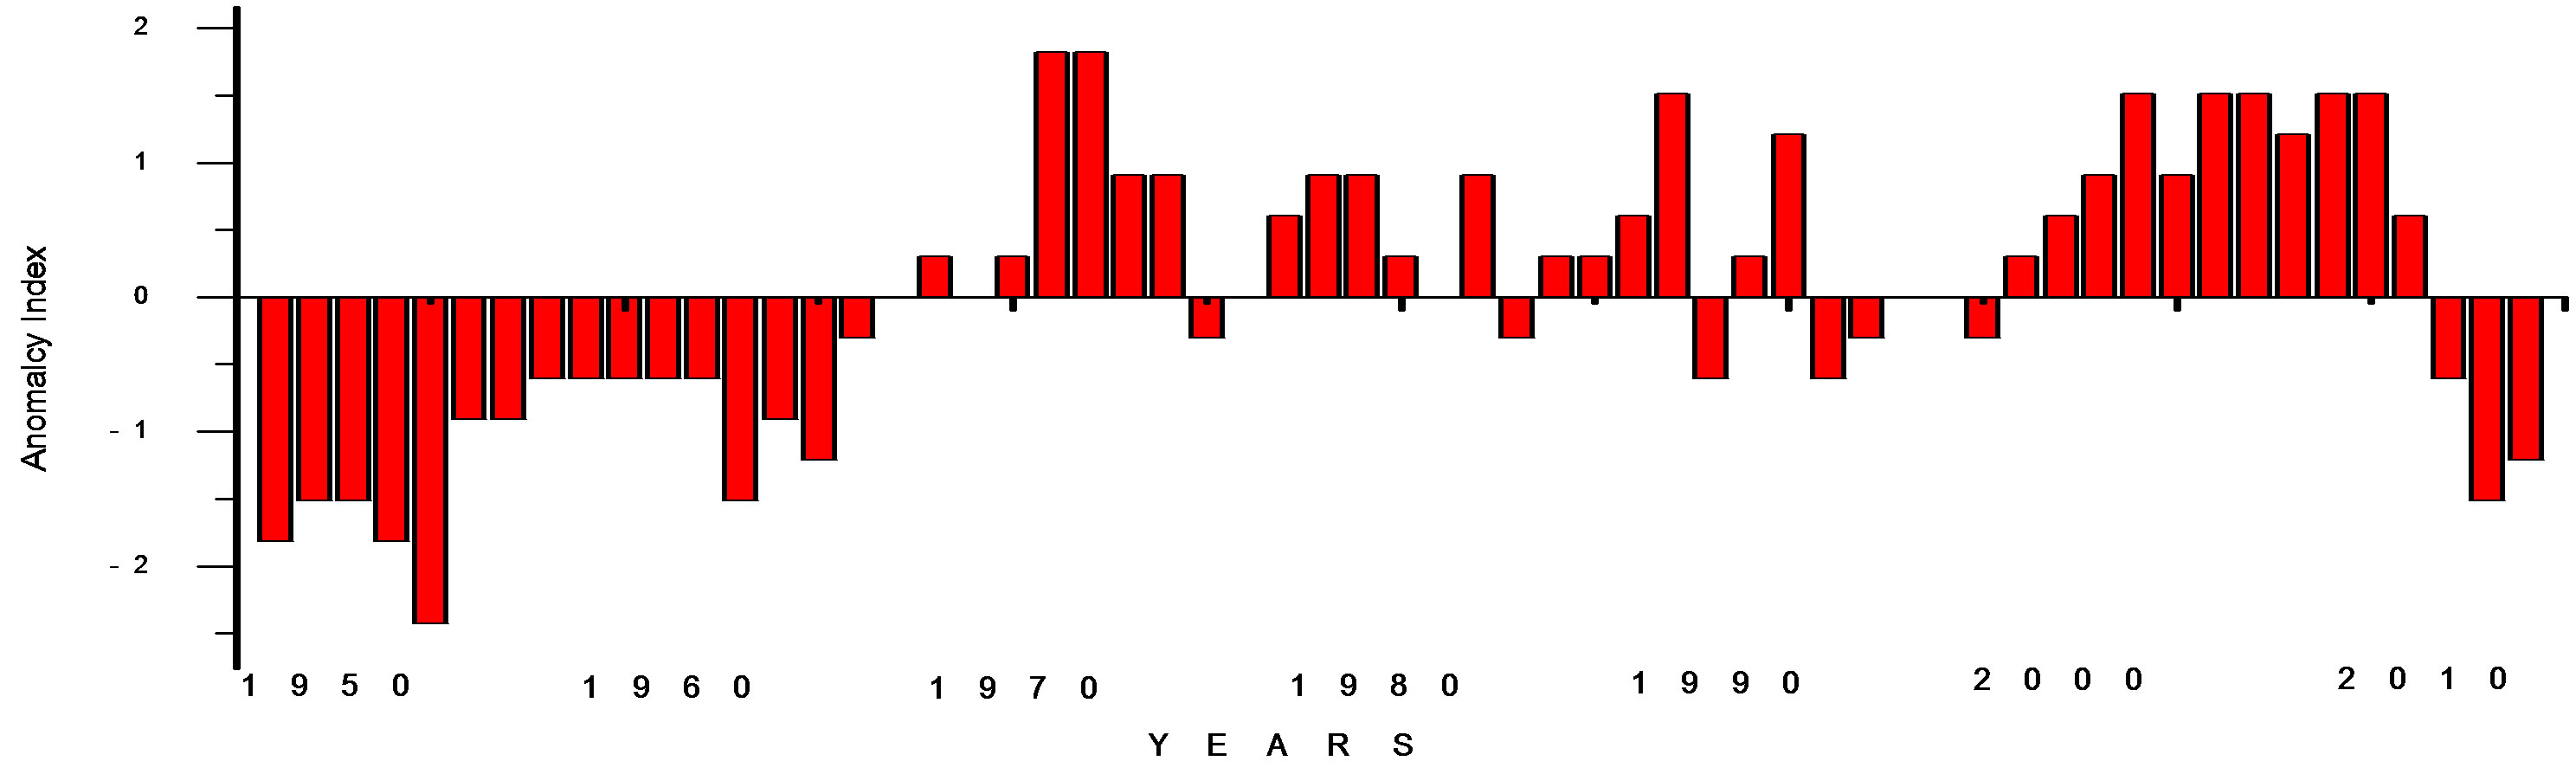 (c)
(c)
Figure 3. Annual mean annual temperature anomalies in the upper and lower Niger River Basin development Authority area.
variability during the period 1951-2010 in the study area. The year to year departures are not pronounced suggesting that they vary slightly about the mean. From Figure 3, it is observed that unlike rainfall in the U&LNRBDA, temperature series exhibit a marked persistence. With the exception of the mean annual minimum temperature series, they were characterized by decadal-scale variability.
The mean annual temperature and maximum temperature show similar changes and track the observed temperature trends for the northern hemisphere. A steady period of warming for Northern Hemisphere from 1910 through mid-1940s, gradual cooling from mid-1940s through mid-1970s, followed by steady temperatures thereafter [12,13].
The annual temperature series were further subjected to testing for dominant trends using Spearman’s correlation coefficient. The results in Table 1 show that there are significant warming trends for the mean annual temperature and mean annual maximum temperature in the period 1951-2010 while the mean annual minimum series demonstrate no pronounced temporal decreasing or increasing trends.
From analyses the mean annual temperature, mean annual maximum and minimum temperatures rose by 0.45˚C, 0.40˚C and 0.20˚C from 1951 to 2010 respectively (Figures 3(a) and (b)). Such a change is not surprising but it only proves that global warming can be revealed even at local scales. In terms of the rate of temperature rise, there is no evidence from the data that warming in the study area is faster than the global average as many scientists have predicted for Africa. Temperature measurements taken between 1960 and 2005 show a general rise of 0.74˚C [3].
The warming, however, was not consistent over the entire time period investigated. Rather, temperature rose from the lowest levels in the 1940s to their warmest level in 1970s where upon they remain fairly consistent for the last three decades (1981-2010). The situation in the study area, therefore, is not one of rapidly increasing temperature as many climate scientists have projected. Mean annual temperature records show 1970s decade (1971-80) was the warmest decade. The decadal increase in temperature in the study area was average 0.3˚C till 1980 but
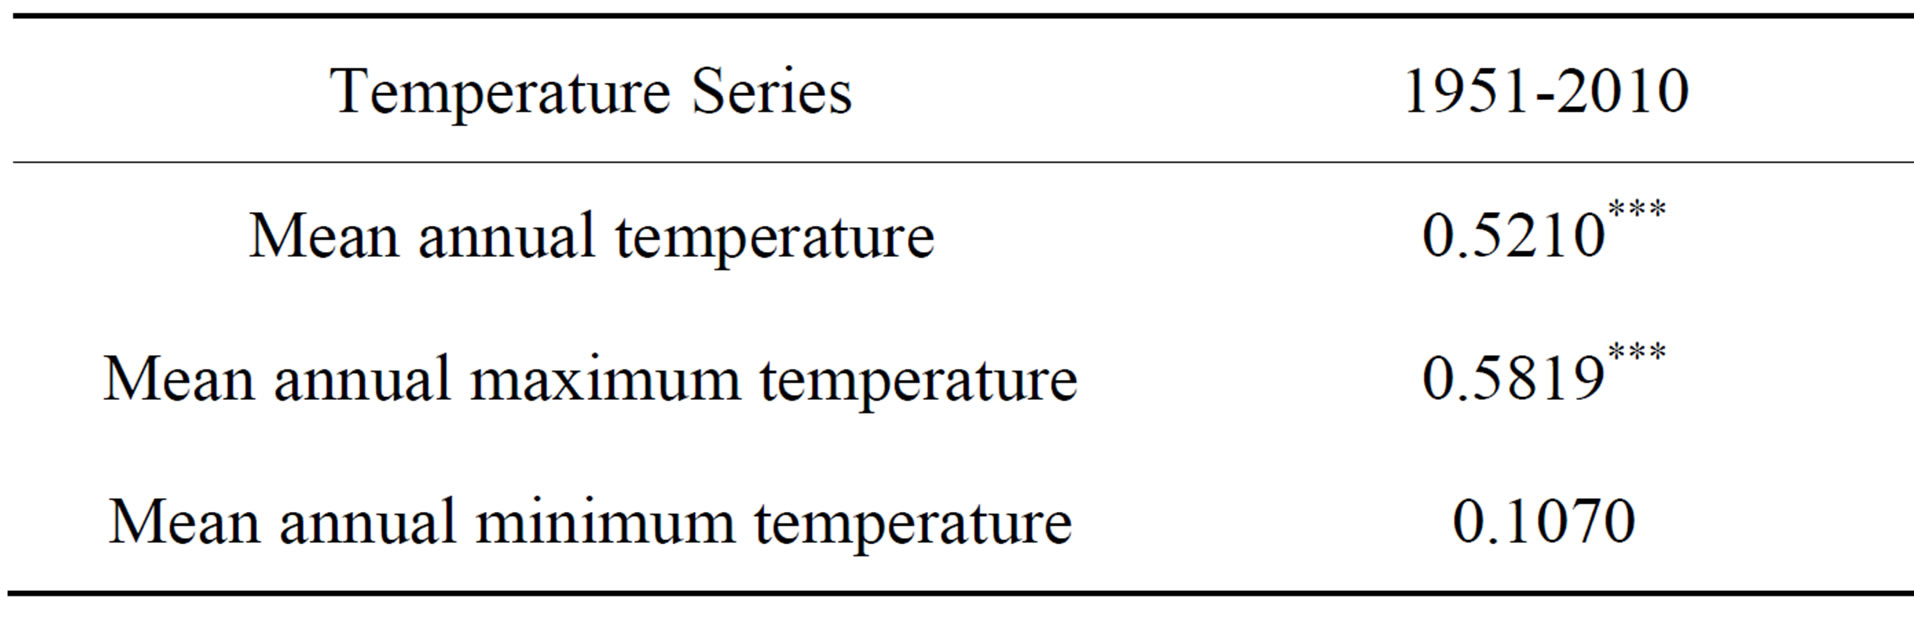
Table 1. Trends in mean annual temperature, mean annual maximum and minimum temperature series in the study area using spearman(s) correlation coefficient Test of significance Levels 90% (*), 95% (**), 99% (***).
in the period 1981-2010 the warming rate was very small and statistically insignificant. The warmest temperature of 0.5˚C above the 1961-90 mean (1961-90 reference periods) and 0.6˚C above the long-term means. Other high temperature years include 1971, 1987, 1990, 1999, 2001, 2002, 2003, 2004 and 2005. Out of these warmest years five are in the last decade of the study period (2001-2010). The period 2001-2010 (0.05˚C above 1961- 90 mean and 0.12˚C above long-term means) was 0.02˚C warmer than 1991-2000 decade (0.03˚C above 1961-90 mean and 0.1˚C above the long-term mean.
In the U&LNRBDA area the diurnal temperature has also increased. The difference between the mean annual maximum and annual mean minimum temperatures has increased in the past 30 years with a moderate increase in the mean annual maximum temperature and slight increase in the mean annual minimum temperature. The difference between the mean annual maximum and minimum temperatures increased by an average of 0.35˚C during the period 1951-2010. It can be concluded that the rate of warming in the study area is higher in the mean annual maximum temperature suggesting that the increase in temperature in the U&LNRBDA area is daytime bias.
4. Conclusions
The study demonstrated that the Upper and Lower Niger River Basin Development Authority Area experienced glaring warming trend in the period between 1951 and 2010. The warming trend which seems to commence in 1967 is consistent with the observed temperature trend in the Northern Hemisphere during the 20th century and gives one of the obvious signals of climate change. The rate of temperature increase is an average of 0.45˚C. The decadal temperature increase in the period 1981-201 is very small. Temperature increase in the study area is daytime bias.
The implication of the above result is that climate change is here with us, several research reports have consistently noted the vulnerability of the African continent to the impacts of climate change due to extreme poverty of many Africans, frequent natural disasters such as droughts and floods and agricultural systems heavily dependent on rainfall [4]. Droughts and floods, unpredictable and unreliable rainfall both in its timing and volume and scourge of malaria are already common occurrences in Nigeria. The core challenge for Nigeria therefore is to develop strategies and the capacity at the national, state and local government levels to assess and respond to vulnerability and resilience of sectors to climate change impacts.
5. Acknowledgements
The authors appreciated TETFUND whose financial support make this study possible. The authors also acknowledge the Nigeria Meteorological Agency for the temperature data.
REFERENCES
- R. J. Cicerone. “Current State of Climate Science: Recent Studies from the National Academics,” Reports of the President, National Academy of Sciences before the Committee on Energy and Natural Resources, US Senate, 2005.
- Intergovernmental Panel on Climate Change (IPCC), “Climate Change 2007: Impacts Adaptation and Vulnerability,” Contribution of Working Group II to the Fourth Assessment, Report of the Intergovernmental Panel Climate Change, Cambridge University Press, Cambridge, 2007.
- United Nationals Development Programme (UNDP), “Human Development Report, 2007/2008: Fighting Climate Change: Human Solidarity in a Divided World,” Palgrave Macmillan, New York, 2007.
- D. Shen and O. Varis, “Climate Change in China,” Ambio, Vol. 30, No. 6, 2001, pp. 381-383.
- J. S. Babatolu, “Warming Trends and Its Management Strategies in Nigeria: A Case Study of Ondo Nigeria,” Ondo Journal of Arts and Social Sciences, Vol. 3, No. 1, 2001, pp. 10-19.
- L. G. Nkemdirim, “The Tropics and the Greenhouse Effect,” The Subcommision on Tropical Climate of the International Geographical Unions Commission on Climatology Bulletin, Vol. 1, No. 2, 1991, pp. 23-25.
- D. R. Easterling, B. Horton, P. D. Jones, T. C. Peterson, T. R. Karl, D. E. Parver, M. J. Salinger, V. Razuvaer, P. Plummer, R. Jamason and C. K. Folland, “Maximum and Minimum Temperature Trends for the Globe,” Science, Vol. 277, No. 5324, 1997, pp. 364-367. http://dx.doi.org/10.1126/science.277.5324.364
- J. M. Melillo, “Warm, Warm on the Range,” Science, Vol. 283, No. 5399, 1999, pp. 183-184. http://dx.doi.org/10.1126/science.283.5399.183
- P. Collier, G. Conway and T. Venable, “Climate Change and Africa,” Oxford Review of Economic Policy, Vol. 24, No. 2, 2008, pp. 337-353. http://dx.doi.org/10.1093/oxrep/grn019
- M. Hulme, R. Doherty, T. Ngar, M. New and D. Lister, “African Climate Change: 1900-2100,” Climate Research, Vol. 17, No. 2, 2001, pp. 145-168. http://dx.doi.org/10.3354/cr017145
- M. Boko, I. Niang, A. Nyong, C. Vogel, C. A. Cutheko, M. Medany, B. Osman-Elasha, R. Tobo, P. Yonda, “Africa in: Parry in Canzianio,” In: J. Palutikof, P. Vander Lenden and C. Harison, Eds., Climate Change 2007: Impacts, Adaptation and Vulnerability, Working Group II Contribution to the Fourth Assessment Report of the Intergovernmental Panel on Climate Change, Cambridge University Press, Cambridge, 2007, pp. 433-467.
- P. D. Jones, D. E. Parker, T. J. Osborn and K. R. Briffa, “Global and Hemispheric Temperature Anomalies—Land and Marine Instrumental Records,” Trends: A compendium of Data on Global Change. Carbon Dioxide Information Analysis Center, Oak Ridge National Laboratory, US Department of Energy, Oak Ridge Tenn, 2011.
- Intergovernmental Panel Climate Change (IPCC), “The Scientific Basis,” Contribution of Working Group to the Third Assessment, Report of the Intergovernmental Panel on Climate Change, Cambridge University Press, Cambridge, 2001.