International Journal of Astronomy and Astrophysics
Vol.4 No.1(2014), Article ID:43579,10 pages DOI:10.4236/ijaa.2014.41014
Simulation of Atmospheric Wave-Fronts with Turbulence Intermittency
Giorgio Sedmak
Department of Physics, Trieste University, Trieste, Italy
Email: giorgio.sedmak@ts.infn.it
Copyright © 2014 by author and Scientific Research Publishing Inc.
This work is licensed under the Creative Commons Attribution International License (CC BY).
http://creativecommons.org/licenses/by/4.0/


Received 22 January 2014; revised 20 February 2014; accepted 27 February 2014
ABSTRACT
A new extendable method for the simulation of atmospheric wave-fronts with turbulence intermittency is reported. The purpose is to generate simulations consistent with the distributions observed for the turbulence parameters and the seeing, not available with standard methods. The intermittency is included by entering log-normal distributed arrays for the Fried parameter and the spatial coherence outer scale length into an extended form of the phase spectrum. The method is tested on large samples of simulated long-exposure point-source images. The tests show the agreement of the simulations with literature data. The simulations show that the intermittency affects negligibly the long-term median image size but breaks the symmetry of the wave-front phase spectrum, scatters the phase structure function and changes the image profile.
Keywords:Wave-Fronts; Simulation; Intermittency; Seeing; Atmospheric Turbulence

1. Introduction
The numerical simulation of turbulent wave-fronts is widely used as a tool for the design of ground-based telescopes, adaptive optics, and image processing applications. Dependable simulations are particularly important in the projects of the ground-based extremely large telescopes in course of realization in the 30 to 40 m aperture range.
Time-evolving and space-variant implementations are required to carefully model the complex turbulent structure of the Earth atmosphere [1] -[5] . In first approximation the turbulence is assumed stationary, isotropic, homogeneous, and characterized by the Kolmogorov model in the inertial range [6] . Anisotropic effects have been inspected theoretically [7] but are generally ignored in standard simulations. The turbulence strength is characterized by the Fried parameter r0. In the visual band at the wavelength of 500 nm the median value of r0 ranges from about 5 to 25 cm [8] . The long-term distribution of r0 is nearly log-normal with a dispersion of about 0.2 [9] . Outside the inertial range the Kolmogorov model is usually replaced by the von Kármán model with finite inner and outer scales of the spatial coherence [10] . The inner scale length l0 ranges from about 1 to 7 mm [11] and is usually ignored in simulations of standard dynamic range. The median value of the outer scale length L0 ranges from about 15 to 25 m, depending upon the site, the thickness of the dominant atmospheric layer, and the height of the observer above the ground [12] [13] . The long-term distribution of L0 is nearly log-normal with a dispersion of about 0.22 [14] [15] .
The atmospheric turbulence determines the astronomical seeing defined as the Full Width at Half Maximum (FWHM) of the long-exposure image of an astronomical point-source observed at ground and corrected for the telescope diffraction Point Spread Function (PSF). This standard definition of seeing takes into account the reality of astronomical observations which are stationary only on limited time scales. In the visual band the seeing in top sites shows a world-wide median of about 0.8 arc-second and a long-term log-normal distribution with a dispersion of about 0.2 mainly driven by the dispersion of the turbulence strength.
The distributions of the turbulence parameters and the seeing follow the spatial and temporal variability of the turbulence, the so called intermittency [16] [17] . The intermittency is assumed usually stationary, isotropic, homogeneous, and characterized by an approximately exponential temporal autocorrelation over time scales from less than one second to several hours [18] . The cut-off time of the intermittency is actually poorly defined. Measurements of image size made at La Palma [19] show time scales of the major variations of the seeing of about 20 s. Measurements of temporal correlation made at Mount Wilson Observatory [20] show cut-toff times of about 12 s. Moreover, small anisotropies of the intermittency eventually independent of the wind direction and wind speed are questionable but if confirmed may lead to the PSF anisotropies relevant to weak-lensing surveys [21] [22] .
In all cases the intermittency cut-off time sets the Taylor frozen flow scale [23] [24] where the intermittencyfree model is valid and the simulations can use constant values of r0 and L0. At larger scales non-stationary simulations are needed to take into account the variability of the turbulence parameters.
Simulations with one-dimensional non-stationarity are available [25] but cannot model two-dimensional intermittency. Simulations with two-dimensional non-stationarity based on convolution [26] are also available but do not include the L0 intermittency. This work aims to implement comprehensive simulations of phase screens with full turbulence intermittency. The intermittency is included by first simulating the Fried parameter r0 and the outer scale length L0 as two-dimensional random screens of appropriate statistics and then entering such screens into the phase spectrum. This new approach takes into account the variability under stationary spectrum assumption and can be generalized to any other parameter of the spectrum if required.
The new method is described in Section 2. The method is tested on large simulated samples of long-exposure point-source images. The simulations of the images are implemented by means of the standard procedures recalled in Sections 3. The results are reported in section 4 and show the agreement with literature data. The results are finally summarized in the concluding remarks.
2. Phase Screens with Intermittency
The standard simulation of the turbulent atmospheric wave-front, namely the phase screen generated by one single stationary, isotropic, homogeneous atmospheric layer can be implemented by various algorithms such as the Fast-Fourier-Transform (FFT) method [27] , the Zernike polynomial method [28] , and the Fourier-series method [29] . The FFT method is used here because it is particularly simple to extend to non-constant turbulence parameters, fast and computer effective.
The FFT method computes the phase screen by means of the inverse-Fourier-transform of the product of a random noise and the square root of the phase spectrum:
 (1)
(1)
where j(r) is the simulated phase screen, r = (x,y) is the spatial vector, f = (fx,fy) is the spatial frequency, F is the two-dimensional FFT transform, H is a complex hermitian (0,1)-normal random noise, and F is the phase spectrum of the turbulence model. The screen has spatial size G × G m2 and N × N pixels. The real and imaginary phase values yield two independent random normal distributions following the given spectrum. The accuracy of the FFT method depends on the support size and sampling and is then limited by the computing resources. The accuracy can be improved by harmonic sub-sampling and weighting if needed [30] .
In order to include the intermittency the phase spectrum must be extended for the spatial variability of the Fried parameter and the outer scale length. The space-variant phase spectrum F(f,r) is obtained here from the space-invariant spectrum F(f) for von Kármán turbulence with zero inner scale length [see 27] making explicit the space dependence of r0 and L0 as follows:
 (2)
(2)
where r0(r) and L0(r) are two-dimensional real arrays of log-normal statistics which describe the Fried parameter and the outer scale length screens. All screens have spatial size G × G m2 and N × N pixels. For constant values of the r0- and L0-screens the phase spectrum degenerates to the case without intermittency. The phase spectrum is set to zero at zero spatial frequency for consistence with the zero-mean phase constraint. Phase spectra that rolls off smoothly to zero at scales larger than the outer scale length are available [31] but they are not used here since there is no substantial gain in the error budget of the simulation.
The r0(r) and L0(r) screens are implemented here by scaling random normal arrays with the observed intermittency spectrum so as to match the observed log-normal distributions of r0 and L0. The random normal intermittency array i(r) can be computed by any simulation method. Using the standard FFT method the array i(r) is given by:
 (3)
(3)
where I(f) is the normalized two-dimensional intermittency spectrum of the atmospheric turbulence. The r0(r) and L0(r) screens are then computed by scaling the array i(r) as follows:
 (4)
(4)
 (5)
(5)
where r0 and s(r0) are the observed median and dispersion of Log(r0), L0 and s(L0) are the observed median and dispersion of Log(L0), and power, median and sigma are the two-dimensional power, median and standard deviation operators. Notice that two independent random normal i(r)-screens must be computed for r0 and separately for L0 in order to enforce the de-correlation observed between these parameters.
The normalized intermittency spectrum I(f) can be computed by means of the two-dimensional Hankel transform H [32] of the exponential-shaped autocorrelation of the turbulence:
 (6)
(6)
where exp and abs are respectively the exponential and the absolute value operators and L is the autocorrelation cut-off length at exp(−1). In this work L is set to 0.55L0 in order to fit the de-correlation observed at the lag of about 12 s. This choice is arbitrary within the range of observed values (see [19] [20] ). Other choices are obviously possible. Possible anisotropies of the intermittency can be easily taken into account by using different xand y-values for the cut-off length.
Notice that the new method presented here is able to isolate the effects of the intermittency of one turbulence parameter by taking constant the others. This follows from the de-correlation of r0 from L0 and eventually other parameters in Equation (2).
One simulated r0-screen with log-normal intermittency is shown in Figure 1. The r0 values fit closely the assigned log-normal distribution. The results for the simulated outer scale length screen are full similar. One phase spectrum for von Kármán turbulence with log-normal intermittency is shown in Figure 2. The intermittency breaks the azimuthal symmetry of the spectrum.
Finally, the phase structure functions (see Equations (11) and (12)) of 10 series of 10 simulations with lognormal intermittency updated once per simulation are shown in Figure 3. The intermittency scatters the theoretical von Kármán phase structure function [33] . The scatter is small for r0-intermittency at constant L0 as already reported by Tubbs (see [26] ) but increases substantially by including the L0-intermittency. The small scale fluctuations are due to the limited statistics.
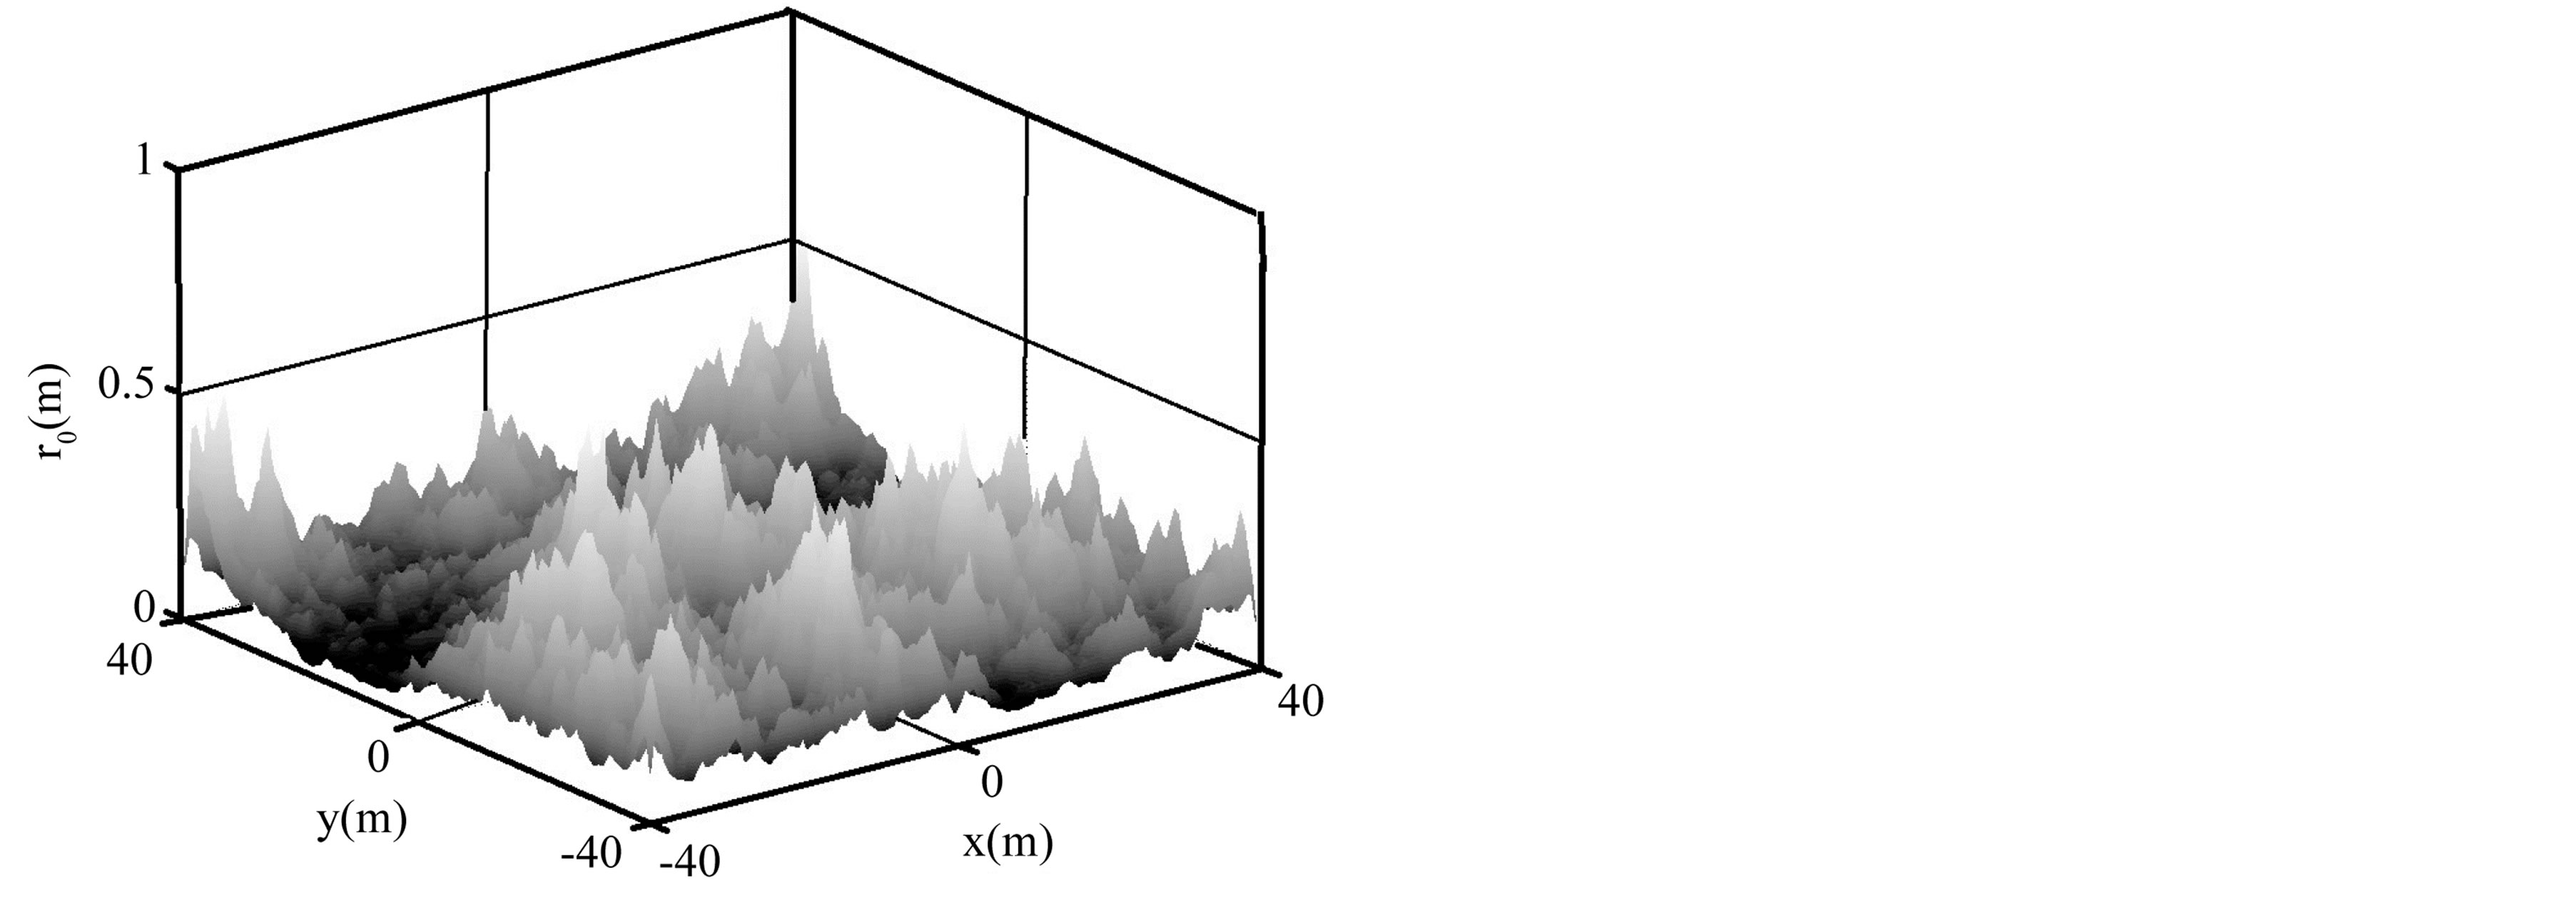
Figure 1. Simulated r0-screen with log-normal intermittency. Median r0 = 0.15 m, sLog(r0) = 0.20, exponential autocorrelation with cut-off L = 12.1 m. Screen size 80 m × 80 m.
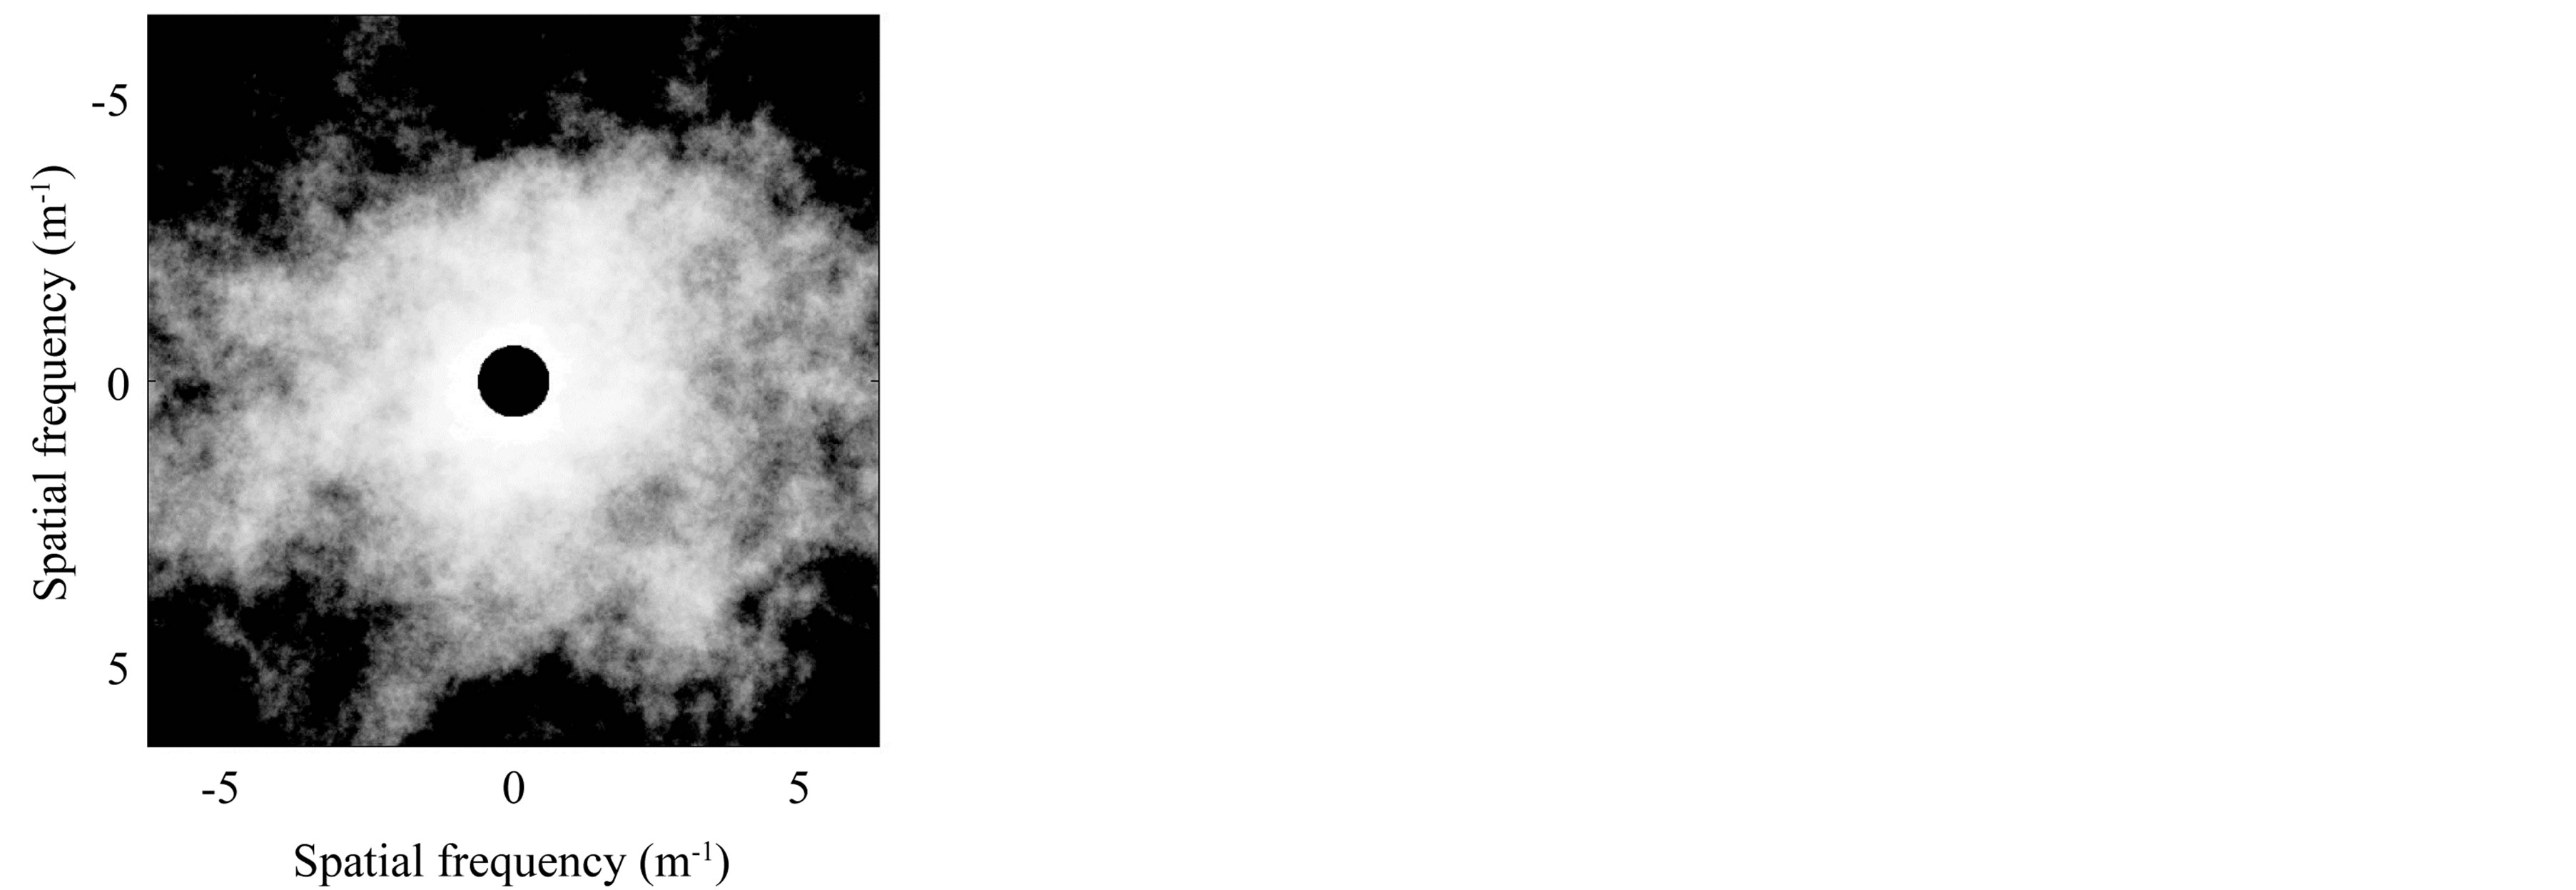
Figure 2. Simulated phase Log-spectrum with von Kármán turbulence and log-normal intermittency. Median r0 = 0.15 m, sLog(r0) = 0.20, median L0 = 22 m, sLog(L0) = 0.22, exponential autocorrelation with cut-off L = 12.1 m. Screen size 80 m × 80 m and 1024 × 1024 pixels. Image histogram-equalized and clipped for improved visualization.

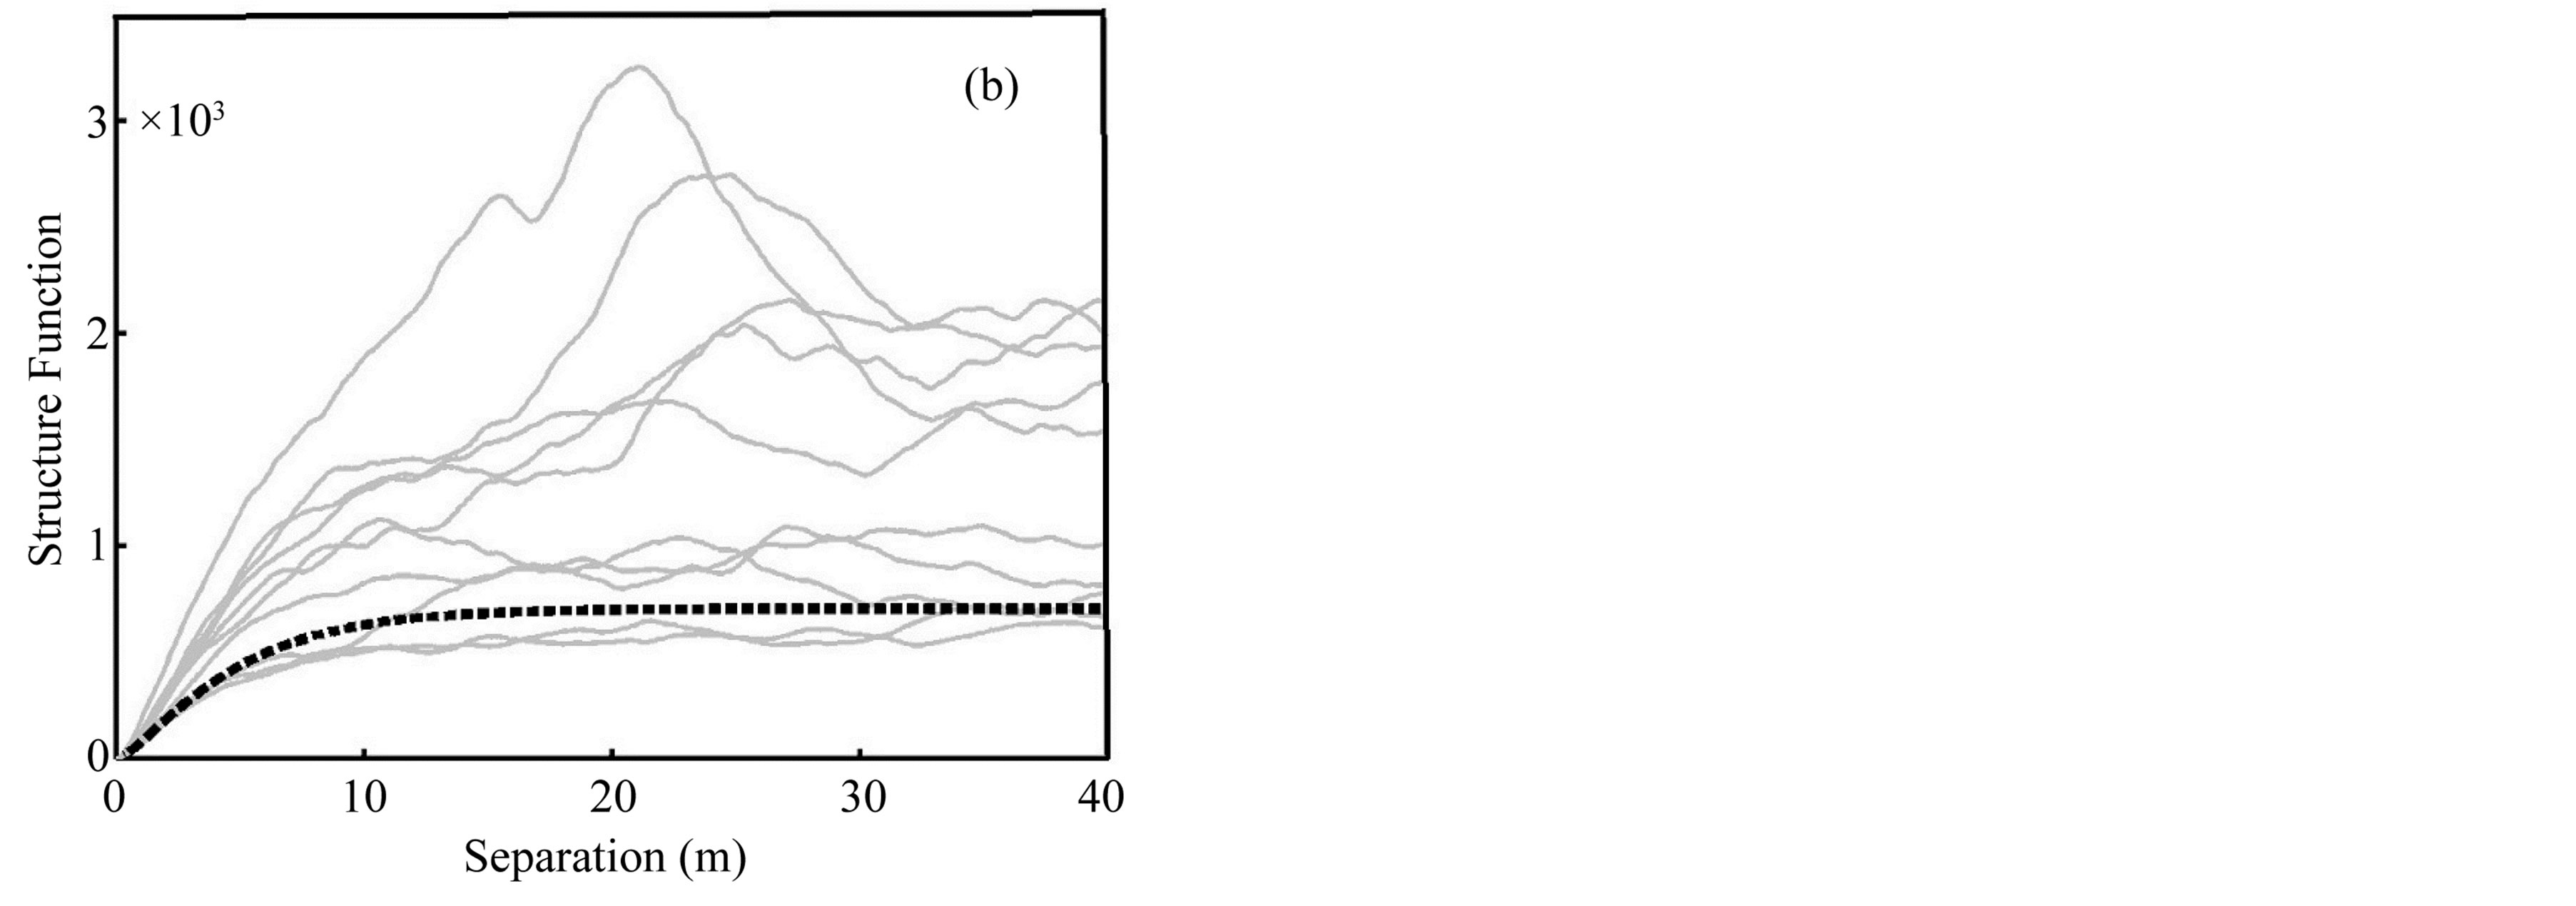
Figure 3. Phase structure functions with von Kármán turbulence for (a) log-normal r0 and constant L0 and (b) log-normal r0 and L0 intermittency. The theoretical intermittency-free phase structure function for constant r0 and L0 (dashed line) is added. Median r0 = 0.15 m, sLog(r0) = 0.20, median L0 = 22 m, sLog(L0) = 0.22, exponential autocorrelation with cut-off L = 12.1 m. Screen size 80 m × 80 m.
3. Simulation of Test Images
The tests of the new method are carried out using the distributions of the seeing. The seeing is defined as usual by the size of long-exposure point-source images. The seeing can be observed directly on astronomical images or indirectly through measurements of the turbulence parameters. The seeing can also be computed theoretically as a function of the Fried parameter and the outer scale length by means of the Tokovinin approximation for the von Kármán model [34] :
 (7)
(7)
where eVK (rad) is the FWHM and l is the wavelength. The approximation holds within 1% accuracy for L0/r0 > 20. At such large L0/r0 ratios the distribution of eVK approximates the distribution of r0 and is practically independent of L0. This is in agreement with the measurements of seeing commonly based on DIMM, Shack-Hartmann or interferometric estimates of the Fried parameter [35] (see also [9] [14] [15] ). The distributions of eVK are used here as theoretical references for the simulations.
3.1. Long-Exposure Images
The test data are measured on a large number of simulated images. For redundancy each image is computed in two standard modes, the first by means of the average of a time series of simulated instant PSFs (speckles) [36] and the second by means of the Fourier transform of the optical transfer function (OTF) [37] averaged over a time series of simulated phase screens.
Using the first method, which mimics the real operations at the telescope, the raw long-exposure point-source image PSFLE, raw at zero atmospheric scintillation inclusive of the telescope diffraction PSF is given by:
 (8)
(8)
where w is the pupil function of value 1 inside and 0 outside the telescope aperture, jk is the phase screen simulated at time k∆t, ∆t is the sampling time, and n is the number of phase screens. The true FWHMLE is obtained by quadratic subtraction from FWHMLE, raw of the telescope diffraction FWHM.
Using the second method the long-exposure point-source image PSFLE is given by:
 (9)
(9)
where the optical transfer function OTF is obtained from the phase structure function D through the phase autocorrelation B averaged over the time series of simulated phase screens:
 (10)
(10)
 (11)
(11)
 (12)
(12)
The values of FWHM are computed by means of the polynomial fit of the azimuthal average of the PSF images in order to improve the signal to noise ratio and the accuracy of the estimates.
3.2. Time-evolving Phase Screens
The simulation of long-exposure images requires time-evolving phase screens in order to account the evolving structure of the Earth atmosphere. The night-time structure can be approximated by a set of multiple turbulent layers blown by winds in horizontal motion parallel to the ground surface [38] -[42] . The accuracy of the model increases with the number of layers. Each layer is characterized by its own turbulence parameters and wind velocity vector. The column phase is approximated by the sum of the phase contributions from the various layers weighted by the respective turbulence strength [43] :
 (13)
(13)
where ak is the weight for the k-th layer and n the number of layers. This expression is strictly valid only under Rytov approximation and neglecting the propagation.
The autocorrelation cut-off time of the turbulence determines the Taylor frozen flow scale within which the time evolving phase screens can be simulated by rigid spatial shifts of stationary phase screens moving at the average wind velocity. The shifts are conveniently implemented in the Fourier domain as follows [44] :
 (14)
(14)
where j2(r) is the shifted phase screen, j1(r) is the initial phase screen, sx and sy are the fractional x and y-shift offsets due to the wind, and x and y the support mesh spatial arrays.
The average dispersion of the wind velocities between the layers determines the phase boiling which is characterized by a lifetime of about 5 to 25 ms in the visual band [45] . The simulation of the phase boiling is embedded in the multi-layers model. For a seeing of 1 arc-second in the visual band a basic two-layers model with equal turbulence strengths and velocity vectors of equal modulus and provides a phase boiling lifetime of about 10 ms with a wind velocity dispersion of 10 ms−1.
The phase boiling can be also approximated by means of statistically evolving Markov processes as follows (see [44] ):
 (15)
(15)
where j2(r) is the evolved phase screen, j1(r) is the initial phase screen, j(r) is an auxiliary independent phase screen, a(r) = 2 m abs(r)/G is a Fourier domain weight, and m is a constant which controls the process. A value of m = 1 provides an equivalent phase boiling lifetime of about 16 ms in the visual band. Both methods are established standards and both are used here for redundancy in the tests of the new simulation method.
4. Image Size with Turbulence Intermittency
The procedures reported in the previous sections were implemented in Matlab and used to simulate several distributions of the image size (seeing) with turbulence intermittency. Every distribution was computed by means of 1000 images of 1 s exposure time with the intermittency updated once per image. The global simulation time is therefore equal to 1000 intermittency cut-off times, equivalent to about 3.3 hours for the selected cut-off time of 12 s. Every image was computed by means of 100 Taylor shifts of the simulated phase screen with 10 ms sampling time.
The images were computed in K band at the wavelength of 2166 nm with the two methods reported in sub-section 3.1. The phase boiling was simulated with the two methods reported in Section 3.2, using first the basic two-layers model with equal weights a1 = a2 = 0.71 and then the Markov de-correlation model with m = 1. Notice that the minimalist models used here are proposed just for testing the new simulation method and not at all as an accurate descriptor of the atmospheric structure.
The phase screens were simulated for the two cases of log-normal r0 intermittency at constant L0 and lognormal r0 and L0 intermittency. The turbulence parameters were median r0 = 0.554 m, sLog(r0) = 0.20, median L0 = 22 m, sLog(L0) = 0.22, intermittency autocorrelation cut-off L = 12.1 m, wind velocity 8 ms−1, and telescope aperture D = 39 m. The phase screen size was set to 80 m × 80 m and 1024 × 1024 pixels in order to avoid aliasing and sample the phase below the r0 scale.
The profile of one long-exposure image simulated with log-normal r0 and L0 intermittency is shown (Figure 4). The simulation matches fairly well observations such as the data by Martinez et al. (see Figure 4 in [46] ) up to about 0.4 arc-second. The small deviation at larger offsets is due to the limited reproduction of the lower spatial frequencies intrinsic to FFT simulations and can be improved by harmonic sub-sampling and/or tip-tilt inclusion if required (see [30] ). The profile simulated without intermittency does not fit properly the data. The intermittency shrinks the core and broadens the wings of the image while leaving substantially unchanged the FWHM image size. The median FWHM value of the simulated distribution results 0.500 arc-second, very close to the observed value of 0.509 arc-second reported in [46] .
One sample distribution of seeing simulated with log-normal r0 and L0 intermittency is shown in Figure 5. The simulation matches fairly well the theoretical distribution of eVK as well as observations such as the data by Martin et al. scaled from GSM to K band (see Figure 2 in [14] ). The small deviation of the simulation at larger offsets is due to the limited reproduction of the lower spatial frequencies.
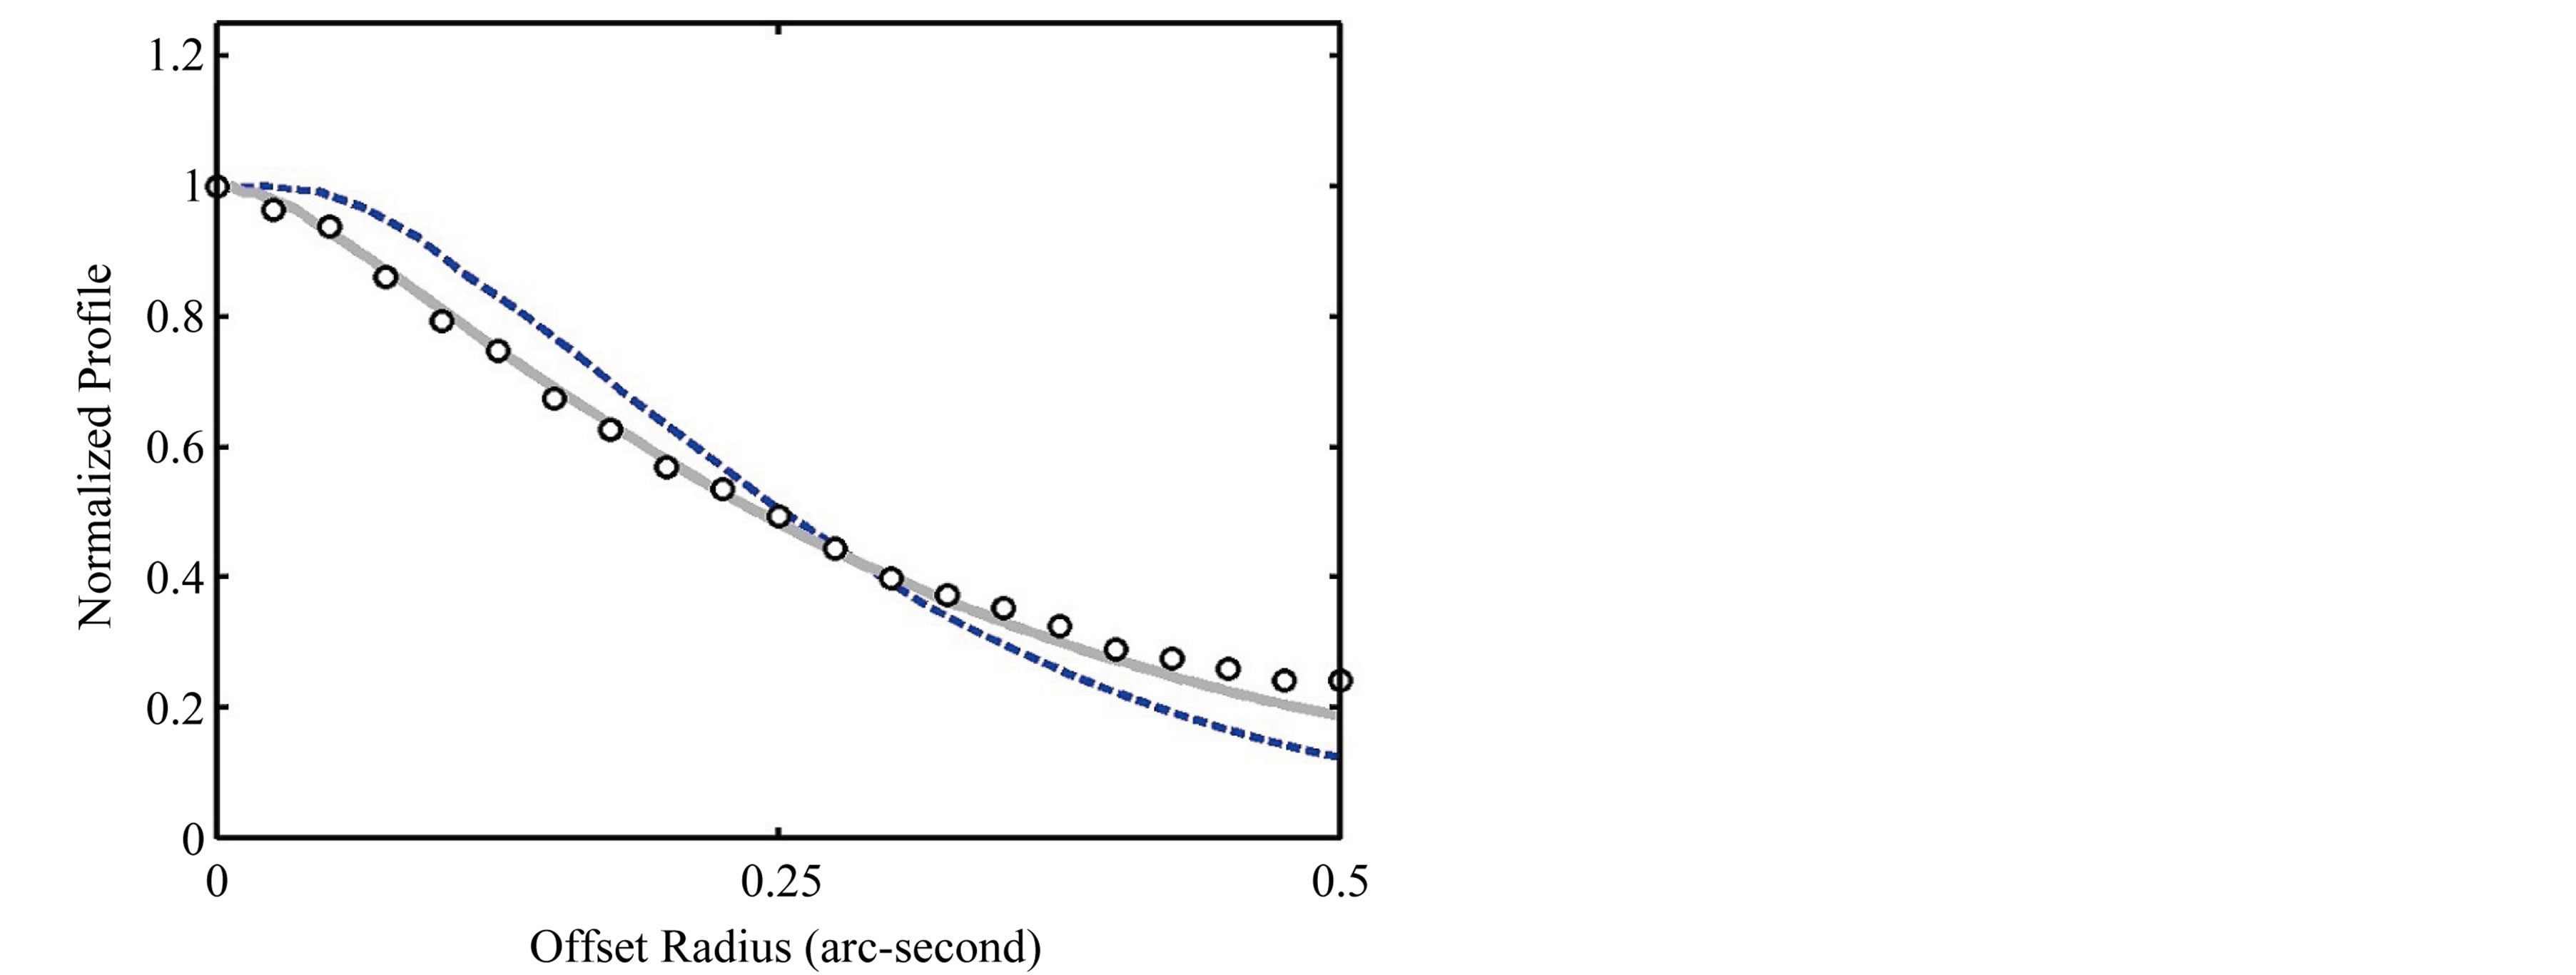
Figure 4. Long-exposure K-band image profile (line) from 1000 two-layers simulations with von Kármán turbulence and lognormal intermittency. Sample K-band data (circles) and a Kband image profile from 100 two-layers simulations without intermittency (dashed line) are added. Median r0 = 0.554 m, sLog(r0) = 0.20, median L0 = 22 m, sLog(L0) = 0.22, exponential intermittency autocorrelation with cut-off L = 12.1 m, wind speeds 8 ms−1.
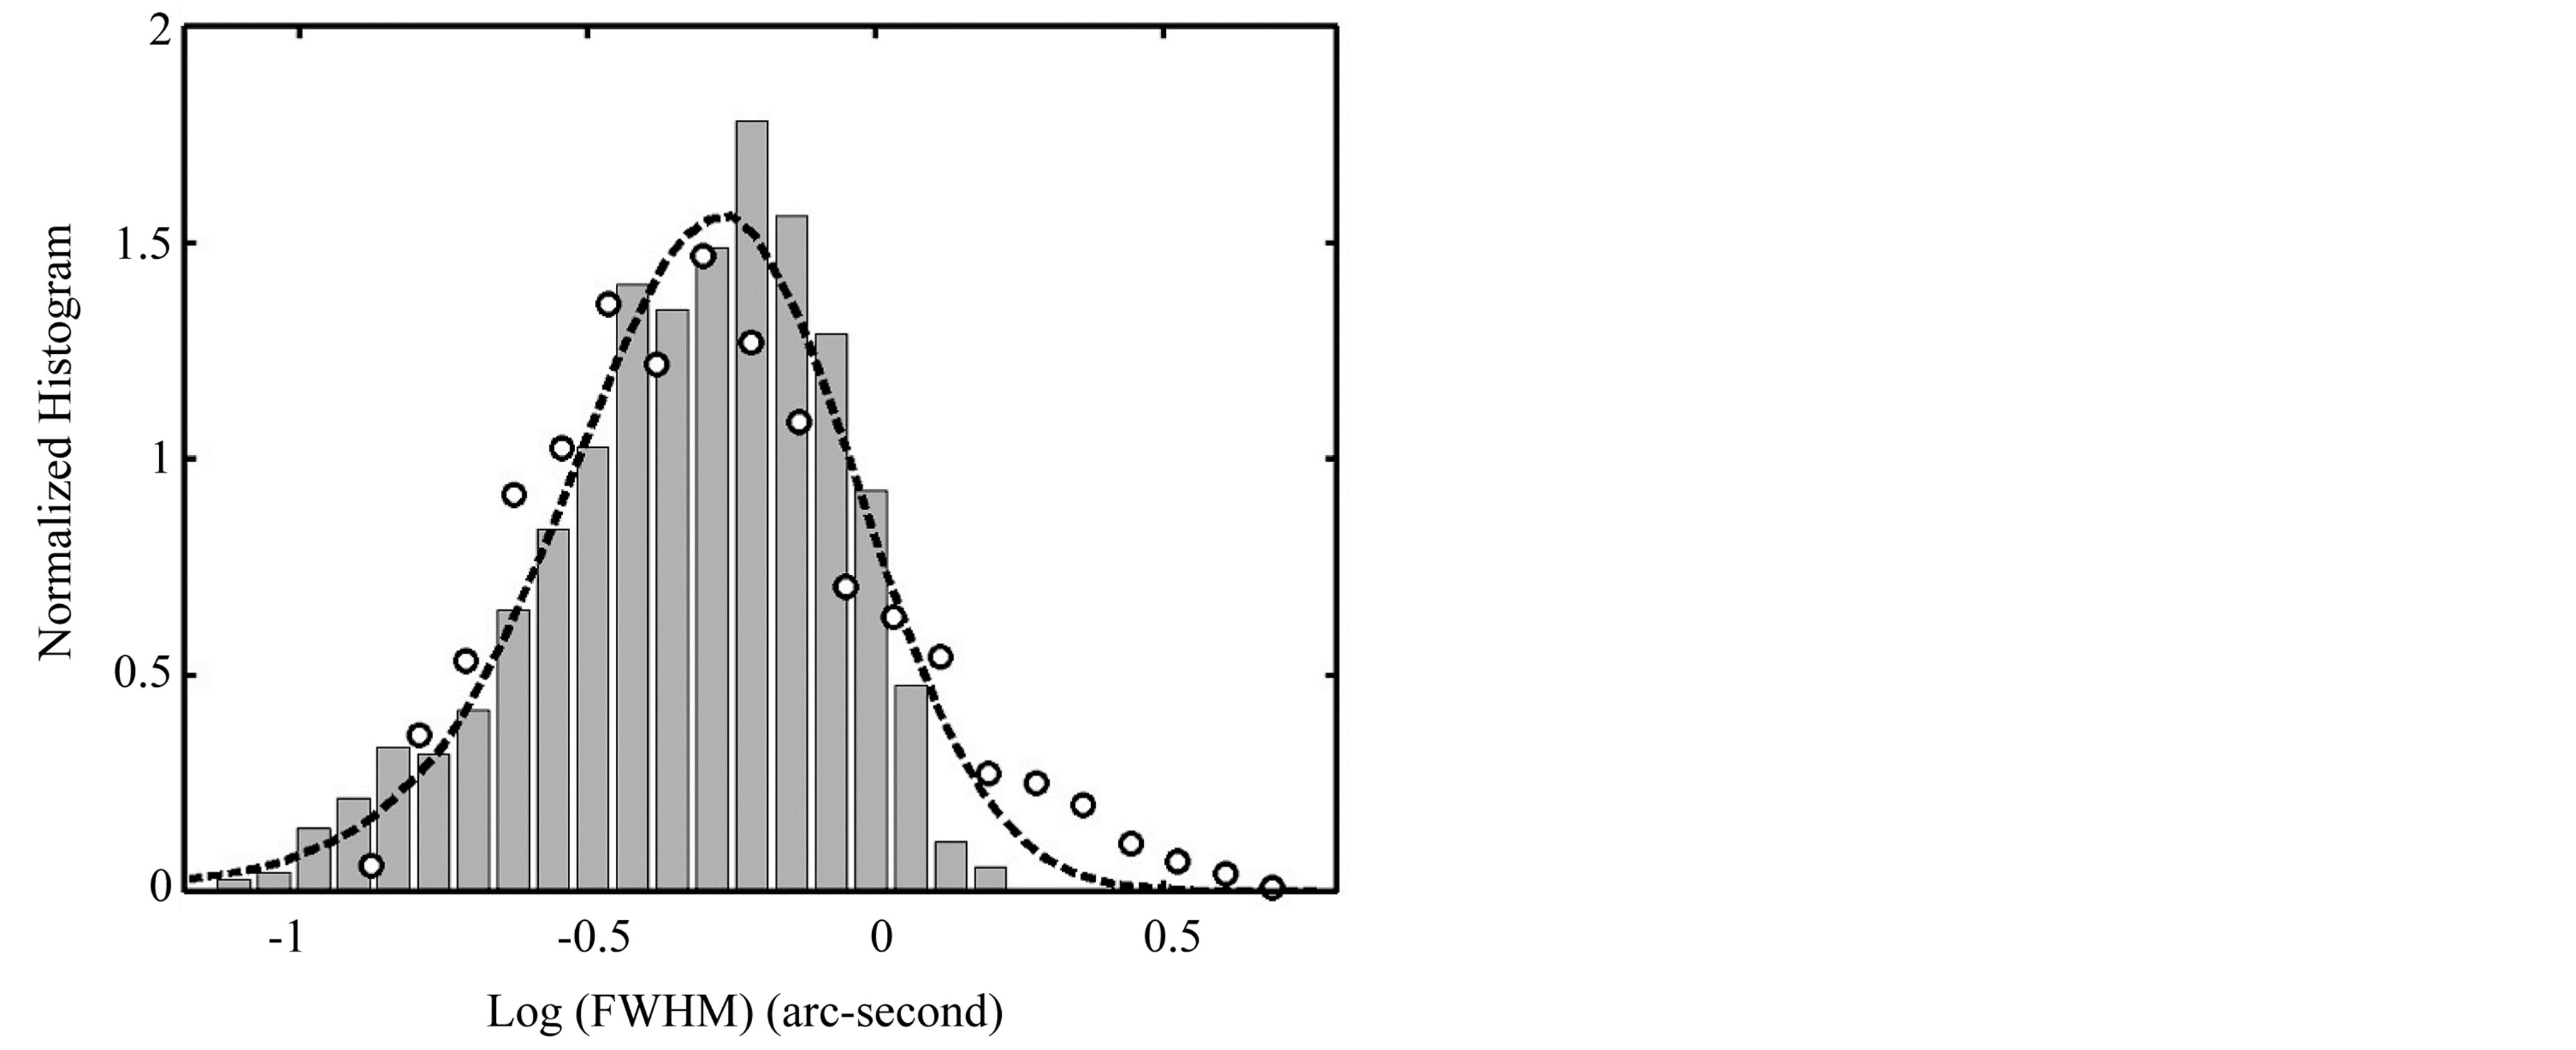
Figure 5. Distribution of K-band seeing simulated with a twolayers model with von Kármán turbulence and log-normal intermittency (bars). Sample GSM data scaled to K-band (circles) and the theoretical seeing distribution (dashed line) are added. Median r0 = 0.554 m, sLog(r0) = 0.20, median L0 = 22 m, sLog(L0) = 0.22, exponential intermittency autocorrelation with cut-off L = 12.1 m, wind speed 8 ms−1.
The images for the results shown above were computed with the two-layers boiling model and the Fourier Tranform of the OTF. The results with the Markov boiling model and the speckles-based image formation are full close for both the image profile and the seeing distribution.
5. Conclusions
The simulations implemented with the new method show that the intermittency breaks the symmetry of the wave-front phase spectrum, scatters the phase structure function and affects the statistics of the seeing and the shape of point-source images. The log-normal distribution observed for the seeing looks to follow mostly the intermittency-driven variability of the turbulence strength. The intermittency affects only slightly the median size of long-exposure point-source images. Instead, the intermittency of the turbulence strength dominates the long-term dispersion of the seeing while the intermittency of the outer scale length dominates the short-term phase structure function. Moreover, possible anisotropies of the intermittency may affect the ellipticity of the atmospheric PSF.
The inclusion of intermittency in the simulation of atmospheric wave-fronts is therefore required for accurate modeling on large ranges of spatial and temporal scales. In this work the intermittency is included by means of log-normal distributed arrays for the Fried parameter and the spatial coherence outer scale length. The new method is then fully extendable and easy to implement on vector-oriented software platforms.
The tests of the new procedure show the good agreement of the simulations with literature data either for the image profile and the distribution of the image size. The pervasive role of the intermittency recommends the multi-point monitoring of all turbulence parameters for optimum control of ground based adaptive optics systems.
Acknowledgements
This work was done under the research contract No. 6175/2013 by the Department of Physics, Trieste University, Italy.
References
- Ala, R., Vernin, J. and Masciadri, E. (1997) Whole Atmospheric-Turbulence Profiling with Generalized Scidar. Applied Optics, 36, 7898-7905. http://dx.doi.org/10.1364/AO.36.007898
- Quirrenbach, A. (2002) Site Testing and Site Monitoring for Extremely Large Telescopes. Astronomical Site Evaluation in the Visible and Radio Range, ASP Conference Series, 266, 516-522.
- Osborn, J., Wilson, R., Butterley, T, Shepherd, H. and Sarazin, M. (2010) Profiling the Surface Layer of Optical Turbulence with Slodar. Monthly Notices of the Royal Astronomical Society, 406, 1405-1408.
- Egner, S.E. and Masciadri, E. (2007) A G-SCIDAR for Ground-Layer Turbulence Measurements at High Vertical Resolution. Publications of the Astronomical Society of the Pacific, 119, 1441-1448.
- Masciadri, E., Avila, R. and Sánchez, L.J. (2002) First Evidence of the Finite Horizontal Extent of the Optical Turbulence Layers. Implications for New Adaptive Optics Techniques. Astronomy & Astrophysics, 382, 378-388. http://dx.doi.org/10.1051/0004-6361:20011622
- Kolmogorov, A.N. (1941) Dissipation of Energy in Locally Isotropic Turbulence. Doklady Akademii Nauk SSSR, 32, 16-18.
- Toselli, I., Agrawal, B. and Restaino, S. (2011) Light Propagation through Anisotropic Turbulence. Journal of the Optical Society of America, 28, 483-488. http://dx.doi.org/10.1364/JOSAA.28.000483
- Sarazin, M. and Roddier, F. (1990) The ESO Differential Image Motion Monitor. Astronomy & Astrophysics, 227, 294-300.
- Wilson, R.W., O’Mahony, Packhan, N.C. and Azzaro, M. (1999) The Seeing at the William Herschel Telescope. Monthly Notices of the Royal Astronomical Society, 309, 379-387.
- Von Karman, T. (1948) Progress in the Statistical Theory of Turbulence. Proceedings of the National Academy of Sciences USA, 34, 530-539. http://dx.doi.org/10.1073/pnas.34.11.530
- Ochs, G.R. and Hill, R.J. (1985) Optical-Scintillation Method of Measuring Turbulence Inner Scale. Applied Optics, 24, 2430-2432. http://dx.doi.org/10.1364/AO.24.002430
- Ziad, A., Schöck, M., Conan, G.A., Troy, M., Dekany, R., Lane, B.F., Borgnino, J. and Martin, F. (2004) Comparison of Measurements of the Outer Scale of Turbulence by Three Different Techniques. Applied Optics, 43, 2316-2324. http://dx.doi.org/10.1364/AO.43.002316
- Abahamid, A., Vernin, J., Benkhaldoun, Z., Jabiri, A., Azouit, M. and Agabi, A. (2004) Seeing, Outer Scale of Optical Turbulence, and Coherence Outer Scale at Different Astronomical Sites Using Instruments on Meteorological Balloons. Astronomy & Astrophysics, 422, 1123-1127.
- Martin, F., Tokovinin, A., Ziad, A., Conan, R., Borgnino, J., Avila, R., Agabi, A. and Sarazin, M. (1998) First Statistical Data on Wave Front Outer Scale at La Silla Observatory from the GSM Instrument. Astronomy & Astrophysics, 336, L49-L52.
- Martin, F., Conan, R., Tokovinin, A., Ziad, A., Trinquet, H., Borgnino, J., Agabi, A. and Sarazin, M. (2000) Optical Parameters Relevant for High Angular Resolution at Paranal from GSM Instrument and Surface Layer Contribution. Astronomy and Astrophysics Supplement Series, 144, 39-44. http://dx.doi.org/10.1051/aas:2000197
- Racine, R. (1996) Temporal Fluctuations of Atmospheric Seeing. Publications of the Astronomical Society of the Pacific, 108, 372-374. http://dx.doi.org/10.1086/133732
- Vernin J. and Muňoz-Tuňón, C. (1998) The Temporal Behaviour of Seeing. New Astronomy Review, 42, 451-454. http://dx.doi.org/10.1016/S1387-6473(98)00051-7
- Tokovinin, A., Baumont, S. and Vasquez, J. (2003) Statistics of turbulence profile at Cerro Tololo. Monthly Notices of the Royal Astronomical Society, 340, 52-58.
- Law, N.M., Mackay, C.D. and Baldwin, J.E. (2006) Lucky Imaging: High Angular Resolution Imaging in the Visible from the Ground,” Astronomy & Astrophysics, 446, 739-745. http://dx.doi.org/10.1051/0004-6361:20053695
- Short, N., Fitelson, W. and Townes, C.H. (2003) Atmospheric Turbulence Measurements at Mount Wilson Observatory. The Astrophysical Journal, 599, 1469-1477. http://dx.doi.org/10.1086/379364
- de Vries, W.H., Olivier, S.S., Asztalos, S.J., Rosenberg, L.J. and Baker, K.L. (2007) Image Ellipticity from Atmospheric Aberrations. The Astrophysical Journal, 662, 744-749. http://dx.doi.org/10.1086/517873
- Heymans, C., Rowe, B., Hoekstra, H., Miller, L., Erben, T., Kitching, T. and Van Waerbeke, L. (2012) The Impact of High Spatial Frequency Atmospheric Distortions on Weak Lensing Measurements. Monthly Notices of the Royal Astronomical Society, 421, 381-389.
- Taylor, G.I. (1938) The Spectrum of Turbulence. Proceedings of the Royal Society of London, A164, 476-490. http://dx.doi.org/10.1098/rspa.1938.0032
- Zaman, K.B.M.Q. and Hussain, A.K.M.F. (1981) Taylor Hypothesis and Large-Scale Coherent Structures. Journal of Fluid Mechanics, 112, 379-396. http://dx.doi.org/10.1017/S0022112081000463
- Assémat, F., Wilson, R.W. and Gendron, E. (2006) Method for Simulating Infinitely Long and Non Stationary Phase Screens with Optimized Memory Storage. Optics Express, 14, 988-999. http://dx.doi.org/10.1364/OE.14.000988
- Tubbs, R.N. (2006) The Effect of Temporal Fluctuations in r0 on High-Resolution Observations. Proceedings of SPIE 6272, Advances in Adaptive Optics II, 6272, 62722Y. http://dx.doi.org/10.1117/12.671170
- McGlamery, B.L. (1976) Computer Simulation Studies of Compensation of Turbulence Degraded Images. Proceedings of SPIE 74, Image Processing, 225, 225-233. http://dx.doi.org/10.1117/12.954724
- Roddier, N. (1990) Atmospheric Wave Front Simulation Using Zernike Polynomials. Optical Engineering, 29, 1174- 1180. http://dx.doi.org/10.1117/12.55712
- Welsh, B.M. (1997) A Fourier-Series-Based Atmospheric Phase Screen Generator for Simulating Nonisoplanatic Geometries and Temporal Evolution. Proceedings of SPIE 3125, Propagation and Imaging through the Atmosphere, 327, 327-338. http://dx.doi.org/10.1117/12.279029
- Sedmak, G. (2004) Implementation of Fast-Fourier-Transform-Based Simulations of Extra-Large Atmospheric Phase and Scintillation Screens. Applied Optics, 43, 4527-4538. http://dx.doi.org/10.1364/AO.43.004527
- Tofsted, D.H. (2000) Turbulence Simulation: Outer Scale Effects on the Refractive Index Spectrum. Technical Report ARL-TR-548, US Army Research Lab. NM 88002-5501.
- Bracewell, R.N. (2000) The Fourier Transform and Its Applications. 3rd Edition, McGraw Hill Higher Education, New York.
- Consortini, A. and Ronchi, L. (1972) Choice of the Model of Atmospheric Turbulence. Applied Optics, 11, 1205-1211. http://dx.doi.org/10.1364/AO.11.001205
- Tokovinin, A. (2002) From Differential Image Motion to Seeing. Publications of the Astronomical Society of the Pacific, 114, 1156-1166. http://dx.doi.org/10.1086/342683
- Nightingale, N.S. and. Buscher, D.F. (1991) Interferometric Measurements at the La Palma Observatory. Monthly Notices of the Royal Astronomical Society, 251, 155-166.
- Fried, D.L. (1966) Optical Resolution through a Randomly Inhomogeneous Medium for Very Long and Very Short Exposures. Journal of the Optical Society of America A, 56, 1372-1379. http://dx.doi.org/10.1364/JOSA.56.001372
- Roddier, F. (1981) The Effects of Atmospheric Turbulence in Optical Astronomy. In: Wolf, E. Ed., Progress in Optics, North-Holland, Amsterdam, 281-376.
- Hinze, J.O. (1987) Turbulence. McGraw-Hill, New York.
- Kaimal, J.C. and Finnegan, J.J. (1994) Atmospheric Boundary Layer Flows. Oxford University Press, New York.
- Coulman, C.E., Vernin, J. and Fuchs, A. (1995) Optical Seeing: Mechanism of Formation of Thin Turbulent Laminae in the Atmosphere. Applied Optics, 34, 5461-5474. http://dx.doi.org/10.1364/AO.34.005461
- Dewan, E.M. and Grossbard, N. (2007) The Inertial Range “Outer Scale” and Optical Turbulence. Environmental Fluid Mechanics, 7, 383-396. http://dx.doi.org/10.1007/s10652-007-9029-4
- Ziad, A., Borgnino, J., Martin, F., Maire, J. and Mourard, D. (2004) Towards the Monitoring of Atmospheric Turbulence Model. Astronomy & Astrophysics, 414, L33-L36. http://dx.doi.org/10.1051/0004-6361:20031770
- Ellerbroek, B.L. (2002) Efficient Computation of Minimum-Variance Wave-Front Reconstructors with Sparse Matrix Techniques. Journal of the Optical Society of America, 19, 1803-1815. http://dx.doi.org/10.1364/JOSAA.19.001803
- Glindemann, A., Lane, R.G. and Dainty, J.C. (1993) Simulation of Time-Evolving Speckle Patterns Using Kolmogorov Statistics. Journal of Modern Optics, 40, 2381-2388. http://dx.doi.org/10.1080/09500349314552401
- Lopez, B. and Sarazin, M. (1993) The ESO Atmospheric Temporal Coherence Monitor Dedicated to High Angular Resolution Imaging. Astronomy & Astrophysics, 276, 320-326.
- Martinez, P., Kolb, J., Sarazin, M. and Tokovinin, A. (2010) On the Difference between Seeing and Image Quality: When the Turbulence Outer Scale Enters the Game. The Messenger, 141, 5-8.

