International Journal of Geosciences
Vol.07 No.03(2016), Article ID:65259,16 pages
10.4236/ijg.2016.73032
Geological and Geochemical Features of Uranium Mineralization in Western Turkey
Leyla Kalender1*, Ömer Nedim Alçiçek2, Ezgi Gürgenç1
1Department of Geological Engineering, Firat University, Elazığ, Turkey
2Mineral Research and Exploration Institute, Ankara, Turkey

Copyright © 2016 by authors and Scientific Research Publishing Inc.
This work is licensed under the Creative Commons Attribution International License (CC BY).
http://creativecommons.org/licenses/by/4.0/


Received 4 February 2016; accepted 28 March 2016; published 31 March 2016
ABSTRACT
The purpose of this study is to determine the distribution and geochemical features of uranium mineralization in the Rağıllar region in the Manisa-Köprübaşı in western Turkey. Sixteen whole rock samples were collected from sites showing the highest levels of radioactivity (7600 cps) as measured by a gamma spectrometer in the dolomitic limestones. SEM-EDS (Scanning Electron Microscopy-Energy Dispersive Spectrometry), XRF (X-Ray Fluorescence), an ICP-OES (Inductively Coupled Plasma Optic Emission Spectrometer), and a Leco carbon-sulfur analyzer were used to determine the mineralogical and chemical characteristics of the whole rock samples. The mineralogical features showed that uranium mineralization is associated with fluorapatite-rich rocks formed within calcite matrix fractures; cracks systems; and limestone, claystone, marl and silicified breccia zones in the lacustrine sediments that are observed around the Kale crest dolomitic limestones in the Demirci basin. The geochemical data for these samples show a strong positive correlation between uranium and P2O5 concentrations. The geochemical data also indicate that uranium is deposited in the oxidation zone by dissolving the primary minerals (banded gneisses from the Menderes Massif, and dacitic and andesitic tuff) and moving the metal-rich hydrothermal fluids as phosphorus compounds, before passing through fractures, cracks, and permeable sandstone units, or along carbonate and clay layers.
Keywords:
Geochemistry, Rağıllar, Uranium Mineralization, Turkey

1. Introduction
Previous studies have identified U3O8 at 0.016 wt% tenor according to surface field radioactivity measurements and chemical data around the Kasar-Köprübaşı area in western Turkey [1] - [3] . Yılmaz et al. identified two different types of uranium mineralization (oxidized and unoxidized) in the sandstone and conglomerate formations in the Köprübaşı area, and suggested that leaching of tuff and weathering and erosion of the metamorphic rocks could have supplied this uranium. Studies of the Miocene basin in Turkey have found low tenor and small areas of uranium mineralization close to the studied area [4] . In recent years, Banning et al. examined the relationship between uranium and arsenic in the volcano-sedimentary basins in north central Mexico, and demonstrated that these two trace elements are strongly correlated in volcano-sedimentary rocks [5] . Al-Eshaikh et al. attempted to determine the uranium content of phosphate ores using different measurement techniques, and their results showed a high uranium concentration in the Saudi phosphate ores [6] . Wang et al. clarified the mechanisms of uranium distribution in river sediments and its speciation in river water near a phosphate mine of the Mianyuan River in China that the effective control mechanism is pH values and total phosphate concentration [7] . The main speciation of uranium in the river water near the phosphate mine was  when the pH was lower than 7.6. Romaniello et al. examined the relationship between uranium concentrations and 238U/235U isotope ratios in modern carbonates from the Bahamas. From the results of this study, it was determined that uranium precipitates in carbonate rocks [8] . The influence of acidic and alkaline fluids properties on uranium migration in subsurface sediments was examined by Szecsody et al., who determined that the combination of acidic and alkaline solutions aids the transport of uranium [9] . These solutions affect uranium dissolution/precipita- tion reactions and uranium sorption, but the effect of these solutions may vary with depth and over time. The distribution of uranium and thorium in dolomitic gravel fill and shale saprolite was examined by Philiphs and Watson [10] . They determined that these rocks contain high concentrations of uranium in the gravel below the water table and high concentration of thorium above the water table.
The main aim of this study is to determine the geological features and geochemical composition of the Rağıllar uranium mineralization area, with a particular focus on the behavior of major, trace and rare earth elements (REEs). The results are discussed in terms of the source area for the uranium. This study provides an opportunity to examine the origin of uranium using by whole rock geochemical data and prospect new uranium mineralization due to determining uranium-rich lithologic units.
2. Regional Geologic Setting
The study area is located the geographic coordinates of 38˚50'48.13 N latitude and 28˚26'52.90 E longitude (UTM/50ED) in the Menderes Massif in the Alpide orogenic system (Figure 1(a)). North-trending basins, including the Demirci basin, are located to the north of the East-West trending Alaşehir graben. The presence of these basins was first put forward by Kaya [11] . The Demirci basin is surrounded by the Gördes basin to the west, the Selendi basin to the east, the Simav graben to the north, and the Alaşehir graben to the south in western Turkey (Figure 1(b)). The Menderes Massif rocks in the study area have been studied by many researchers [1] [12] [13] . The floor of the basin in the study area is formed by the Menderes Massif rocks. The metamorphic rocks of the Menderes Massif in the study area can be categorized into two different units in the study area: 1) gneissic metagranites and 2) metasedimentary rocks such as schists. The Menderes Massif rocks in the eastern part and western part (observed only around the Kale crest) of the Köprübaşı-Demirci basin are overlain by Mesozoic limestones. Limestones in the western part are described as dolomite, replaced by calcite [12] . The Menderes Massif rocks and limestones are overlain unconformably by the Neogene sediments. The infill of the Köprübaşı-Demirci basin is dominated by continental clastic sediments, lava flows, and volcaniclastic deposits. The Neogene sediments in the study area can be categorized into three different units: The base of the sedimentary sequence is formed by conglomerates with intercalated sand bodies and volcanics (N1). This formation is also exposed at the southern end of the study area, overlying the Kale crest dolomitic limestones and the Menderes Massif rocks. During active volcanism the basin formed and subsided, creating space for fluvial, lacustrine (N2), and lacustrine limestone deposits (N3) (Figure 2). The sedimentary succession (N1 to N2) is intercalated by alternating rhyodacites, trachyandesites, and agglomerates.
3. Geology of Rağillar Field
3.1. Stratigraphy
The study area is located on Kale crest at the Demirci basin in the Rağıllar village. Figure 2 shows lithologic,

Figure 1. (a) Location of the Menderes Massif in the Alpide orogenic system; (b) geological map of the Menderes Massif and its environs in western Anatolia. The Menderes Massif consists of several nappe systems (Bozdag, Çine, and Bayindir) that are stacked up along north-trending thrust sheets in the field area. The Alasehir granitoid (AG), Salihli granitoid (SG), and Turgutlu granitoid (TG) are intrusive into different basement units in the Menderes Massif [16] .
structural features and A-A' geologic section line in 1/2000 scale map. The Kale crest area is a ridge, approximately E-W trending, bounded to the north and south by two streams. Its regional setting forms parts of the Mesozoic limestones (M1). Volcano-sedimentary rocks cover the eastern block, in which dolomitic limestone can be found, through normal faults, and dolomitic limestone has a thickness ranging between 50 and 250 m. Neogene basin is filled by fluvio-terrestrial (N1) and lacustrine deposits (N2-N3). Gneiss and schist from the Menderes Massif are overlain by Neogene sediments (Figure 2 and Figure 3).
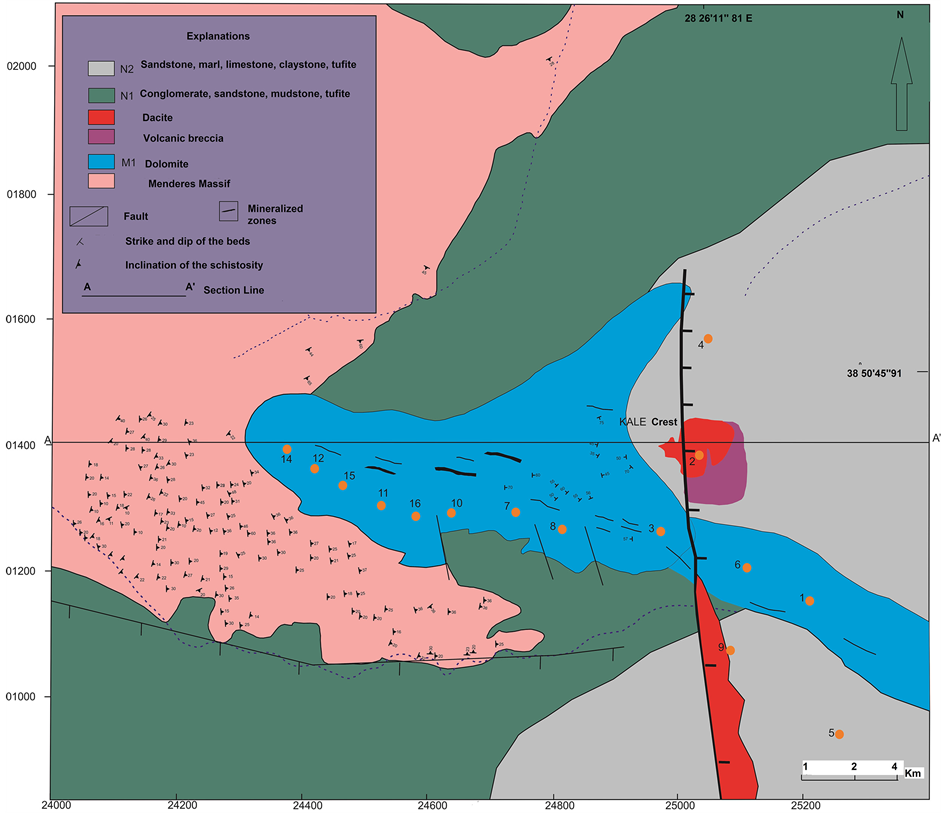
Figure 2. 1/2000 scale geological map of the Kale crest of the Demirci basin modified form Schuiling and Taylor [1] [12] and the A-A' geologic section line.
3.2. Metamorphic (Menderes Massif) and Mesozoic Limestones
Texturally, the gneiss can be divided into banded and augen gneiss. Both types are quartzo-felspathic with both biotite and muscovite. In particular, the banded gneisses have a well-developed schistosity and lineation. The gneisses and schists are the oldest formation in the area, and are overlain unconformably by both the Kale crest dolomitic limestone in the Demirci basin and the Neogene sediments. The gneisses and schists outcrop round the north, west, and south sides of Kale crest showing variable dips, but generally forming a synform with an almost E-W axis. In the south-western part of the area, there is alternation of schists and augen gneiss, the junction of the two being concordant with the schistosity. These schists are grey-colored, readily fissile, and have muscovite and biotite in abundance [12] .
A brecciated zone of gneisses and schists is observed around the study area. This brecciated zone is overlain by the Kale crest dolomitic limestone (M1) and Neogene sediments (N1, N2, and N3).
3.3. Mesozoic Limestones
The Kale crest dolomitic limestones of the Demirci basin are overlain by Menderes Massif rocks. The two units are separated by a brecciated zone. This brecciated zone has a thickness in the range of 1 - 5 m. In the brecciated level, there are fragments of the Menderes Massif and dolomitic limestones (Figure 3). These rocks settle on
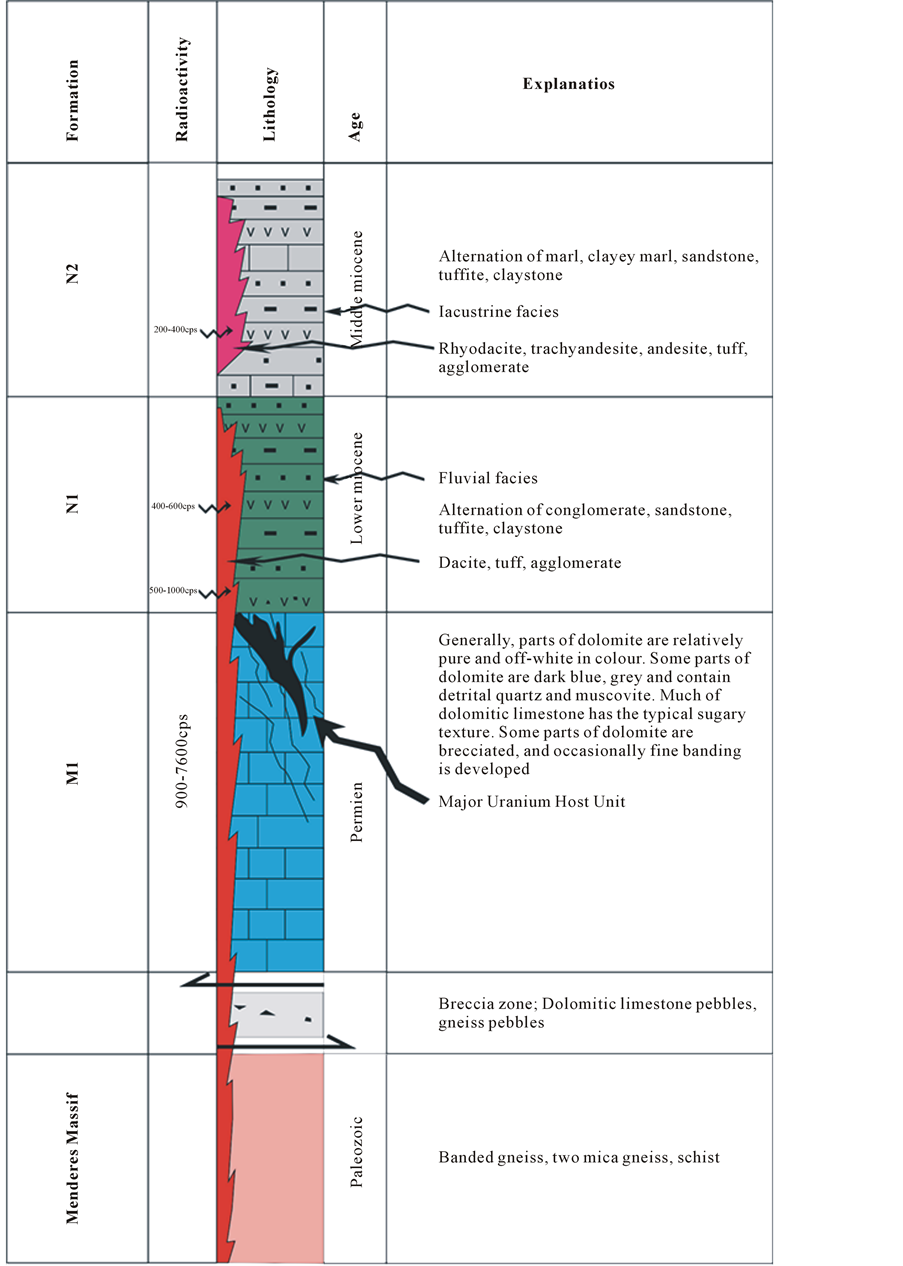
Figure 3. Stratigraphical section of the outcrop units and the measurement of radioactivity results in the study area.
what is assumed to be a planed surface of the Menderes Massif rocks, but they could equally well have a synformal base. As is common with dolomitic limestones, the Kale crest dolomitic limestone shows variations in composition and texture. Parts are relatively pure dolomite and off-white in color, whilst contaminated parts are dark grey-blue and contain detrital quartz and muscovite. The rock has the typical dolomitic sugary texture, parts are brecciated, and occasionally fine banding, known as marine dolomite, is developed, although this is usually associated with evaporite deposits. The majority of the dolomites originate from post-depositional alteration [1] [12] . Dolomitisation often involves the destruction of original sedimentary structures, including fossils. However, the process is not uniform, and dolomite is normally developed in irregular patches. The dolomitic limestones were formed by post-depositional alteration of limestones as indicated by Taylor and Ayan [1] [12] . However, previous researchers have stated Permian the age of the Kale crest dolomitic limestone [1] [12] [13] .
Sedimentary cover in the Demirci basin is observed on Menderes Massif rocks and the Kale crest dolomitic limestone. Breccias are observed at the base of N1 in some places, with the pebbles made up of gneiss and quartz vein fragments. These breccias have primary dips of up to 20˚, since they rest directly on the steep erosional surface of the gneiss [1] [12] . They are overlain by various conglomerates (N1), sandstones, silts, mudstones (N2), and lacustrine limestones (N3) (Figure 3).
3.4. Conglomerate (N1)
The N1 unit is predominantly represented by pebble-cobble conglomerate, with polygenic fragments at the bottom. The conglomerates are commonly massive to weakly bedded. They are poorly sorted, composed of subangular pebbles of gneisses, the gneisses, schists, and marbles of the underlying Menderes Massif rocks, and the Kale crest dolomitic limestones. The conglomerate may be viewed as debris flow and alluvial fan deposits, derived from the basement uplifted blocks elevated by the listric faults. Pebbles in the conglomerates range in size from 1 cm to 1.5 m (Figure 3). In the lower part, the conglomerates are grain-supported, whilst at the top they are matrix-supported. The matrix is made up of sandstones and mudstones containing dacitic tuff. Conglomerates, intercalated sandstones, and dacitic tuffs form a sequence, exposed in the southern and south-western parts of the study area, with a thickness of around 100 m in the study area, and up to 250 m in the south-eastern part. The formation tends to become finer-grained upward, and essentially consists of two lithologies:
1) Clast-supported conglomeratic layers with sub-angular gneisses, schists, and dolomitic limestones vary in size between 15 and 75 cm. The bed thickness of these conglomeratic layers varies between 50 cm and 1.5 m.
2) Matrix-supported sandy layers with gneiss, schist, and dolomitic limestone granules. The bed thicknesses of the sandy layers are about 20 cm to 1.5 m. Within these sandy layers, there is sometimes a thin bed (max. 10 - 20 cm) of fine-grained conglomerate with pebbles less than 3 - 5 cm in diameter.
The unit N1 is interpreted as alternating braided fluvial and debris flow deposits constituting a continental clastic fan system (Figure 3).
3.5. Sandstone, Claystone, and Marl (N2)
This unit is made up of sandstone-claystone-mudstone-marl alternation, and contains a number of dacitic tuff layers and lenses (Figure 3). The unit is about 150 m thick. The sandstones dominate the succession, being grey and beige in color and thinly to medium-bedded. The claystones, mudstones, and sandstones, cropping out at different levels of the sequence, are grey or light green in color, and thinly bedded. The unit N2 is interpreted as a lacustrine environment due to geologic and morphologic features including in this study (Figure 3).
3.6. Marl and Limestones (N3)
The unit N2 is in the southern part of the study area (Figure 3) overlain by a 100-m thick alternation of marl- claystone-limestone (the unit N3). Unit N3 consists of silex nodules, oolites, and pisolites.
3.7. Volcanic Rocks
The Menderes Massif rocks, and the Kale crest dolomitic limestones of the Demirci basin and sedimentary succession (N1 and N2) are cut by trachytic, dacitic, and trachyandesitic volcanic rocks where volcanic centers are located along the approximately northeast-striking normal faults (geologic section line A-A' aregiven in Figure 2; Figure 4). The pyroclastic beds increase in thickness and abundance towards the Kale Crest volcanic center.
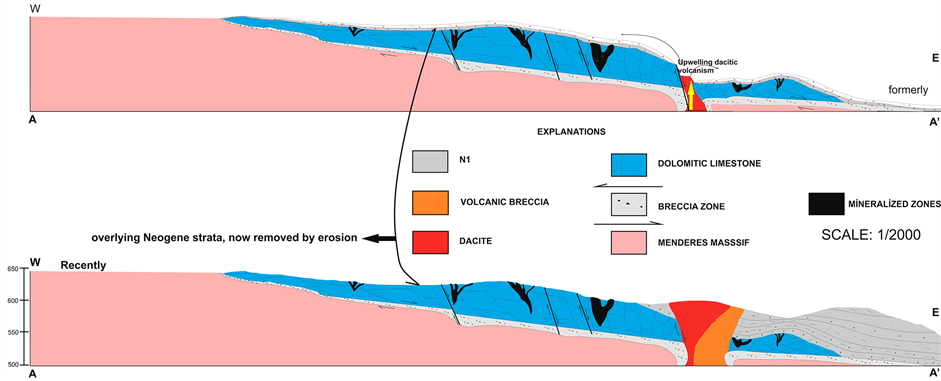
Figure 4. (a) One of the dacitic volcanic centers, intruding through the volcano-sedimentary basin and (b) a dacitic volcanic center on the Kale crest in the Demirci basin.
The pyroclastic beds form the roof of the Kale crest dolomitic limestones. This is observed in the middle part of the study area near the normal fault contact. Mineralogically pyroclastic beds consist of glassy material with fine crystals of quartz and feldspar.
4. Analytical Techniques
Polished thin sections were studied by transmitted and reflected optical microscopy. The radiometric measurements for U in the study field were obtained by γ-ray spectrometer (Gamma-Scout, Online Model, radiation detector, US standard). Whole rock samples were analyzed by inductively coupled plasma optic emission spectrometry (ICP-OES) for major, trace and rare earth elements (REEs) and major oxides by X-ray fluorescence (XRF) for 16 trace elements, and for total sulfur, organic carbon, and total carbon dioxide at the ACME analytical laboratories (Canada). The sixteen rock samples were rushed, split, and pulverized (250 gr to 200 mesh), then digested with LF following a multi-acid digestion (1:1:1 (HCl-HNO3-HClO4)) and analyzed by ICP-OES. CO2 total, Corganic and Stotal were measured after leaching by HNO3 with Leco 744. SO4 contents of the studied samples were measured by calcination at 550˚C (Leco 744). Corg for the studied samples was measured by Leco 832. All samples were carried out from dolomitic limestomes in M1, conglomerate, sandstone and dacitic tuff in N1 and sandstone, limestone and marl in N2 zones where are shown on Figure 2.
5. Mineralization
Thinly scattered phosphorite (collophanite) grains and nodules are relatively common in many carbonate units deposited on stable shelves or in warm epicontinental seas [14] . Cathcart and Gulbrandsen listed numerous phosphate-containing limestones, marls, and carbonatic shales in North America [15] . These rocks, having the usual high trace U content (of the order of 60 - 100 ppm in the phosphate), are normally considered uneconomic unless they grade into bedded diagenetic phosphorites (as in Morocco) or unless scattered nodules have been residually enriched (as in Florida). In phosphorite deposits, values of 0.01 to 0.03 wt% U3O8 are generally regarded as potential sources of uranium [12] . The measured radioactivity values are range from 900 to 7600 cps, 400 to 1000 cps and 200 to 400 in M1, N1 and N2 units, respectively (Figure 3). If the Kale crest dolomitic limestones of the Demirci basin exceed this range, then these dolomitic limestones can be regarded as potential sources of uranium (Figure 4). The uranium mineralizations are in the form of thinly scattered phosphorite (collophanite) concentrated in breccia zones and fractures in the dolomitic limestone (Figure 4). The formation origin proposed for these mineralized zones is leaching of uranium and phosphate from the overlying low-grade Neogene cover (dacitic tuff-marl claystone), concentrated in the Kale crest dolomitic limestone. Mineralization has occurred in breccia zones and fractures in the Kale crest dolomitic limestone. The solutions were probably leached from overlying dacitic tuff-marl-claystone strata that have generally now been removed by erosion. The fractures in the dolomitic limestones do not exceed 50 cm in width and are generally discontinuous in length, rarely exceeding 15 m. The highest-grade ore is in a very fractured and brecciated zone, associated with the Kale crest dolomitic limestones of the Demirci basin. The uranium mineralizations, from a few to 40 cm, are observed depending on supergene phosphate-filled cracks and fractures. The supergene enrichment in the dolomitic limestones is overlain by an intensely altered volcanic rocks, and leached from overlying Neogene strata (dacitic tuff-marl-claystones) that have generally now been removed by erosion. The geometry of the supergene enrichment zone is irregular and is in the form of cracks, fractures, and breccias, associated with dolomitic limestones. The mineralogical features show that the uranium mineralizations associated with flourapatite-rich rocks have been formed within calcite matrix fractures; cracks systems; and limestone, claystone, marl, and silicified breccia zones in the lacustrine sediments that are observed in the Kale crest dolomitic limestones. Brecciated fragments of the Kale crest dolomitic limestones occur in a matrix of uraniferous collophanite (thinly scattered phosphorite). Needle-like apatite crystals are observed in a matrix of uraniferous collophanite (thinly scattered phosphorite). Opaque uranium minerals are observed in the carbonate matrix and calcite-filled fractures and fracture systems of studied samples taken from different units of the Neogene sediments (marl, claystone, and volcanic levels) and from limestones outcropping around Rağıllar in western Turkey.
6. Geochemical Results
The analyses results for the studied samples are shown in Table 1. The main oxide content of the studied rock samples suggests the presence of three different rock groups: 1) limestone (LF1, LF6, LF7, LF8, LF10, LF 11, LF 12, LF 13, LF 14, LF 15, and LF 16), 2) marl (LF 3 and LF 4), and 3) claystone (LF 2, LF 5, and LF 9). Figure 5(a), Figure 5(b), Figure 5(c), and Figure 5(d) shows the relationships between uranium and total sulphur TOT/S total carbon TOT/C, organic carbon (ORGC), and SO4, respectively. According to Figure 5(a) and Figure 5(d) showing the relationship between uranium and total S, uranium and SO4 were more closely correlated than uranium and Ctot, or uranium and Corg (Figure 5(b) and Figure 5(c)). In addition, the distribution relationship between thorium and sulfate shows a poorer correlation than the distribution relationship with uranium. This indicates that sulfate concentrations in solution do not affect the thorium concentration. Figure 5(e) and Figure 5(f) shows the associations between uranium, and P2O5 and SiO2, respectively. Figure 5(g) shows the associations between Al2O3 and Fe2O3. Excellent distribution relationships are observed for P2O5 and uranium, regardless of the lithological features. However, except for some sample points (LF 2, LF 4, LF 5, LF 12, and LF 13), the Fe2O3 has watched that it offers same distribution relation with uranium. When the distribution relationships between uranium and SiO2 and Al2O3 are examined, no distribution relationship was observed between the main oxides and uranium.
7. Discussion
The major oxides and trace element concentrations were obtained from the study area. These values were examined by comparison with average values for claystone and carbonate rocks from Clarke and Washington [17] ; Vogt [18] . When these data are taken into account, the average P2O5 content of the samples is estimated (17.16%) is higher than 101 and 429 times the average claystone and carbonate rocks content, respectively. That is why uranium may be adsorbed in dolomitic limestones that the adsorbtion of uranium can be increased the raltive amounds of precipitated due to metal-ligand complex. Al-Eshaikh et al. (2013) determined the concentration of the major oxides, such as MgO, Al2O3, and Fe2O3, present in the phosphate ore of the Jalamed regions [6] . Nevertheless, the concentration of phosphorus-pentoxide was determined to be greater (30%) than the content of the other three main oxides. The concentration of calcium oxide varies from about 49% - 55% depending on the location. Consequently, Al-Eshaikh et al. observed that the uranium concentration seems to follow the concentration of phosphorus-pentoxide; where the P2O5 concentration increases, the uranium concentration also increases [6] . Many studies have determined that hydraulic and geochemical processes that cause contamination (U6+) in the groundwater-river mixing zone [19] [20] . These studies have determined that the distribution and concentration of calcite can increase the pH of groundwater, and that uranium-bearing solutions prefer solid phases to aqueous systems. This condition is more effective in metal precipitation that may occur from infiltration and reactions in the vadose zone than in metal precipitation that occurs from seasonal water table fluctuations. Philips and Watson showed that dolomitic gravels can increase groundwater pH from 3.2 to 6.5 [10] . Therefore, precipitated metals in the dolomite gravel have been transported from sandy and shaly sediments.
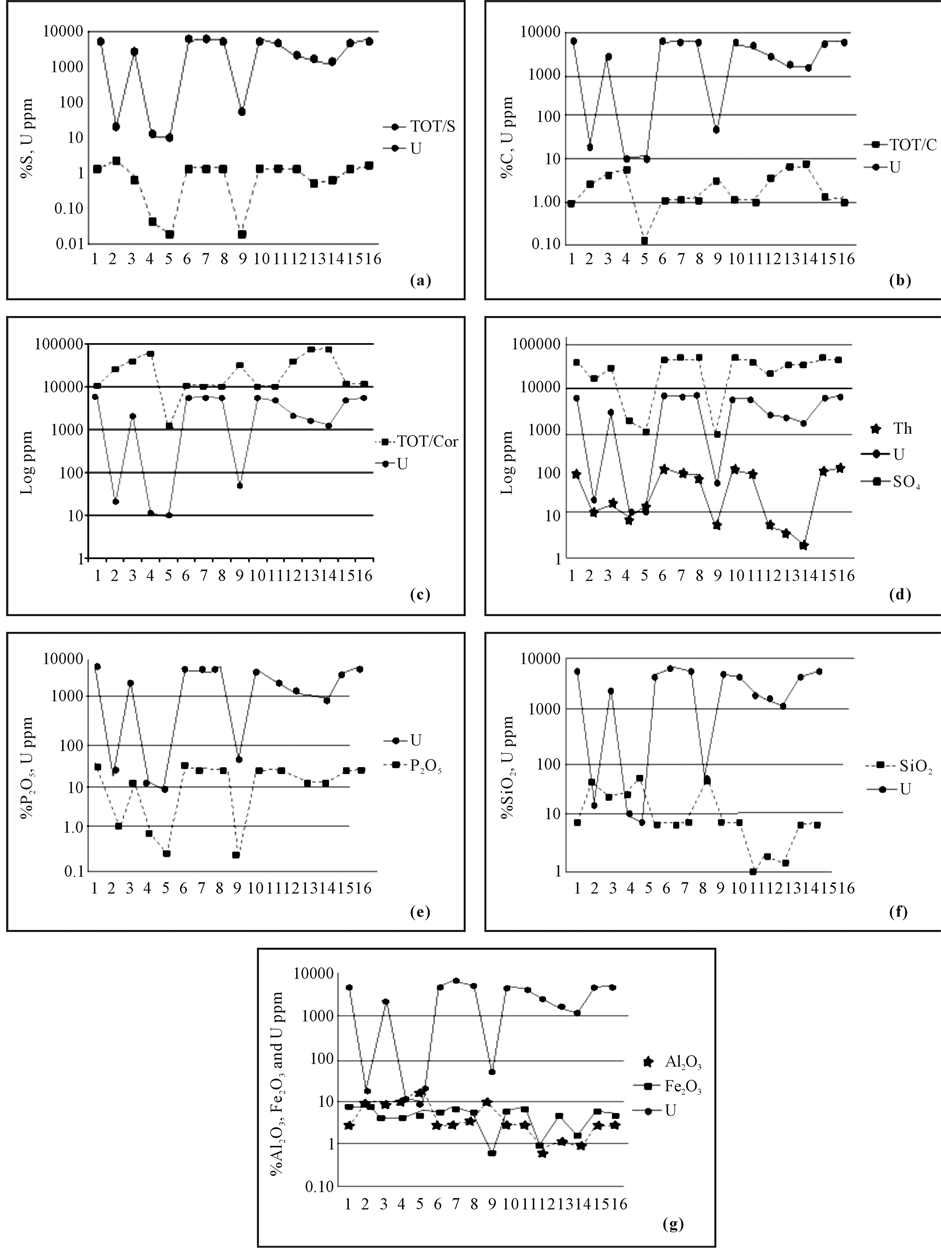
Figure 5. (a) Distribution graph of TOT/S and U; (b) distribution graph of TOT/C and U; (c) distribution of organic carbon (Corg) and uranium; (d) distribution of U-Th-SO4; (e) distribution of U and P2O5; (f) distribution of U and SiO2; and (g) distribution of Al2O3-Fe2O3-U.

Table 1. Major oxide and some trace elements (using by HF, HNO3 and HClO4 exraction) XRF, TOT/C, TOT/S, SO4 and C/ORG Leco (ion chromatograpy) analysis. Major oxide and TOT/C, TOT/S SO4, C/ORG values in %, trace element values in ppm are given.
Positive correlations between major oxides, trace elements, and rare earth elements are shown in Table 2 and negative correlations between major oxides, trace elements and rare earth elements are shown in Table 3. Positive correlations between major oxides and rare earth elements are shown in Table 4 and negative correlations between trace elements and rare earth elements are shown in Table 5. When these data are taken into account, a positive correlation (r ≥ 0.90) was determined between SiO2, and Al2O3, K2O, and Ta. A moderate positive correlation was determined between P2O5 and CaO. The presence of strong positive correlations (r ≥ 0.90) was determined between TiO2 and Ba, Co, Nb, Cu, La, Ce, Pr, and Nd.
A strong negative correlation (r ≥ −0.90) was determined between CaO and SiO2, Al2O3, and K2O. A moderate negative correlation (r > −0.70 to −0.90) was determined between CaO and La, Ce, Pr, and Nd. A strong positive correlation (r ≥ 0.90) was determined between the following trace elements: Ba-Co, Ba-Cs, Ba-Cu, Ba-Ni, Be-U, Be-Zr, Co-Nb, Co-Cu, Co-Ni, Ga-Rb, Nb-Ta, Nb-Cu, Th-U, Th-Y, Th-Pb, Th-Sb, U-Zr, U-Y, U-Pb, U-As, U-Sb, Y-Pb, Mo-As, Pb-Sb, Pb-As, Zn-Hg, and As-Sb. A strong positive correlation (r ≥ 0.90) was determined between the following trace elements and rare earth elements: Ba-Ce, Co-La, Co-Ce, Co-Pr, Co-Nd, Nb-La, Nb-Ce, Nb-Pr, Nb-Nd, Th-Dy, Th-Ho, Th-Er, Th-Tm, Th-Yb, Th-Lu, U-Ho, U-Er, U-Tm, U-Yb, U-Lu, Y-Tb, Y-Dy, Y-Ho, Y-Er, Y-Tm, Y-Yb, Y-Lu, Cu-La, Cu-Ce, Cu-Pr, Cu-Nd, Pb-Dy, Pb-Ho, Pb-Er, Pb-Tm, Pb-Yb, Pb-Lu, Sb-Yb, and Sb-Lu (Table 5). A moderate negative correlation (from r = −0.70 to −0.90) was determined between the following trace elements: Be-Ta and Nb-U. Thorium generally shows an inverse relationship with U, indicating that it precipitates from the surface down (above the water table) to the deeper zones (below the water table) as indicated by Philiphs and Watson [10] . In this study, it was determined that uranium has been much more deposed in dolomitic limestones due to increase pH in alkalin environment. Also, the other important factor on uranium deposit is uranium sulphate compounds in the zone of oxidation due to sulfur-rich fluids in the zone of reduction (e.g. pyrite) in fine grained sedimentary rocks such as clay. Figure 4 shows that uranium may be transported by acidic groundwater; however, in carbonate environments and in the groundwater-river mixing zone it is likely to be enriched through occurrence in CO3, PO4, and SO4 compounds (Figure 5(c); Figure 5(d); Figure 5(e)).
Tang et al. indicated that uranium carbonate minerals such as liebigite (Ca2UO2(CO3)3∙10H2O) might occur in
Table 2. The positive correlation coeficients between major oxides, trace elements and REEs.
Table 3. The negative correlation coeficients between major oxides, trace elements and REEs.
Table 4. The positive correlation coefficient between trace elements and REEs.
Table 5. The negative correlation coefficient between trace elements and REEs.
environments with pH > 5 [21] . Wang et al. examined the distribution of uranium in river sediments around the Tianyuan phosphate deposit in China, and stated that the distribution of uranium is controlled by the adsorption of organic compounds [7] . In this study, it has been determined that the relationship between organic carbon and uranium is not as well correlated as the relationship between U and P2O5. This is supported by the idea that the enrichment of uranium forms inorganic carbon compounds and inorganic phosphate complex. Therefore, uranium minerals are thought to be formed as UO2(HPO4)2 compounds with phosphorus complexes derived from flourapatite, or may be formed as oxide compounds. The solubility coefficients of uranium compounds have been calculated. and using mineral transport equilibrium (MINTEQ Dat) [22] . These have been calculated using the following thermodynamic equations: logK = −5.25 (1), 9.94 (2), and 44.7 (3). Wang et al. [7] , identified that the dominant species of uranium minerals in river sediments within the pH range of 7.2 - 10.4 are as follows:
1) 
2) 
3) 
U-Zr, U-Y, U-Pb, U-As, and U-Sb correlations exhibit high positive correlations (r > 0.90), indicating that uranium is enriched alongside these elements. It is suggested that source of uranium may be weathered metagranites from the Menderes Massif and moved by Pb, As and Sb rich hydrothermal fluids. The chondrite normalized and Ce/chondrite-Yb/chondrite distribution graphics indicate the presence of negative Eu anomalies (Fig- ure 6), as shown in the study by Graff [23] , indicative of the oxidation zone. However, Figure 7 shows an increase in light rare earth elements (LREEs) concentrations in samples LF 2, LF 4, and LF 9. These samples were taken from within the dacitic rocks, which are close to the fault zone. The presence of strong positive correlations between uranium and heavy earth elements (HREEs) are due to the stronger metallic properties of HREEs compared with LREEs. Moreover, the same relationship is also seen for Pb and Sb, suggesting the same origin for these metals. The presence of positive correlations between Cu, Ce, and La may suggest that copper is transported into shallow environments by moving groundwater. The negative Ce anomaly in the hydrothermal solution reveals the contributions of hydrothermal fluids with volcanogenic origin [23] ; a positive Ce anomaly is

Figure 6. REE/chondrite normalized spider diagram.
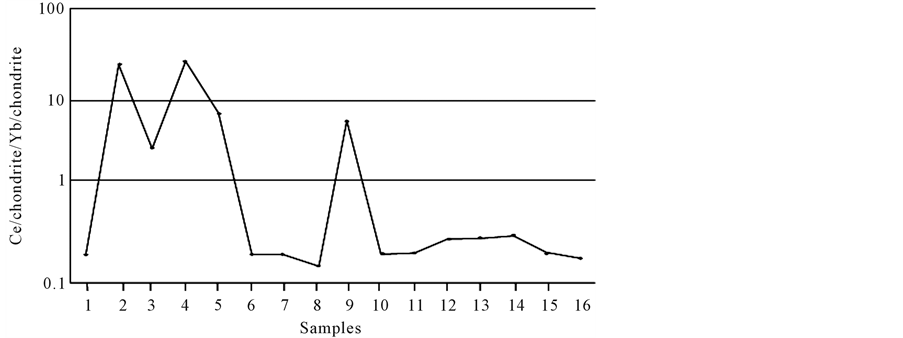
Figure 7. Ce/chondrite-Yb/chondrite distribution graph.
observed in the moving groundwaters and river waters [24] . In additon, the uranium minerals were observed in the apatite-rich carbonate matrix and in calcite-filled fractures and fracture systems of the studied samples taken from different units of the Neogene sediments (marl, claystone, and volcanic levels) and from dolomitic limestone outcropping around Rağıllar village.
8. Conclusion
The distribution of uranium in rock samples and the factors that affect this distribution have been examined in samples taken from different units of the Neogene sediments (marl, claystone, and volcanic levels) and limestones around Rağılllar village, which show high levels of radioactivity. In this study, the distribution of uranium was determined to be dependent on the physicochemical properties of uranium-rich solutions. The presence of a strong positive correlation between uranium and P2O5 indicates that uranium can be deposited into phosphorus compounds. The negative distribution relationship between Corg and U shows that primary mineralization is formed by dissolving minerals in the form of inorganic compounds. The mineralization consists of uranium minerals filled by supergene redistribution in cavities (such as cracks, fractures, breccias) associated with dolomitic limestones. In addition, negative Eu anomalies indicate the oxidation zone, which is considered an appropriate zone for the enrichment of uranium in phosphate species. Appropriate zones for uranium enrichment were formed as a result of the movement of groundwater from acidic environments to alkaline environments along permeable, crack and fracture systems within the volcano-sedimentary deposits in the Rağıllar vicinity.
Acknowledgements
This work was supported by the Firat University Scientific Research Projects Unit (FUBAP).
Cite this paper
Leyla Kalender,Ömer Nedim Alçiçek,Ezgi Gürgenç, (2016) Geological and Geochemical Features of Uranium Mineralization in Western Turkey. International Journal of Geosciences,07,409-424. doi: 10.4236/ijg.2016.73032
References
- 1. Schuillng, R.D. (1961) Suggestions to the Detailed Geological Studies and Exploration around of Ragillar Anomaly. Report of Mining Research and Exploration (No: 3156, 1961), Ankara, 7 [in Turkish].
- 2. Ucakcioglu, S. (1976) Uranium deposit in Koprübasi vicinity. Report of Mining Research and Exploration (No: 731976). Ankara [in Turkish].
- 3. Sadik, U. (1973) Uranium Leaching Experiments from the Koprübasi Region. Report III. Technology Department, MTA Institute, Report No: 4963, Ankara, 12s [in Turkish].
- 4. Yilmaz, Y., Genc, S.C, Gürer, F., Bozcu, M., Yilmaz, K., Karacik, Z., Altunkaynak, S. and Elmas, A. (2000) When Did the Western Anatolian Grabens Begin to Develop? In: Bozkurt, E., Winchester, J.A. and Piper, J.A.D., Eds., Tectonics and Magmatism in Turkey and the Surrounding Area, Geological Society, 173, 131-162.
- 5. Banning, A., Cardona, A. and Rüde, T.R. (2012) Uranium and Arsenic Dynamics in Volcano-Sedimentary Basins—An Exemplary. Applied Geochemistry, 27, 2160-2172.
http://dx.doi.org/10.1016/j.apgeochem.2012.01.001 - 6. Al-Eshaikh, M.A., Kadachi, A.H. and Sarfraz, N.M. (2013) Determination of Uranium Content in Phosphate Ores Using Different Measurement Techniques. Journal of King Saud University—Engineering Sciences, 26, 26-29.
- 7. Wang, X., Ni, S. and Shi, Z. (2014) Uranium Distribution in the Sediment of the Mianyuan River near a Phosphate Mining Region in China and the Related Uranium Speciation in Water. Chemie der Erde -Geochemistry, 74, 661-669.
- 8. Romaniello, S.J., Hermann, A.D. and Anbar, A.D. (2013) Uranium Concentration and 238U/235U ?sotope in Modern Carbonates from the Bahamas: Assessing a Novel Paleoredox Proxy. Chemical Geology, 362, 305-316. http://dx.doi.org/10.1016/j.chemgeo.2013.10.002�
- 9. Szecsody, J.E., Truex, M.J., Qafoku, N.P., Wellman, D.M., Resch, T. and Zhonglim, L. (2013) Influence of Acidic and Alkaline Waste Solution Properties on Uranium Migration in Subsurface Sediments. Journal of Contaminant Hydrology, 151, 155-175. http://dx.doi.org/10.1016/j.jconhyd.2013.05.009
- 10. Philiphs, D.H. and Watson, D.B (2015) Distribution of Uranium and Thorium in Dolomitic Gravel Fill and Shale Saprolite. Journal of Hazardous Material, 285, 474-482.
http://dx.doi.org/10.1016/j.jhazmat.2014.11.046 - 11. Kaya, O. (1981) Miocene Reference Section for the Coastal Parts of West Anatolia. Newsletters on Stratigraphy, 10-3, 164-191.
- 12. Taylor, D. (1962) Geology of the Ra??llar Uranium Mineralizations. Report of Mining Research and Exploration (No: 3192, 1962). Ankara [in Turkish].�
- 13. Ayan, M. (1973) Gordes Migmatites. Bulletin of Mineral Research and Exploration Institute, 65, 132-155.
- 14. Laznicka, P. (1985) Precambrian Empirical Metallogeny. Vol 1: Phanerozoic Environments, Associations and Deposits. 1002.
- 15. Cathcart, J.B. and Gulbrandsen, R.A. (1973) Phosphate Deposits. In: Brobst, D.A. and Pratt, W.P., Eds., United States Mineral Resources: US Geological Survey Professional Paper 820, 515-525.
- 16. Dilek, Y., Altunkaynak, S. and Oner, Z. (2009) Syn-Extensional Granitoids in the Menderes Core Complex and Thelate Cenozoic Extensional Tectonics of the Aegean Province. Geological Society, Special Publication, 321, 197-223.
- 17. Clark, F.W. and Washington, H.S. (1924) The Composition of the Earth’s Crust: U.S. Geol. Survey (Prof. Paper 127, 1924), 117.
- 18. Vogt, J.H.L. (1931) On the Average Composition of the Earth’s Crust with Particular Reference to the Contents of Phosphoric And Titaniz Acid: Norske Vidensk-Akad Skr. Mat-Naturv. KI, 7, 1-48.
- 19. Fritz, B.G., Mackley, R.D., Khon, N.P., Patton, G.W., Gilmore, T.J., Mendoza, D.P., McFarland, D.P., Bunn, A.L. and Arntzen, E.V. (2007) Investigation of the Hyporheic at the 300 Area, Handford Site. PNNL-16805. (Pasific Northwest National Laboratory, Richland, Wash.).
- 20. Ma, R., Liu, C., Greskowiak, J., Prommer, H., Zachara, J. and Zheng, C. (2014) Influence of Calcite on Uranium (VI) Reactive Transport in the Groundwater-Riwer Mixing Zone. Journal of Contaminant Hydrology, 156, 27-37. http://dx.doi.org/10.1016/j.jconhyd.2013.10.002
- 21. Tang, G., Luo, G., Watson, D.B., Brooks, S.C. and Gu, B. (2013) Prediction of Aluminum, Uranium and Co-Contaminants Sorption and Precipitation during Titration of Acidic Sediments. Environmental Science & Technology, 47, 5787-5793. http://dx.doi.org/10.1021/es400169y
- 22. Guillaumont, R., Fanghanel, T., Fuger, J., Grenthe, I., Neck, D.V. and Palmer, M.R. (2003) Update on the Chemical Thermodynamics of Uranium, Neptunium, and Plutonium. 2nd Edition, Elsevier, Amsterdam.
- 23. Graff, J.L. (1978) Rare Earth Elements Iron Formationand Seawater. Geochim Cosmoshim Acta, 42, 1845-1850. http://dx.doi.org/10.1016/0016-7037(78)90239-9
- 24. Pearce, J.A. (1983) Role of the Sub-Continental Lithosphere in Magma Genesis at Active Continental Margins. In: Hawkesworth, C.J. and Norry, M.J., Eds., Continental Basalts and Mantle Xenoliths, Shiva, Nantwich, 230-249.
NOTES

*Corresponding author.