Food and Nutrition Sciences
Vol.4 No.2(2013), Article ID:27813,7 pages DOI:10.4236/fns.2013.42029
Development of Tea Whitener Using Concentrated Whey and Milk Solids
![]()
National Dairy Research Institute, Bangalore, India.
Email: *sat_kulkarni@yahoo.com
Received September 30th, 2012; revised November 12th, 2012; accepted November 20th, 2012
Keywords: Concentrated Whey; Homogenization; Sensory Evaluation; Toned Milk; Tea; Tea Whitener
ABSTRACT
Whey and toned milk was effectively used for the development of tea whitener. Cheese whey was concentrated to 12% solids in a vacuum evaporator, pasteurized at 72˚C ± 2˚C for 15 s, diluted back to 11.5% solids and was cold blended with toned milk of 11.5% solids in three ratios viz. 25:75, 50:50 and 75:25 and selected blends were homogenized at 1200 - 1500 psi. Tea was prepared by adding 80 mL whitener to 100 mL decoction and addition of sugar at 8% (w/v). The tea whitener was selected based on the sensory attributes of tea beverages. The colour of the beverages, tea whiteners and decoction were analyzed by reflectance meter and computer vision image analysis technique. The viscosity of the beverage was tested using a Brookfield viscometer. Coffee stability test was done to assess the stability of tea whitener under acidic conditions. Standard plate count, Coliform count and Presumptive Coliform test were done to assess the microbiological quality of the whitener. Homogenization had a positive impact on the viscosity and colour. The reflectance value of tea prepared from 25% homogenised whey milk blend and toned milk were in the range of 43 - 46 and 45 - 49, respectively. The viscosity of tea was found to increase with homogenization and whey levels. The sedimentation values of 25% whey blends and toned milk were 1.25 mL and 1 mL respectively. The shelf life of the blends was 2 days under refrigerated conditions. It can be concluded that a satisfactory tea whitener can be prepared by blending whey with toned milk in 25:75 proportion followed by homogenization.
1. Introduction
Whey is one the major by-products of dairy industry [1]. Whey is the serum portion of the milk, containing constituents which are in true solution; predominantly lactose, whey proteins and minerals [2]. Annual production of whey in India is estimated to be 270 million kilograms containing 16.2 million Kg of milk solids [3]. Large quantity of whey is unutilized and disposed off through effluent treatment systems leading to the loss of valuable milk nutrients. Whey is a potent pollutant with a biological oxygen demand of 35 - 45 grams per litre. Treating whey to statutory pollution control norms requires about 0.4 units of energy per litre and a cost of 40 - 45 paisa is incurred. Several attempts have been made to utilize whey solids effectively by concentration [4], by extracting whey proteins [5], whey soups [6], whey beverages [7]. However information on utilization of whey as beverage whitener is scanty. Tea is one of the most popular beverages over the globe. It is estimated that nearly one third of the milk purchased by the Indian consumer is utilized as tea or coffee whitener and the percentage is higher with the lower income group. In recent times, the cost of milk has increased considerably and the trend is continuing, adding to the economic burden of low income group consumers. The present investigation aims at studying the feasibility of substituting whey for milk and determining its suitability as tea whitener.
2. Materials and Methods
2.1. Standardization of Decoction and Optimization of Tea Beverage
Decoction was prepared using 2.5 g tea powder per 100 mL water. The tea powder was steeped for 2 minutes in boiling water and filtered to get the decoction. In all the trials a known brand of tea powder was used. Tea was prepared from toned milk (TM) by using 60 mL (T1), 70 ml (T2) and 80 mL (T3) of TM per every 100 mL of decoction and 8% sugar (w/v basis) to optimize the preparation of control tea beverage.
2.2. Preparation of Whey-Milk Tea Whitener
Cheese whey and paneer whey were filtered through double layer muslin cloth and was concentrated to 12% solids in single effect evaporator at 24 Hg vacuum. The concentrated whey was filtered and pasteurized before being cooled to room temperature. The processed product was cold stored at 5˚C - 7˚C. Concentrated whey (12% TS) was adjusted to 11.5% solids by the addition of potable water. It was then cold blended with TM in three proportions namely 25:75 (Wb1), 50:50 (Wb2) and 75:25 (Wb3) respectively to yield whey-milk tea whiteners. They were then cold homogenized at 1200 - 1500 psi in Single stage. The temperature was maintained at 5˚C - 7˚C. The homogenized blends were immediately pasteurized to avoid microbial proliferation. The unhomogenized and homogenized tea whiteners were cold stored for further analysis.
2.3. Optimization of Whey-Milk Tea Whitener
The sensory acceptance of tea beverages prepared from whey-milk tea whiteners was used as the selection criteria for the tea whiteners. The tea beverages, T1, T2 and T3 were prepared by heating Wb1, Wb2 and Wb3 respectively, to boiling point followed by the addition of 8% sugar on w/v basis and then blending with hot decoction. A control tea (T4) was prepared from TM. The tea beverages prepared where then subjected to sensory analysis by a selected panel of judges using 9 point hedonic scale for appearance and colour, body and texture, flavour and overall acceptability. The sensory scores were then compared against control.
2.4. Physico-Chemical and Microbial Analysis
The moisture, fat, acidity and ash content of whey and whey-milk tea whiteners were determined by the method described in IS: SP-18, part XI [8]. The protein content of the whiteners and solids content of the decoction were analysed by methods described in Association of Official Analytical Chemists (AOAC) [9]. The stability of wheymilk tea whitener to acidic conditions were analysed by feathering resistance test proposed by Nath et al. [10]. The viscosity of the tea beverages was analysed by Brookfield viscometer (DV Pro II with Spindle 18). The colour of decoction and tea was analysed using reflectance meter (Model CL-28 of ELICO PVT. LTD., Hyderabad). The reflectance values were determined by keeping reflectance meter on the surface of sample bottles in which the product was filled. Reflectance values along the four surfaces of the sample bottles were taken. The colour of the decoction, tea beverages and wheymilk tea whiteners were also measured using a computer based image analysis technique. The samples were placed in petriplates of (3 mm thickness and 75 mm diameter) and scanned using flatbed scanner (Model: HP Scanjet 3970) at 1280 × 720 dpi resolution. The images were then imported into Adobe Photoshop 7.0 software and the “L”, “a” and “b” values were obtained from the histogram window. These values were converted into CIELAB (Commission Internationale de L’Eclairage) L*, a* and b* using the following formulae [11]. According to International Commission of Illumination [12], a colour can be defined by three parameters namely L*, a* and b*. L* is a measure of lightness or luminance, which ranges from 0 (black) to 100 (white), and a* and b* are the two chromatic components, which range from −120 to 120 (a* from green to red and b* from blue to yellow) [13].
 (1)
(1)
 (2)
(2)
 (3)
(3)
The browning index of the samples was calculated using the formulae given by Oliveira et al. [14].
 (4)
(4)
 (5)
(5)
Total plate count, Coliform count and Presumptive coliform test were conducted to determine the microbeological quality of the whey-milk tea whiteners by methods described in IS: SP-18 Part XI [8]. The shelf life characteristics were studied by packing 200 mL of the samples LDPE pouches and stored at 7˚C ± 2˚C and by assessing the changes in quality parameters with time.
2.5. Statistical Analysis
Statistical analyses of the sensory data and reflectance values were done using SPSS v. 15.0 [15]. One way Analysis of Variance (ANOVA) was used to assess the statistical significance of the scores and post hoc tests (Dunnett’s two sided t test and Duncans’ Multiple Range Test) were done to assess the difference between tea beverages with respect to quality parameters. The sensory scores of whey-milk tea whiteners during the storage period were analysed by Full Factorial Design and Tukey’s pair wise comparison.
3. Results and Discussion
3.1. Standardization of Decoction and Optimization of Milk Tea Beverage
The total solids of decoction were in the range of 0.75% - 0.82%. Decoction solids content was maintained within the range throughout the trials. Statistical analyses of the sensory data by one way ANOVA revealed that T3 was most acceptable among the tea beverages prepared from three different levels of milk viz. 60 mL (T1), 70 mL (T2) and 80 mL (T3) milk for every 100 mL decoction and 8% sugar on total volume basis (Table 1). These results were in agreement with earlier report that each litre of milk can produce about 12 - 15 cups of tea [16].
3.2. Selection of Type of Whey for the Preparation of Tea Whitener
Curdling of concentrated paneer whey milk blends was noticed during pasteurization, indicating its low heat stability. Blending concentrated paneer whey at even 10% levels of TM on total volume basis was not feasible. Even when the mix was cold blended and added to tea decoction and heated to 60˚C ± 5˚C there was flocculation. This can be attributed to the lower pH of 5.4 ± 0.1 and titratable acidity 0.35% lactic acid of paneer whey, and upon concentration the pH further dropped to 4.8 ± 0.10. The results were as anticipated as it was in tune with the effect of lower pH on the stability of milk systems [17].
Mixing of concentrated cheddar cheese whey (11.5% TS) with toned milk even upto 75 parts of the milk system did not result in any coagulation upon pasteurization. The pH of fresh cheese whey was 6.2 ± 0.1 and titratable acidity was 0.13% ± 0.05% lactic acid. The pH of concentrated whey with 11.5% solids was 6.2 ± 0.1 and titratable acidity was 0.30% ± 0.015% lactic acid. Better stability of blended system could be attributed to relatively lesser effect of blending cheese whey with milk on the pH and acidity characteristics. Jelen [18] has reported that that milk systems prepared with retentates from sweet whey were heat stable with no coagulation at 90˚C for 30 minutes, while acid whey retentates showed variable stability. Swaisgood [17] and Singh [19] have reported that interaction between denatured whey proteins and casein micelles contributes to the better stability of these systems. Cheese whey solids were used for the development of coffee drinks and coffee whitener by Dhaka et al. and Gruetzmacher and Bradley Jr. respecttively [20,21].
Table 1. Sensory scores of tea with different levels of added milk.
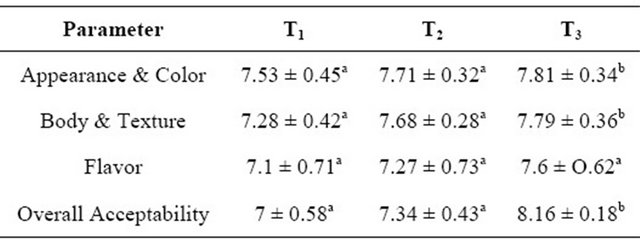
T1: 60 mL TM; T2: 70 mL TM; T3: 80 mL TM; Note: Mean of three trials. Scores on 9-point hedonic scale expressed as mean ± standard error. Figures with different superscripted letters differ significantly, statistically (p ˂ 0.05).
3.3. Optimization of Whey-Milk Tea Whitener
Sensory scores of tea beverages (T1, T2, T3 and T4) prepared from tea whiteners (Wb1, Wb2 and Wb3) and TM were statistically analyzed by One-way ANOVA using SPSS v. 15.0 [15] and were found to have significant difference between the samples (Table 2). Post hoc tests using Dunnett’s two sided t test was done to assess the treatment which contributed to the difference. Appearance and colour scores of tea beverages were found to decrease gradually from 8.14 to 7.79 with increase in the level of whey in the blend (Wb1 to Wb3). Difference in the scores between T1 and T4 (control tea) was observed to be statistically non significant. The body and texture scores of tea beverages T1, T2, T3 and T4 were 8 ± 0.14, 8 ± 0.17, 7.9 ± 0.20, 8.08 ± 0.08 respectively. The blending had only a marginal effect on the body and texture scores, as the variation among the scores was statistically non significant. The flavour scores of tea beverage prepared from the whey-milk tea whiteners and TM varied from 7.74 ± 0.21 to 8.12 ± 0.08. The flavour score of tea beverage prepared from Wb3 only differed significantly from control tea (T4). The overall acceptability scores of tea samples were observed to increase gradually with a decreasing whey level in the whitener from 7.72 ± 0.30 to 8.11 ± 0.10. The score of T3 was observed to be significantly lower than control tea (T4). There was no significant variation between the scores of T1 and T4; T2 and T4. The results based on individual characteristics and overall acceptability indicated that the treatment Wb1 is a feasible combination to produce a good quality tea whitener. Wb2 also produced a tea beverage with similar overall acceptability. Since the sensory quality of tea prepared from 75:25 whey milk tea whitener (Wb3) was poor, it was discontinued from the study. Earlier it was reported that whey solids could be incorporated between 5% and 30% to produce a good quality whitener [22].
Table 2. Sensory score of tea prepared from whey-milk tea whitener.
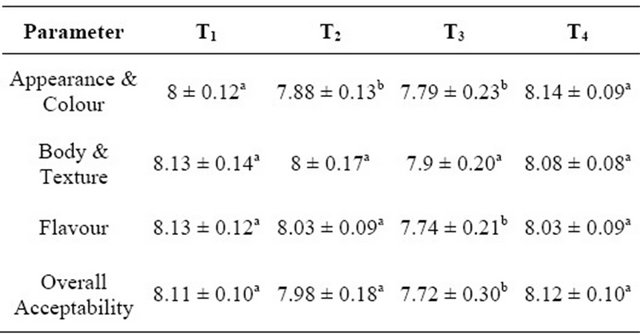
T1: Tea prepared from 25:75 whey-milk tea whitener (Wb1); T2: Tea prepared from 50:50 whey-milk tea whitener (Wb2); T3: Tea prepared from 75:25 whey-milk tea whitener (Wb3); T4: Tea prepared from TM (Control). Note: Mean of three trials. Scores on 9-point hedonic scale expressed as mean ± standard error. Figures with different superscripted letters differ significantly, statistically (p ˂ 0.05).
3.4. Effect of Homogenization on Whitening and Sensory Characteristics
Homogenization was used as one of the processes to further stabilize the quality parameters and improve acceptability of the whey-milk tea whitener. The sensory scores were statistically analysed, by one way ANOVA using SPSS v. 15.0 [15] and post hoc tests were done using Duncan’s Multiple Range Test (DMRT) to assess the difference between tea samples prepared from WbU1 (T1), WbU2 (T2), WbH1 (T3) and WbH2 (T4) and TM (T5) are presented in Table 3. The appearance and colour scores T1 and T2 were 7.83 ± 0.23 and 7.56 ± 0.31 respectively. Upon homogenization the scores increased to 8.07 ± 0.15 (T3) and 7.87 ± 0.27 (T4) indicating the positive influence of homogenization on the appearance and colour scores. T5 had a score of 8.01 ± 0.33 and the difference in scores between T3 and T5 were not significant highlighting the improvement in appearance and colour with homogenization. The body and texture scores T1 and T2 were 7.82 ± 0.29 and 7.60 ± 0.47 respectively. Upon homogenization the scores increased to 8.10 ± 0.13 (T3) and 7.96 ± 0.31 (T4) confirming the effect of homogenization in improving body and texture characteristics of the tea beverage. The mouth feel of tea prepared from WbH1 was very similar to that of tea from toned milk which is evident from similar body and texture scores. The homogenization resulted in marginal increase of flavour scores which was significant between T2 and T4 but, the scores between T1 and T3 were observed to be non significant. The inconsistent effect reflected in flavour score can be ascribed to the compositional variations T1 and T2. At higher ratio of whey incorporation there was a significant effect of homogenization on the flavour score while the difference was observed to be insignificant at lower levels of blending whey with milk. The overall acceptability scores indicate that homogenization had a significant positive influence as it is observed that scores of T4 at 7.84 ± 0.28 was significantly higher than 7.64 ± 0.29 for T2. Similarly the scores for T3 at 8.02 ± 0.16 were significantly higher than the scores 7.8 ± 0.29 for T1. The overall acceptability T5 was 8.00 ± 0.30 was observed to be significantly higher than T1, T2, T4 and was not different from the score of T3 at 8.02 ± 0.16. The results validated that homogenization is an important process which can be used effectively for improving the overall acceptability scores of whey-milk tea whitener. Trout [23] and Kulkarni et al. [16] have reported that the sensory attributes coffee and tea beverages were better when prepared from homogenized milk.
3.5. Physicochemical Characteristics and Microbiological Quality of Tea Whitener
3.5.1. Physicochemical Characteristics
The proximate analysis of the concentrated whey, wheymilk tea whitener, tea beverages and tea decoction are presented in Table 4. The total solids of all the tea whiteners and TM were maintained at 11.4% - 11.6% accurately by concentration and by subsequent dilution. The protein content in concentrated whey was observed to range between 1.5% - 1.6%, fat content 0.2% - 0.3% and minerals assessed as ash content was observed to be in the range of 0.84% - 0.90%. The acidity expressed as percent lactic acid ranged between 0.29 - 0.3. The whey compositions were in tune with reports of Pankaj [24] when calculated to equivalence. The protein, fat and mineral content for Wb1 ranged from 2.7% - 2.9%, 2.3% - 2.4% and 0.75% - 0.80% respectively. The protein, fat and mineral content for Wb2 ranged from 2.2% - 2.4%, 1.6% - 1.7% and 0.79% - 0.82% respectively. These results are in tune with the anticipated values by calculation. The pH of cheese whey (6.2 - 6.25) was similar to earlier reports [25]. The pH of Wb1 and Wb2 ranged from 6.35 - 6.50 and 6.30 - 6.40 respectively, marginally lower than of milk which is about 6.70 at room temperature [26].
The browning index and reflectance characteristics of tea samples and decoction are presented in Tables 5 and 6. The browning index of tea beverages prepared from whey-milk tea whiteners was higher than that of control tea. Homogenization improved the reflectance scores and lowered the browning index of the samples. Compositional difference markedly affected the colour characteristics. The slightly lower pH of whey-milk tea whiteners is another factor contributing to lower reflectance values.
Table 3. Sensory scores of tea prepared from homogenized and unhomogenized tea whiteners.
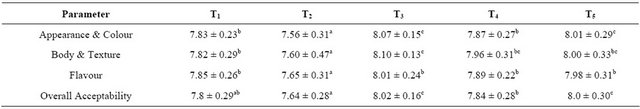
T1, T2: Tea prepared from unhomogenized 25:75 (WbU1) and 50:50 (WbU2) whey-milk tea whiteners respectively; T3, T4: Tea prepared from homogenized 25:75 (WbH1) and 50:50 (WbH2) whey-milk tea whiteners respectively. T5: Tea prepared from TM (Control). Note: Mean of five trials. Scores on 9-point hedonic scale expressed as mean ± standard error. Figures with different superscripted letters differ significantly, statistically (p ˂ 0.05).
Table 4. Proximate analysis.

Table 5. Color characteristics and viscosity of samples (tea and decoction).
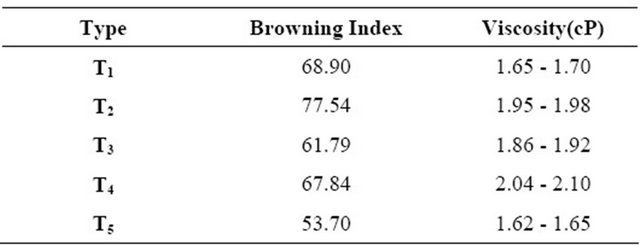
T1, T2: Tea prepared from WbU1 and WbU2 whey-milk tea whiteners respectively; T3, T4: Tea prepared from WbH1 and WbH2 whey-milk tea whiteners respectively; T5: Tea prepared from TM (Control). Note: Mean of three trials.
Table 6. Reflectance characteristics of samples (tea and decoction).
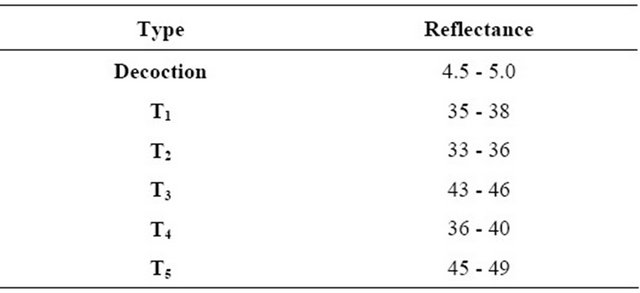
T1, T2: Tea prepared from WbU1 and WbU2 whey-milk tea whitener respectively; T3, T4: Tea prepared from WbH1 and WbH2 whey-milk tea whitener respectively; T5: Tea prepared from TM (Control). Note: Observed for 5 trials.
Zadow [27] has reported maximum reflectance for ultra high treated (UHT) milk at pH of 6.7. The coffee prepared from whey solids formulations were of darker colour than conventional coffee formulations [21]. The lightness characteristics of tea whiteners and decoction are presented in Table 7. The lightness values decreased with higher proportion of whey incorporation. The control milk had the maximum L* value, followed by WBH1. The lower lightness value for tea prepared from wheymilk tea whitener can be due to lower proportion of fat and casein in the samples. Walstra et al. [26] confirmed that light scattering ability of milk is primarily due its fat content. Phillips et al. [28] found that milk becomes whiter as the fat content increases. Homogenization re-
Table 7. Lightness values (L*) and sedimentation values of whey-milk blends and decoction.
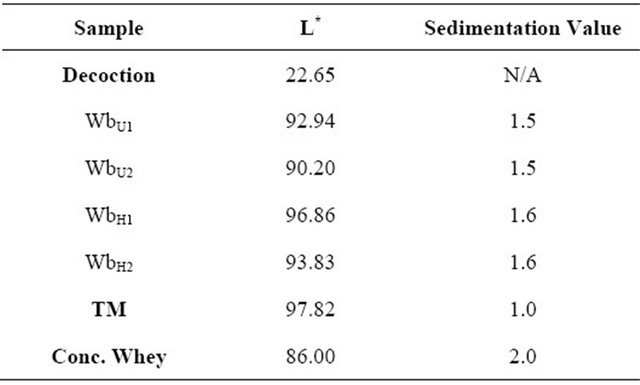
WbU1 and WbU2: 25:75 and 50:50 unhomogenized whey milk blends; WbH1 and WbH2: 25:75 and 50:50 homogenized whey milk blends; TM: toned milk (Control). Note: Mean of three trials.
sulted in higher lightness values for samples, as expected, as homogenization renders milk more opaque and densely white [23]. Figure 1 shows the variations in colour of tea beverages prepared from different whey-milk tea whiteners and TM. The viscosity of tea beverages T1, T2 and T5 (prepared from unhomogenized tea whiteners and TM respectively) were 1.65 - 1.70 cP, 1.95 - 1.98 cP and 1.62 - 1.65 cP, respectively. The viscosity of tea beverages T3 and T4 (prepared from homogenized tea whiteners) were 1.86 - 1.95 cP and 2.04 - 2.10 cP. Viscosity increased with higher levels of whey incorporation and homogenization (Table 5). Interaction between denatured whey proteins and casein micelles might be causing the higher viscosity. Lee and Sherborn [29] have reported heat treatment after homogenization leads to binding of whey proteins to fat globular membrane protein leading to increased viscosity. The ability of whitener to resist feathering (coffee stability test) and provide optimal whitening is presented in Table 7. The coffee prepared from Wb1 gave comparable sedimentation values to that of coffee prepared form TM. The coffee samples from Wb2 had higher sedimentation values which are indicative of their instability to acidic conditions. A sedimentation value between 0.75 and 1.25 mL are indicative of good stability [10].
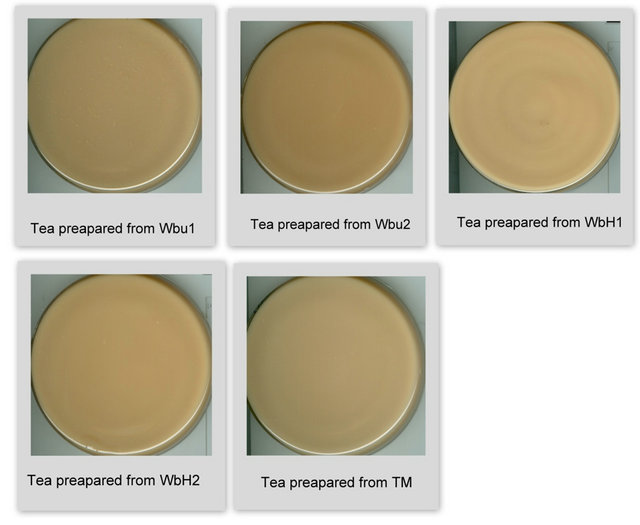
Figure 1. Images of tea prepared from whey-milk tea whiteners and TM.
3.5.2. Microbiological Quality of Tea Whitener
The microbiological quality of whey-milk tea whiteners analysed on day 1 is presented in Table 8. The total plate count, coliform count and Presumptive Coliform Test results were within the limits specified in IS: SP-18, part XI [8].
3.5.3. Shelf Life Studies of Tea Whitener
The shelf life characteristics of the most acceptable product i.e. 25:75 whey-milk tea whitener and control (TM) was studied under refrigerated storage. The quality attributes of tea whiteners deteriorated with the storage period. There was no marked quality deterioration between the first and second day of storage as evident from the sensory scores. Colour and appearance declined on third day of storage for whey-milk tea whiteners. Whey incorporation had a deleterious effect on the body and texture characteristics of the whitener, which was evident from the significantly different scores on first and second days of storage. Flavour of whey-milk tea whitener was significantly different between each day of storage. Overall acceptability decreased by third day of storage for WBH1 and WBU1. Analysis of sensory evaluation data by Full Factorial Design and post hoc tests by Tukey’s pair wise comparison confirmed that the shelf life of whey-milk tea whitener is limited to 2 days under refrigerated conditions (Table 9). Periodic sensory evaluation of whiteners at 24 hour interval, determined the deterioration in quality with time.
4. Conclusion
Cheese whey concentrated to 11.5% TS can be blended with toned milk to produce an optimum quality tea whitener. 25:75 whey-milk tea whitener (Wb1) was observed to be most acceptable in terms of sensory attributes.
Table 8. Microbial quality of tea whitener.
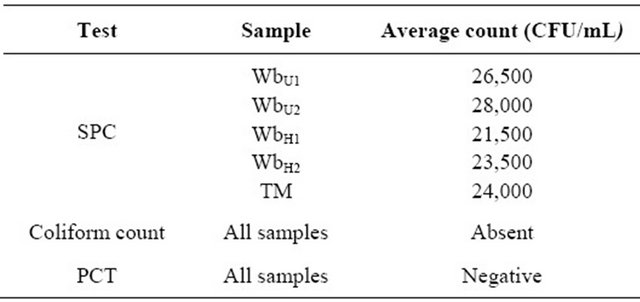
Note: Mean of three trials.
Table 9. Shelf life studies of tea whitener.
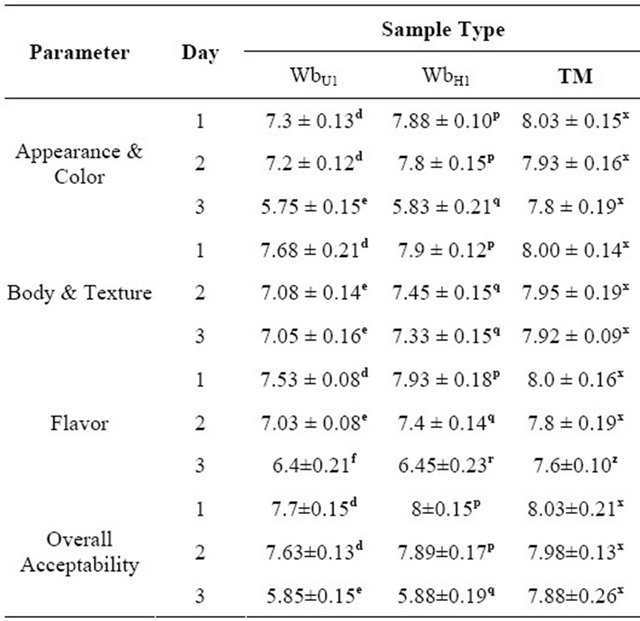
Note: Mean of three trials. Scores on 9-point hedonic scale expressed as mean ± standard error. Figures with different superscripted letters differ significantly, statistically (p ˂ 0.05).
Homogenization had a positive impact and improved the overall acceptability of the tea beverage. The % TS Wb1 was 11.4 - 11.6, while the tea beverage produced from this whitener contained about 13.4% - 13.6% TS which included the 8% sugar. The blending of whey resulted in decreased colour (reflectance and lightness) and higher browning index. Homogenization improved the colour of tea whiteners and tea. Similarly viscosity values were also found to improve with homogenization. Wb1 was found to have 2 days shelf life when stored at 7˚C ± 2˚C. The studies indicated that cheese whey could be successfully used for the production of tea whitener.
5. Acknowledgements
The authors wish to thank NDRI for the institutional fellowship. The authors extend their sincere thanks to Dr. K Jayaraj Rao and Dr. Heartwin P. Amaladass for the technical support in this study.
REFERENCES
- International Dairy Federation, “Bulletin of the International Dairy Federation,” Bulletin of the International Dairy Federation, The World Dairy Situation 438/2009, Berlin, 2009, pp. 7-14.
- International Dairy Federation, “Bulletin of the International Dairy Federation,” Bulletin of the International Dairy Federation, The World Dairy Situation 384/2003, 2003, pp. 1-69.
- M. V. Chandrashekar, “NDRI Scientists Maximise Use of Whey for Preparation of Bakery and Porridge,” 2010. http://www.fnbnews.com/article/detarchive.asp?articleid=28067§ionid=1
- M. Jarita and S. Kulkarni, “Incorporation of Concentrated Whey in Production of Soup Sticks,” Indian Journal of Dairy Science, Vol. 69, No. 1, 2009, pp. 14-19.
- H. Werner, “Whey Protein,” Dairy Industry International, Vol. 46, No. 9, 1981, p. 33.
- K. S. Arora and Y. K. Jha, “Whey—The Nectar from Milk,” Beverage and Food World, Vol. 32, No. 8, 2005, p. 43.
- Y. S. Keerthana and Y. K. Reddy, “Whey Beverage: Drink from Dairy Waste,” Beverage and Food World, Vol. 33, No. 6, 2006, pp. 71-73.
- IS: (SP: 18), “ISI Handbook of Food Analysis, Part XI: Dairy Products,” Indian Standards Institution, New Delhi, 1981.
- Association of Official Analytical Chemists, “Official Methods of Analysis of AOAC International,” 18th Edition, Washington DC, 2005.
- B. S. Nath, V. Unnikrishnan, N. N. Balasubramanya and C. Ram, “Quality of Milk Powders from South India with Reference to their Composition, Shelf Life and Functional Properties,” Final Report of Adhoc Research Scheme, Indian Council of Agricultural Research, 2000.
- K. L. Yam and S. E. Papadakis, “A Simple Digital Imaging Method for Measuring and Analyzing Color of Food Surfaces,” Journal of Food Engineering, Vol. 61, No. 1, 2004, pp. 137-142. doi:10.1016/S0260-8774(03)00195-X
- Commission Internationale de L’Eclairage, “Colorimetry,” Technical Report (15.2): Commission Internationale de L’Eclairage CIE, Vienna, 1986.
- Anonymous, “Adobe Photoshop 7.0 User Guide for Macintosh and Windows,” Adobe Systems Inc., California, 1998.
- F. Oliveira, M. J. Sousa-Gallagher, P. V. Mahajan and J. A. Teixeira, “Evaluation of MAP Engineering Design Parameters on Quality of Fresh-Sliced Mushrooms,” Journal of Food Engineering, Vol. 108, 2012, pp. 507-514. doi:10.1016/j.jfoodeng.2011.09.025
- “Statistical Package for the Social Sciences (SPSS v. 15.0),” IBM Corporation, New York, 2006.
- S. Kulkarni, K. J. Rao, B. V. Balasubramanyam, B. C. Ghosh, V. K. Kesavan and R. Sharma, “Production of Concentrated Milk for Market Milk Operation,” Annual Report NDRI (Deemed University), Indian Council of Agricultural Research, Karnal, 2001.
- H. E. Swaisgood, “Characteristics of Milk,” In: S. Damodaran, K. L. Parkin and O. R. Fennema, Eds., Fennema’s Food Chemistry, CRC Press, Boca Raton, 2008, pp. 885- 921.
- P. Jelen, “Heat Stability of Dairy Systems with Modified Casein-Whey Protein Content. Protein & Fat Globule Modifications by Heat Treatment, Homogenization & Other Technological Means for High Quality Dairy Products,” Proceedings of International Dairy Federation Seminar, Munich, 25-28 August 1992, pp. 259-266.
- H. Singh, “Heat Induced Interactions of Proteins in Milk. Protein & Fat Globule Modifications by Heat Treatment, Homogenization & Other Technological Means for High Quality Dairy Products,” Proceedings of International Dairy Federation Seminar, Munich, 25-28 August 1992, pp. 191-215.
- V. Dhaka, R. S. Dabur and Jyotika, “Utilization of Whey for Preparation of Coffee Drink,” Indian Journal of Dairy Science, Vol. 55, No. 2, 2002, pp. 86-88.
- T. J. Gruetzmacher and R. L. Bradley Jr., “Acid Whey as a Replacement for Sodium Caseinate in Spray Dried Coffee Whiteners,” Journal of Dairy Science, Vol. 74, No. 9, 1991, pp. 2838-2849. doi:10.3168/jds.S0022-0302(91)78464-6
- E. Charman, “Beverage Whitener Formulation,” European Patent No. 1443826, 2004.
- G. M. Trout, “Homogenized Milk—A Review and Guide,” Michigan State College Press, Michigan, 1950.
- B. M. Pankaj, “Development of Whey Based Jaggery and Feasibility of Its Application in Dairy Products,” M. Tech. Thesis, NDRI (Deemed University), Karnal, 2011.
- N. Goyal and D. N. Gandhi, “Comparitive Analysis of Indian Paneer Whey and Cheese Whey for Electrolyte Whey Drink,” World Journal of Dairy and Food Sciences, Vol. 4, No. 1, 2009, pp. 70-72.
- P. Walstra, J. T. M. Wouters and T. J. Geurts, “Dairy Science and Technology,” 2nd Edition, CRC Press, Boca Raton, 2006.
- J. G. Zadow, “The Influence of pH and Heat Treatment on the Colour and Stability of Ultra-High-Temperature Sterilized Milk,” Journal of Dairy Research, Vol. 38, No. 3, 1971, pp. 393-401.
- L. G. Phillips, M. L. Mcgiff, D. M. Barbano and H. T. Lawless, “The Influence of Fat on the Sensory Properties, Viscosity, and Color of Low Fat Milk,” Journal of Dairy Science, Vol. 78, No. 6, 1995, pp. 1258-1266. doi:10.3168/jds.S0022-0302(95)76746-7
- S. J. Lee and J. W. Sherbon, “Chemical Changes in Bovine Milk Fat Globule Membrane Caused by Heat Treatment and Homogenization of Whole Milk,” Journal of Dairy Research, Vol. 69, No. 4, 2002, pp. 555-567. doi:10.1017/S002202990200571X
NOTES
*Corresponding author.