Food and Nutrition Sciences
Vol. 3 No. 9 (2012) , Article ID: 22303 , 9 pages DOI:10.4236/fns.2012.39169
Acceptability Properties and Antioxidant Potential of Desi Chickpea (Cicer arietinum L.) Cultivars
![]()
1Master in Food Science and Technology, Faculty of Chemical-Biological Sciences, Autonomous University of Sinaloa, Sinaloa, Mexico; 2Northwest Regional Program for Doctorate in Biotechnology, Autonomous University of Sinaloa, Sinaloa, Mexico.
Email: *creyes@uas.uasnet.mx
Received July 16th, 2012; revised August 16th, 2012; accepted August 23rd, 2012
Keywords: Desi Chickpeas Cultivars; Acceptability Properties; Antioxidant Activity; Total Phenolic Content
ABSTRACT
The acceptability properties, total phenolic content, and antioxidant potential of four (red, green, brown, cream) desi chickpea (Cicer arietinum L.) cultivars from the World Germplasm Bank were evaluated. Protein content of the grains varied from 20.12% to 28.85% (dw), highest for Cream ICC3421. The water absorption capacity (WAC) and cooking time (CT) of the whole grains ranged from 97.7 to 117.5 g water/100g seeds (ww) and from 109.5 to 193.5 min, respectively; the highest WAC and lowest CT corresponded to Cream ICC3421 cultivar. The total phenolic content (TPC) and total hydrophilic antioxidant activity (AoxA) [oxygen radical absorbance capacity (ORAC) value] of desi chickpea cultivars varied from 746 to 1.286 µg gallic acid equivalents (GAE)/g sample (dw) and from 43.9 to 53.9 µmol Trolox equivalents (TE)/g sample (dw); Brown ICC3512 showed the highest ORAC value. Chickpea cultivars could contribute significantly to the management and/or prevention of degenerative diseases associated with free radical damage.
1. Introduction
Antioxidants are believed to play a very important role in the body defense system against reactive oxygen species (ROS), which are associated with the development of many chronic and degenerative diseases. Epidemiological and intervention studies indicated that legumes consumption is inversely associated with the risk of coronary heart disease [1], type II diabetes mellitus [2] and obesity [3], and results in lower LDL cholesterol and higher HDL cholesterol [4,5].
Chickpea (Cicer arietinum L.) is one of the most important grain-legume crops in the world, with a world production of 10.4 Mt [6]. Chickpeas contain high levels of proteins (17% - 25%, dw), and carbohydrates; they also supply some minerals (Ca, Mg, Zn, K, Fe, P) and vitamins like thiamine and niacin as well as unsaturated fatty acids (oleic, linolenic). Chickpea contain a wide range of phenolic compounds, which could be considered as bioactive compounds due to their antioxidant capacity [7]. Chickpeas contain isoflavones such as Biochanin in free forms (Biochanin A and B) and those linked to other compounds (Biochanin glucoside); the content of isoflavones represents the highest percentage of identified phenolics [8,9]; several biological activities have been associated with the isoflavones, including a reduction in osteoporosis, cardiovascular disease, prevention of cancer and for the treatment of menopause symptoms [10-12].
Chickpea seeds vary in size, shape and color. Based on these variations, chickpea cultivars are classified into two categories: kabuli and desi (Figure 1) [13]. The kabuli-type seeds have a thin seed coat ranging in color from white to cream and a 100-seed weight of 28 to 70 g. Desi-type chickpea seeds have a thicker, irregularly shaped seed coat, which ranges in color from light than to black, and a 100-seed weight of not more than 28 g [14]. Significant differences in these two groups have been observed by several researchers [15-18] with regard to their chemical composition, seed coat percentage, storage stability, water absorption capacity, cooking time, in vitro protein digestibility, total phenolics content, and antioxidant activity.
Acceptability properties in grain legumes include a wide variety of attributes, such as grain size, shape, color, appeareance, stability under storage conditions, soaking characteristics, cooking properties, quality of the product obtained and flavor. The soaking characteristics (water absorption capacity) and cooking time required for chickpea grains to reach an acceptable texture and texture characteristics of cooked grains are important factors influencing consumers’ perception of grain quality.
Antioxidant potential and acceptability characteristics in chickpea grains have not received enough attention in breeding programs. The objective of this research was to evaluate the acceptability properties, total phenolic content and antioxidant potential of four desi chickpea (Cicer arietinum L.) cultivars.
2. Materials and Methods
2.1. Chemicals
The reagents 2,2’azobis(2-amidinpropane), (+)-catechin, flourescein (FL) and Folin-Ciocalteu was obtained from Sigma Chemical Co. (St. Louis, MO, USA). Sodium hydroxide, hexane, methanol, ethanol and ethyl acetate used were analytical grade.
2.2. Legumes
Four desi chickpea cultivars (Red ICC14782, Green ICC5613, Brown ICC3512, Cream ICC3421) (Figure 1) from the Core Collection/World Germplasm Bank of the International Crops Research Institute for the Semi-Arid Tropics (ICRISAT) were grown on irrigated land at National Research Institute for Forestry, Agriculture and Livestock (INIFAP), Culiacán Experimental Station, Sinaloa, México. The chickpeas were harvested, shelled, cleaned and stored in tightly sealed containers at 4˚C until used.
2.3. Proximate Composition
The following AOAC [19] methods were used to determine proximate composition: Drying at 130˚C for moisture (method 925.09 B); incineration at 550˚C, for ashes (method 923.03); defatting in a Soxhlet apparatus with petroleum ether, for lipids (method 920.39 C); microKjeldahl for protein (Nx6.25) (method 960.52). Carbohydrate content was estimated by difference. All determinations were made by triplicate.
2.4. Physical Properties
The seed weight (g/100seeds) was determined in triplicate. The hectoliter weight (kg/100L) was calculated from 10 replicates using an OHAUS balance. Seed coats (SC) were separated from whole seeds (WS) and weighed; seed coat percentage (SCP) was calculated by the following equation: .
.
2.5. Water Absorption Capacity (WAC)
The WAC was determined using the method reported previously by Paredes-López, et al. [20]. Before the analysis the samples were adjusted to the same moisture content (11%). Whole seeds were soaked in four volumes of distilled water at 25˚C. After 12 h of soaking the samples were removed, drained, blotted and weighed. The increment in weight was reported as water absorption in g water/100g sample, (ww).
2.6. Cooking Time
A modified Mattson bean cooker (Figure 2), manually operated, was used to test 25 seed at a time. This equipment consists essentially of a frame with three perforated plates with 25 holes through which were placed 25 stainless steel plungers of the same weight and contact area (weight 65 ± 0.5 g, point diameter 2 mm). Each plunger was placed on every seed of chickpea. The 25 chickpea seeds were placed in the bottom plate. This equipment was placed in a container of boiling water. When the chickpeas were softened by cooking the plungers pass through the seeds. The CT was defined as the mean times three replications, when 15 (60%) plungers dropping and penetrating individual seeds. The 60% of grains penetrated corresponded to the sensorily preferred degree of cooking [20].
2.7. Extraction of Free Phytochemicals
Free phytochemicals in ground samples were extracted as previously reported [21] with some modifications. Briefly, 1 g of ground sample was blended with 10 mL of 80%
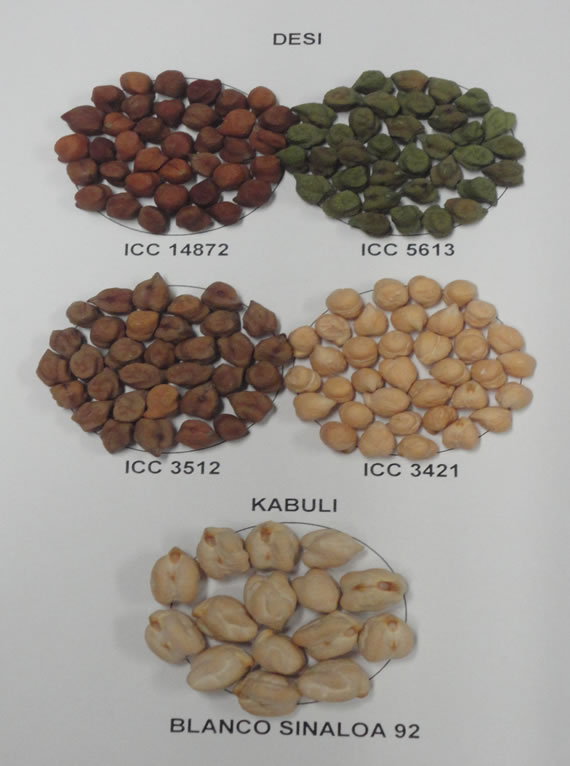
Figure 1. Desi and kabuli chickpeas cultivars.
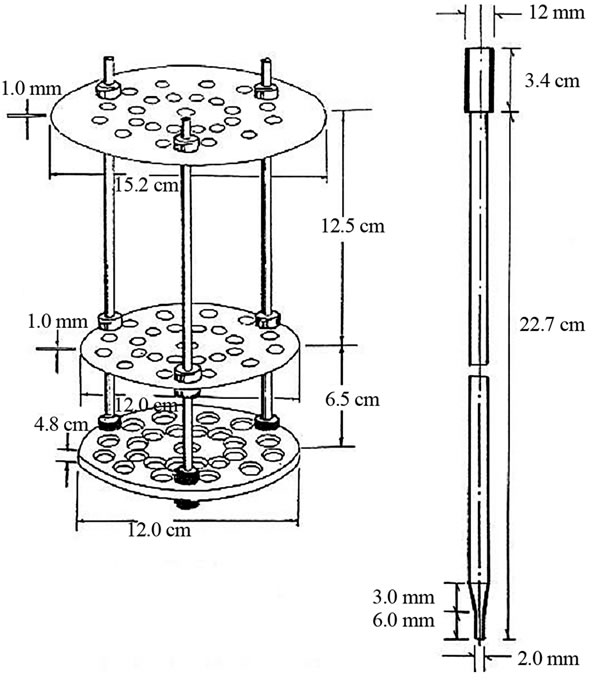
Figure 2. Modified Mattson bean cooker [20].
chilled methanol for 10 min and then centrifugated at 2.500 g for 10 min; the supernatant was evaporated to 2 mL under vacuum at 45˚C. The resulting extracts were frozen at –20˚C and stored until evaluation. For each sample, quadruplicate extractions were performed and used for analyses.
2.8. Extraction of Bound Phytochemicals
Bound phytochemicals in ground samples were extracted using a method previously reported [22] and modifications [23]. After extraction of free phytochemicals, the residue was digested with 10 mL of 2 M sodium hydroxide in a water bath at 95˚C for 30 min with previous removal of O2 using nitrogen gas. Then, the sample was agitated for 1 additional hour at room temperature (In the original technique of Adom and Liu [22] the residue was digested only at room temperature for 1 h). The mixture was acidified (pH < 2.0) with 2 mL of 2 M hydrochloric acid and extracted with hexane to remove lipids. The final solution was extracted five times with 10 mL of ethyl acetate for each extraction. The ethyl acetate fraction was pooled and evaporated to dryness under vacuum at 35˚C. Bound phytochemicals were reconstituted in 2 mL of methanol - water (50:50, v/v) to improve the solubility of the compounds and have a clear and homogeneous solution (In the original technique of Adom and Liu [22] bound phytochemicals were reconstituted only in 10 mL of water). The extracts were frozen and stored at –20˚C until evaluation. For each sample, quadruplicate extractions were performed and used for analyses.
2.9. Total Phenolic Content
The phenolic content of free and bound extracts from ground samples was determined using the colorimetric method [24]. Briefly, 20 µL of appropriate dilutions of extracts were oxidized with 180 mL of Folin-Ciocalteu reagent. After 20 min, absorbance of the resulting blue color was measured at 750 nm using a Microplate Reader (SynergyTM HT Multi-Detection, BioTek Inc., Winooski, VT, USA). A calibration curve was prepared using gallic acid as standard and total phenolics were expressed as micrograms of gallic acid equivalents (µg GAE)/g sample (dw).
2.10. Antioxidant Activity (AoxA)
Free and bound hydrophilic antioxidant capacities were determined using the oxygen radical absorbance capacity (ORAC) assay [25]. This assay is based on the degree of inhibition of fluorescein (FL) oxidation by antioxidants that scavenge peroxyl radicals, generated from the thermal degradation of 2,2’-azobis (2-methyl-propionamide) dihydrochloride (AAPH). A stock solution of FL (1.2 mM) was prepared 39.87 mg of FL were dissolved in 100 mL of phosphate buffer (PBS) (75 mM, pH 7.4), and stored (darkness, 4˚C). From the FL stock solution a diluted solution (10 µM) was prepared; and a diluted solution (0.1 µM) was prepared daily by the dilution of 0.25 mL of the second solution in 25 mL of PBS. The AAPH radical (200 mM) was prepared daily by taking 207 mg of AAPH and making it up to 5 mL with PBS. The reference standard used was a 1 mM trolox solution that was prepared in PBS from a 5 mM stock standard solution kept in the freezer at –20˚C. Aliquots of 25 µL of free and bound phytochemical extracts of ground samples diluted in PBS were transferred into 96-plate wells, loaded into the plate holder of a Microplate Reader (SynergyTM HT Multi-Detection, BioTek Inc, Winooski, VT, USA), where 150 µL of FL (0.1 µM) were dispensed, mixed and incubated at 37˚C during 30 min before adding 25 µL of AAPH. The reaction was performed at 37˚C and the fluorescence (485 nm for excitation and 538 nm for emission) was measured at 2 min intervals during 60 min. Calculation of protective effects of samples and control is from the net integrated areas under the fluorescence decay curves . Results were expressed as micromoles of Trolox equivalent (µmol TE)/g sample, dw.
2.11. Total Flavonoid Content
The flavonoid content of free and bound phytochemical extracts from ground samples was determined [17,26], the results were expressed as micrograms catechin equivalents (µg CAE)/g sample, dw, using the calibration curve of (+)-catechin. Linearity range of the calibration curve was 10 - 1.000 mg/mL (r = 0.99). The extraction was conducted in triplicate and extracts were diluted to the linear range for determination.
2.12. Condensed Tannins
Condensed tannins (proanthocyanidins) were analyzed using acidified vanillin reagent [27,28]. The results were expressed as micrograms catechin equivalents (µg CAE)/g sample, dw, using the calibration curve of (+)-catechin. Linearity range of the calibration curve was 50 - 1.000 mg/mL (r = 0.99). For each sample, triplicate extractions were performed and used for analyses.
2.13. Statistical Analysis
The results were analyzed using one-way analysis of variance followed by Duncan’s multiple range test comparisons among means with significance level of 5%. Pearson correlation coefficient was used to determine correlations among means with a significance level of 10%.
3. Results and Discussion
3.1. Proximate Composition
Proximate composition based on the dry weight (dw) of the samples varied significantly among desi chickpea cultivars (Table 1). The protein content varied between 20.12% (Red ICC14782) and 28.85% (Cream ICC3421). Differences in protein content may be attributed to the difference in their genetic make up. The variations in lipids and ashes contents of these cultivars were 3.58% - 9.27% and 3.02 - 3.41, respectively; Cream ICC3421 had the highest lipid content. Kaur, et al. [29] reported protein, lipid, and ash contents (dw) of 18.7% - 24.0%, 3.1% - 4.1%, and 2.7% - 2.9%, respectively, for five different desi chickpea cultivars. The protein and lipid contents reported by these authors are slightly than those found in our study, which can be attributed to the genetic variation of the cultivars and perhaps to the differences in the growing conditions used.
3.2. Acceptability Properties (Physical Characteristics, Water Absorption Capacity, Cooking Time)
Significant differences for the acceptability properties [physical characteristics, water absorption capacity (WAC) and cooking time (CT)] of desi chickpea seeds were observed (Table 2). The 100-seed weight of the chickpea cultivars varied from 17.6 to 28.6 g/100 seeds; the highest and lowest 100-seed weights were observed for Green ICC5613 and Cream ICC3421, respectively. The hectoliter weight ranged between 79.0 and 83.0 kg/hL; the lowest value corresponded to Brown ICC3512. The seed coat percentage of the cultivars varied from 6.4 (Cream ICC3421) to 15.6% (Red ICC14782). The WAC and CT also varied significantly among the desi chickpea cultivars (Table 2). WAC ranged between 97.73 (Red ICC14782) and 117.50 g of water/100g sample (ww) (Cream ICC3421). The cooking time (CT) varied from 109.5 min to 193.5 min, lowest for Cream ICC3421 and highest for Red ICC14782.
The WAC of legume seeds depends on cell wall structure, the composition and cell compactness of the seed (seed coat and cotyledons) [30]. Cream ICC3421 was different from all other desi chickpea cultivars with respect to its highest WAC and lowest CT; the higher WAC may
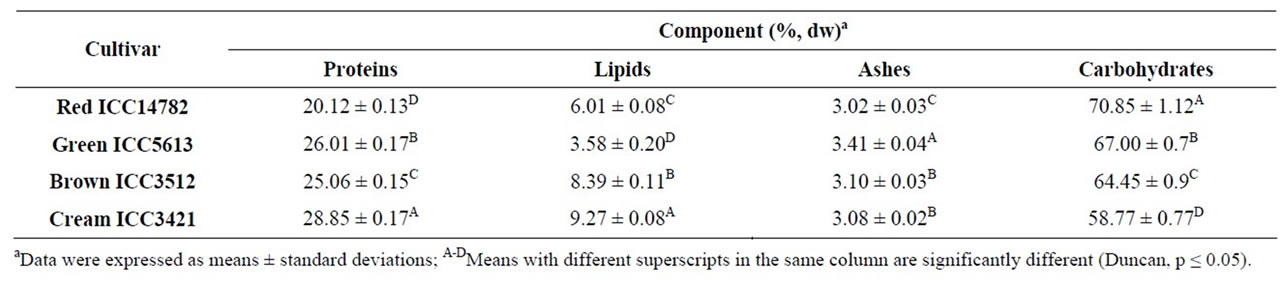
Table 1. Proximate composition of desi chickpea cultivars.
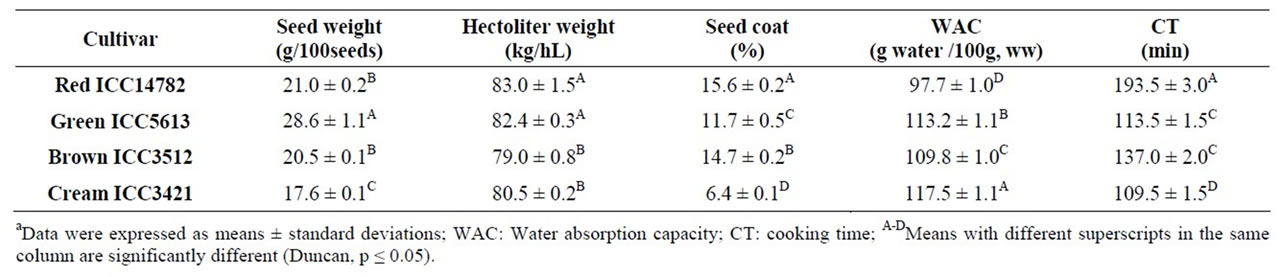
Table 2. Acceptabilitya properties of desi chickpea cultivars.
be attributed to the lowest seed coat percentage (6.4%) with respect to the all other desi cultivars (11.7% - 15.6%).
CT is an important parameter in the acceptability of chickpea, since long CT is rejected by the consumer and may cause loss of nutrients. The size and shape of seeds, surface area, seed thickness, rate of starch gelatinization, and the nature of nonstarch constituents that act as a physical barrier to the swelling of starch granules may influence the cooking quality of dry beans [31]. The difference in CTs among legumes could be related to the rate at which cell separation occurs due to loosening of intercelullar matrix of the middle lamella upon cooking; the varietal differences in cooking quality have been reported to exist even in the same legume [30]. The longer CT requirement for Red ICC14782 could be attributed at least partly to its larger seed coat percentage (15.6%) and lower WAC [97.73 g water/100g sample (ww)], with respect all other desi cultivars.
3.3. Total Phenolic Content and Antioxidant Activity
The total phenolic content (TPC) and total hydrophilic antioxidant activity (AoxA) of desi chickpea cultivars are shown in Table 3. A wide variation was observed for TPC (calculated as the sum of free and bound phenolic) and the cultivars differed significantly with respect to this parameter. The highest TPC was obtained in the case of Brown ICC3512 [1.286 µg GAE/g sample (dw)] followed by Green ICC5613 [1.054 µg GAE/g sample (dw)], whereas the lowest TPC was obtained for Red ICC14782 [746 µg GAE/g sample (dw)]. These values were in partial agreement with those reported by Zia-Ul-Haq, et al. [18]; they observed TPC in the range of 920 - 1.120 µg GAE/g sample (dw) for four desi chickpea varieties indigenous to Pakistan. Other researchers reported that the TPC in whole seeds of desi chickpea cultivars varied from 1.500 to 6.800 µg GAE/g sample (dw) [32]. The observed differences in TPC could be attributed to the genetic background, grain physical properties and particularly to the seed coat color since the seed coat is the structure richer in phenolic compounds [32]. Our results show that the most phenolic (73.40% - 83.59%) in desi chickpea seeds occurred in the bound or attached to cell wall form (Table 3).
Bioactive phytochemicals exist in free, soluble-conjugated, and bound forms; bound phytochemicals, mostly in cell wall materials, are difficult to digest in the upper gastrointestine and may be digested by bacteria in the colon to provide health benefits and reduce the risk of colon cancer [22,33].
Table 3 shows the total hydrophilic antioxidant activity (AoxA) (sum of antioxidant capacities of free and bound phenolic) or ORAC values of the studied chickpeas. Significant differences (p < 0.05) in hydrophilic AoxA were observed among desi chickpea seeds with ORAC values ranking from 43.9 (Red ICC14782 and Cream ICC3421) to 53.9 µmol TE/g sample, dw (Brown ICC3512). ORAC values ranging from 8.58 to11.40 µmol TE/g sample, dw, have been reported by other researchers for desi chickpea varieties from Pakistan [18] which were approximately five times lower than those found in this study. These differences may be attributed partly to the chickpea and the quantification methods used. In general, our results show that the free phytochemicals were the primary contributors (59.0% - 65.4%) to the total hydrophilic AoxA (Table 3). The ORAC method is usually employed to estimate the AoxA of foods and to evaluate in vivo responses to dietary antioxidant manipulations; it is the only method so far that combines both inhibition time and degree of inhibition into a single quantity [34]. The US Department of Agriculture, and the food and nutraceutical industries have accepted the method to the point that some manufactures now include ORAC values on the product labels [35-37].
It was found that TPC in studied desi chickpea cultivars were highly correlated with their total hydrophilic AoxA (Pearson’s correlation coefficient r = 0.910; p = 0.09). The positive linear correlation obtained is considered extremely significant due to the high coefficient of determination (r2 = 0.828). A similar effect has been found by other researchers [7,32,34,38-41]. Phenolic compounds are considered as the major compounds that contribute to the total antioxidant activities of the grains [40,41]. These compounds have been associated with a reduction in the risk of cancer, heart disease and diabetes, as well as to have antibacterial, antiviral, anti-inflammatory and antiallergenic activities; most of these benefits result from their AoxA [42].
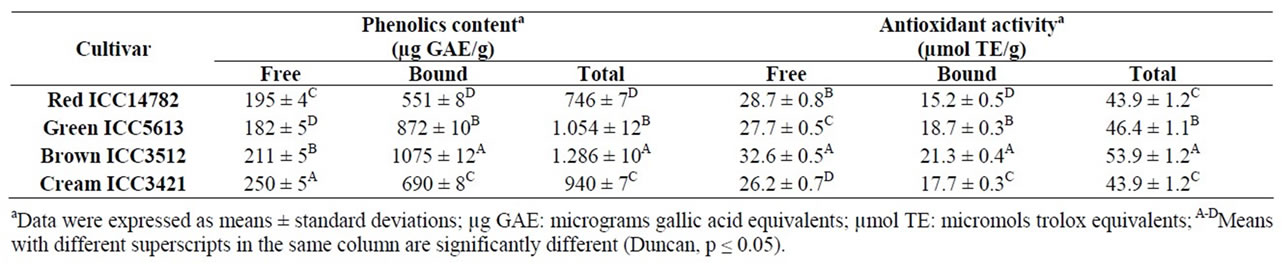
Table 3. Total phenolics and total hydrophilic antioxidant activity of desi chickpea cultivars.
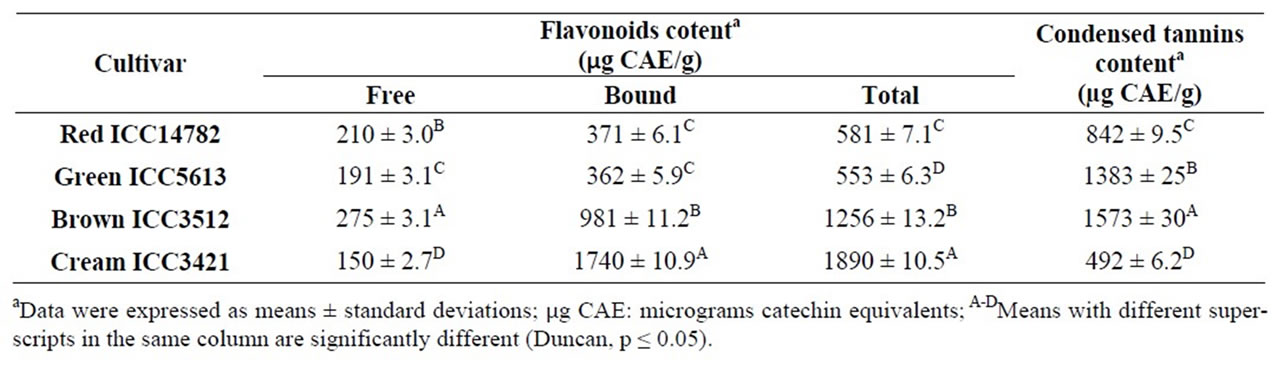
Table 4.Total flavonoids and condensed tannins content of desi chickpea cultivars.
3.4. Total Flavonoid Content (TFC) and Condensed Tannins Content (CTC)
In order to examine the potential role of flavonoids on the antioxidant activity of selected desi chickpea cultivars, the total flavonoid content (TFC, calculated as the sum of free and bound flavonoids) were analyzed and the results showed in Table 4. Significant differences (p < 0.05) were found among the cultivars studied. The highest TFC was obtained in the case of Cream ICC3421 (1.890 µg CAE/g sample, dw), whereas the lowest was observed for Green ICC5613 (553 µg CAE/g sample, dw). Our results show that the most flavonoids (63.9% - 92.1%) in desi chickpea seeds occurred in the bound or attached to cell wall form. Other researchers reported TFC in the range of 790-990 µg CAE/g sample (dw) for four desi chickpea varieties indigenous to Pakistan, which are close to those found in this study [18].
Flavonoids are common constituents of legume, and can provide health-promoting functions. Epidemiological research suggested that flavonoid intake is positively associated with a reduction in the risks of coronary heart disease and certain types of cancer [43] induced by free radicals. The antioxidative properties of flavonoids are considered to be due to radical scavenging by donating hydrogen. Metal-chelating is another feature of certain flavonoids, and those with the catechol structure in the B-ring or probably with both 5-hydroxyl and 4-oxo groups can suppress the iron—or copper—catalyzed Fenton reaction [44,45]. The importance of the antioxidant constituents of legumes in the maintenance of health and nutritive value of food is also increasingly of interest among food manufacturers and consumers as the future trend toward developing functional food [46].
Results in Table 4 show differences (p < 0.05) among studied cultivars with condensed tannins respect content (CTC). Brown ICC3512 had the highest CTC [1.573 µg CAE/g sample (dw)], whereas Cream ICC3421 had the lowest [492 µg CAE/g sample (dw)]. Other researchers [18] have reported CTC in the range of 580 - 690 µg CAE/g sample (dw). Differences between our results and previous reports may be attributed partly to the differences in chickpea sources condensed tannins are located mainly in the seed coat and play an important role in the defense system of seeds that are exposed to oxidative damage by many environmental factors [47].
A positive moderate linear correlation, but not significant (p > 0.1), was found between CTC and total hydrophilic AoxA in desi chickpea cultivars (Pearson’s correlation coefficient r = 0.822; p = 0.178; coefficient of determination r2 = 0.675). Other researchers found a significant correlation between condensed tannins and antioxidant activity in 28 samples (25 Brazilians, 3 Peruvians) of common beans cultivars [48]. Condensed tannins, also known as pronthocyanidins, are capable of scavenging DPPH free radicals in vivo [49]. Proanthocyanidins have been indicated to play a role in cardiovascular diseases via vessel relaxation and LDL oxidation inhibition [50].
4. Conclusion
A wide variation for proteins and lipids content, acceptability properties (water absorption capacity, cooking time), total phenolic content, and antioxidant activity of desi chickpea cultivars was observed. Total phenolic and condensed tannin content were highly and moderate correlated with total hydrophilic antioxidant activity, respectively. The desi chickpea cultivars studied had high levels of total phenolic content and antioxidant activity. Desi chickpea could contribute significantly to the management and/or prevention of degenerative diseases associated with free radical damage. The data obtained will be useful for plant breeders, consumers and to development of nutraceutical food products.
5. Acknowledgements
This research was supported by FOMIX-CONACyT (Fondos Mixtos del Gobierno del Estado de Sinaloa y Consejo Nacional de Ciencia y Tecnología) and PROFAPIUAS (Programa de Fortalecimiento y Apoyo a Proyectos de Investigación, Universidad Autónoma de Sinaloa, México) 2010, 2011.
REFERENCES
- L. Bazzano, J. He, L. G. Ogden, C. Loria, S. Vupputuri, L. Myers and P. K. Whelton, “Legume Consumption and Risk of Coronary Heart Disease in US Men and Women,” Archives of Internal Medicine, Vol. 161, No. 21, 2001, pp. 2573-2578. doi:10.1001/archinte.161.21.2573
- R. Villegas, Y. T. Gao, G. Yang, H. L. Li, T. A. Heláis, W. Zheng and X. Shu, “Legume and Soy Food Intake and the Incidence of Type 2 Diabetes in the Shanghai Women’s Health Study,” American Journal of Clinical Nutrition, Vol. 87, No. 1, 2008, pp. 162-167.
- S. W. Rizkalla, F. Bellisleand and G. Slama, “Health Benefits of Low Glycaemic Index Foods, such as Pulses, in Diabetic Patients and Healthy Individuals,” British Journal of Nutrition, Vol. 88, 2002, pp. S255-S262. doi:10.1079/BJN2002715
- J. W. Anderson and A. W. Major, “Pulses and Lipidemia, Shortand Long-Term Effect: Potential in the Prevention of Cardiovascular Disease,” British Journal of Nutrition, Vol. 88, Suppl. 3, 2002, pp. S263-S271. doi:10.1079/BJN2002716
- L. A. Bazzano, M. T. Tees and C. H. Nguyen, “Effect of Non-Soy Legume Consumption on Cholesterol Levels: A Meta-Analysis of Randomized Controlled Trial,” Circulation, Vol. 118, 2008, p. 1122.
- FAOSTAT, “Statistical database,” 2011. http://faostat.fao.org/site/567/DesktopDefault.aspx?PageID=567#ancor
- H. Han and B. K. Baik, “Antioxidant Activity and Phenolic Content of Lentils (Lens culinaris), Chickpeas (Cicer arietinum L.), Peas (Pisum sativum L.) and Soybeans (Glycine max), and Their Quantitative Changes during Processing,” International Journal of Food Science and Technology, Vol. 43, No. 11, 2008, pp. 1971-1978. doi:10.1111/j.1365-2621.2008.01800.x
- R. Campos-Vega, G. Loarca-Piña and B. D Oomah, “Minor Components of Pulses and Their Potential Impact on Human Health,” Food Research International, Vol. 43, No. 2, 2010, pp. 461-482. doi:10.1016/j.foodres.2009.09.004
- Y. Aguilera, M. Dueñas, I. Estrella, T. Hernández, V. Benítez, R. M. Esteban and M. A. Martín-Cabrejas, “Phenolic Profile and Antioxidant Capacity of Chickpeas (Cicer arietinum L.) as Affected by a Dehydration Process,” Plant Foods for Human Nutrition, Vol. 66, No. 2, 2011, pp. 187-195. doi:10.1007/s11130-011-0230-8
- M. L. Ricketts, D. D. Moore, W. J. Banz, O. Mezeiand and N. F. Shay, “Molecular Mechanisms of Action of the Soy Isoflavones Includes Activation of Promiscuous Nuclear Receptors. A Review,” Journal of Nutritional Biochemistry, Vol. 16, No. 6, 2005, pp. 321-330. doi:10.1016/j.jnutbio.2004.11.008
- M. Messina, W. McCaskill-Stevens and J. W. Lampe, “Addressing the Soy and Breast Cancer Relationship: Review, Commentary, and Workshop Proceedings,” Journal of the National Cancer Institute, Vol. 98, No. 18, 2006, pp. 1275-1284. doi:10.1093/jnci/djj356
- B. J. Trock, L. Hilakivi-Clarke and R. Clarke, “Metaanalysis of Soy Intake and Breast Cancer Risk,” Journal of the National Cancer Institute, Vol. 98, No. 7, 2006, pp. 459-471. doi:10.1093/jnci/djj102
- B. Nizakat, B. K. Amal, S. S. K. Gul, M. Zahidand and I. Ihsanullak, “Quality and Consumers Acceptability Studies and Their Inter-Relationship of Newly Evolved Desi Type Chickpea Genotypes (Cicer arietinum L.). Quality Evolution of New Chickpea Genotypes,” International Journal of Food Science and Technology, Vol. 42, No. 5, 2007, pp. 528-534. doi:10.1111/j.1365-2621.2006.01246.x
- A. Segev, H. Badani, L. Galili, R. Hovav, Y. Kapulnik, I. Shomerand and S. Galili, “Effects of Baking, Roasting and Frying on Total Polyphenols and Antioxidant Activity in Colored Chickpea Seeds,” Food and Nutrition Sciences, Vol. 3, No. 3, 2012, pp. 369-376. doi:10.4236/fns.2012.33053
- C. Reyes-Moreno, J. Okamura-Esparza, R. M. GómezGarza, E. Armienta-Rodelo and J. Milán-Carrillo, “Hardto-Cook Phenomenon in Chickpeas (Cicer arietinum): Effect of Accelerated Storage on Grain Quality,” Plant Foods for Human Nutrition, Vol. 55, No. 3, 2000, pp. 229-234. doi:10.1023/A:1008106229189
- C. Reyes-Moreno, O. Rouzand-Sanchez, J. Milán-Carrillo, J. A. Garzón-Tiznado and L. Camacho-Hernández, “Hardto-Cook Tendency of Chickpea (Cicer arietinum L.) Varieties,” Journal of the Science of Food and Agriculture, Vol. 81, No. 10, 2001, pp. 1008-1012. doi:10.1002/jsfa.872
- M. Zia-Ul-Haq, S. Iqbal, S. Ahmad, M. Imran, A. Niaz and M. I. Bhanger, “Nutritional and Compositional Study of Desi Chickpea (Cicer arietinum L.) Cultivars Grown in Punjab, Pakistan,” Journal of Food Chemistry, Vol. 105, 2007, pp. 1357-1363. doi:10.1016/j.foodchem.2007.05.004
- M. Zia-Ul-Haq, S. Iqbal, S. Ahmad, M. I. Bhanger, W. Wiczkowskiand and R. Amarowicz, “Antioxidant Potential of Desi Chickpea Varieties Commonly Consumed in Pakistan,” Journal of Food Lipids, Vol. 15, No. 3, 2008, pp. 326-342. doi:10.1111/j.1745-4522.2008.00122.x
- AOAC, “Official Methods of Analysis,” 16th Edition, Association of Official Analytical Chemists, Washington DC, 1999.
- O. Paredes-López, A. Cárabez-Trejo, L. Palma-Tirado and C. Reyes-Moreno, “Influence of Hardening Procedure and Soaking Solution on Cooking Quality of Common Beans,” Plant Foods for Human Nutrition, Vol. 41, No. 2, 1991, pp. 155-164. doi:10.1007/BF02194084
- V. Dewato, X. Wu and R. H. Liu, “Processed Sweet Corn Has Higher Antioxidant Activity,” Journal of Agricultural and Food Chemistry, Vol. 50, No. 17, 2002, pp. 4959-4964.
- K. K. Adom and R. H. Liu, “Antioxidant Activity of Grains,” Journal of Agricultural and Food Chemistry, Vol. 50, No. 21, 2002, pp. 6182-6187. doi:10.1021/jf0205099
- S. Mora-Rochín, J. A. Gutiérrez-Uribe, S. O. SernaSaldívar, P. Sánchez-Peña, C. Reyes-Moreno and J. Milán-Carrillo, “Phenolic Content and Antioxidant Activity of Tortillas Produced from Pigmented Maize Processed by Conventional Nixtamalization or Extrusion Cooking,” Journal of Cereal Science, Vol. 52, No. 3, 2010, pp. 502-508. doi:10.1016/j.jcs.2010.08.010
- V. L. Singleton, R. Orthoferand and R. M. Lamue-laRaventos, “Analysis of Total Phenols and Other Oxidation Substrates and Antioxidants by Means of FolinCiocalteu Reagent,” Methods in Enzymology, Vol. 299, 1999, pp.152-178. doi:10.1016/S0076-6879(99)99017-1
- B. Ou, M. Hampseh-Woodill and R. L. Prior, “Development and Validation of an Improved Oxygen Radical Absorbance Capacity Assay Using Fluorescein as the Fluorescent Probe,” Journal of Agricultural and Food Chemistry, Vol. 49, No. 10, 2001, pp. 4619-4626. doi:10.1021/jf010586o
- D. Heimler, P. Vignolini, M. G. Diniand and A. Romani, “Rapid Tests to Assess the Antioxidant Activity of Phaseolus vulgaris L. Dry Beans,” Journal of Agricultural and Food Chemistry, Vol. 53, No. 3, 2005, pp. 3053-3056. doi:10.1021/jf049001r
- B. J. Xu and S. K. C. Chang, “A Comparative Study on Phenolic Profiles and Antioxidant Activities of Legumes as Affected by Extraction Solvents,” Journal of Food Science, Vol. 72, No. 2, 2007, pp. S159-S166. doi:10.1111/j.1750-3841.2006.00260.x
- R. B. Broadhurst and W. T. Jones, “Analysis of Condensed Tannins Using Acidified Vanillin,” Journal of the Science of Food and Agriculture, Vol. 29, No. 9, 1978, pp. 788-794. doi:10.1002/jsfa.2740290908
- M. Kaur, N. Singh and S. N. Singh, “Physicochemical, Cooking, Textural and Roasting Characteristics of Chickpea (Cicer arietinum L.) Cultivars,” Journal of Food Engineering, Vol. 69, No. 4, 2005, pp. 511-517. doi:10.1016/j.jfoodeng.2004.09.002
- C. Reyes-Moreno and O. Paredes-López, “Hard-to-Cook Phenomenon in Common Beans-A Review,” Critical Reviews in Food Science and Nutrition, Vol. 33, No. 3, 1993, pp. 227-286.
- S. S. Desphande and M. Cheryan, “Water Uptake during Cooking of Dry Beans (Phaseolus vulgaris L.),” Plant Foods for Human Nutrition, Vol. 36, No. 3, 1999, pp. 157-161.
- A. Segev, H. Badani, Y. Kapulnik, I. Shomer, M. OrenShamir and S. Galili, “Determination of Polyphenols, Flavonoids, and Antioxidant Capacity in Colored Chickpea (Cicer arietinum L.),” Journal of Food Science, Vol. 75, No. 2, 2010, S115-S119. doi:10.1111/j.1750-3841.2009.01477.x
- R. H. Liu, “Whole Grain Phytochemicals and Health”, Journal of Cereal Science, Vol. 46, No. 3, 2007, pp. 207- 219. doi:10.1016/j.jcs.2007.06.010
- G. H. Cao and R. L. Prior, “Measurement of Oxygen Radical Absorbance Capacity in Biological Samples,” Methods in Enzymology, Vol. 299, 1999, pp. 50-62. doi:10.1016/S0076-6879(99)99008-0
- G. Bank and A. Schauss, “Antioxidant Testing: An ORAC Update,” Nutraceuticals World, 2004. http://www.nutraceuticalsworld.com/march042.htm
- USDA, “Oxygen Radical Absorbance Capacity (ORAC) of Selected Foods,” United States Department of Agriculture, 2007, pp. 1-34.
- USDA, “Oxygen Radical Absorbance Capacity (ORAC) of Selected Foods, Release 2. Nutrient Data Laboratory,” United States Department of Agriculture, 2010. http://www.ars.usda.gov/Services/docs.htm?docid=15866&pf=1&cg_id=0
- B. J. Xu, S. H. Yuan and S. K. C. Chang, “Comparative Analyses of Phenolic Composition, Antioxidant Capacity and Color of Cool Season Legumes and Other Selected Food Legumes,” Journal of Food Science, Vol. 72, No. 2, 2007, pp. S167-S177. doi:10.1111/j.1750-3841.2006.00261.x
- B. J. Xu, S. H. Yuan and S. K. C. Chang, “Comparative Studies on the Antioxidant Activities of Nine Common Food Legumes Against Copper—Induced Human Low— Density Lipoprotein Oxidation in Vitro,” Journal of Food Science, Vol. 72, No. 7, 2007, pp. S522-S527. doi:10.1111/j.1750-3841.2007.00464.x
- Y. Yao, W. Sang, M. Zhou and G. Ren, “Antioxidant and α-Glucosidase Inhibition of Colored Grains in China,” Journal of Agricultural and Food Chemistry, Vol. 58, No. 2, 2010, pp. 770-774. doi:10.1021/jf903234c
- Y. Yao, X. Cheng, L. Wang, S. Wang and G. Ren, “Biological Potential of Sixteen Legumes in China,” International Journal of Molecular Science, Vol. 12, No. 10, 2011, pp. 7048-7058. doi:10.3390/ijms12107048
- R. Randhir and K. Shetty, “Mung Beans Processed by Solid-State Bioconversion Improves Phenolic Content and Functionality Relevant for Diabetes and Ulcera Management,” Innovation Food Science Engineering and Technology, Vol. 8, No. 2, 2007, pp. 97-204.
- P. M. Kris-Etherton, K. D. Hecker, A. Bonanome, S. M. Coval, A. E. Binkoski, K. F. Hilpert, A. E. Grieland and T. D. Etherton, “Bioactive Compounds in Foods: Their Role in the Prevention of Cardiovascular Disease and Cancer,” American Journal of Medicine, Vol. 113, Suppl. 9B, 2002, pp. 71S-88S. doi:10.1016/S0002-9343(01)00995-0
- C. A. Rice-Evans, N. J. Miller and G. Paganga, “Structure-Antioxidant Activity Relationships of Flavonoids and Phenolic Acids,” Free Radical Biology and Medicine, Vol. 20, No. 7, 1996, pp. 933-956. doi:10.1016/0891-5849(95)02227-9
- L. Mira, T. M. Fernández, M. Santos, R. Rocha, H. M. Florencio and K. R. Jennings, “Interactions of Flavonoids with Iron and Copper Ions: A Mechanism for Their Antioxidant Activity,” Free Radical Research, Vol. 36, No. 11, 2002, pp. 1199-1208. doi:10.1080/1071576021000016463
- S. C. Ren, Z. L. Liu and P. Wang, “Proximate Composition and Flavonoids Content and in Vitro Antioxidant Activity of 10 Varieties of Legume Seed Grown in China,” Journal of Medicinal Plants Research, Vol. 6, No. 2, 2012, pp. 301-308.
- A. Troszynka, I. Estrella, M. L. López-Amores and T. Hernández, “Antioxidant Activity of Pea (Pisum sativum L.) Seed Coat Extract,” LWT—Food Science and Technology, Vol. 35, No. 2, 2002, pp. 158-164. doi:10.1006/fstl.2001.0831
- L. G. Ranilla, M. I. Genovese and F. M. Lajolo, “Polyphenols and Antioxidant Capacity of Seed Coat and Cotyledon from Brazilian and Peruvian Bean Cultivars (Phaseolus vulgaris L.),” Journal of Agricultural and Food Chemistry, Vol. 55, No. 1, 2007, pp. 90-98. doi:10.1021/jf062785j
- R. Amorowicz, M. Naczk and F. Shahidi, “Antioxidant Activity of Condensed Tannins of Beach Pea, Canola Hulls, Evening Primrose and Faba Beans,” Journal of Food Lipids, Vol. 7, No. 3, 2000, pp. 195-205. doi:10.1111/j.1745-4522.2000.tb00171.x
- R. De la Iglesia, F. I. Milagro, J. Campión, N. Boqué and J. A. Martínez, “Healthy Properties of Proanthocyanidins,” Biofactors, Vol. 36, No. 3, 2010, pp. 159-168. doi:10.1002/biof.79
NOTES
*Corresponding author.