American Journal of Plant Sciences
Vol.07 No.08(2016), Article ID:67612,12 pages
10.4236/ajps.2016.78125
Soil Characteristics Influence the Selection of Dominant Plant Genotypes Inhabiting Wadi Sudr, Egypt
Esraa Attia El Sherbeny1, Amal Ahmed Morsy2, Mahmoud Magdy3*
1Genetics Resources Department, Desert Research Center, Ministry of Agriculture, Cairo, Egypt
2Botany Department, Faculty of Science, Ain Shams University, Cairo, Egypt
3Genetics Department, Faculty of Agriculture, Ain Shams University, Cairo, Egypt

Copyright © 2016 by authors and Scientific Research Publishing Inc.
This work is licensed under the Creative Commons Attribution International License (CC BY).
http://creativecommons.org/licenses/by/4.0/


Received 20 May 2016; accepted 19 June 2016; published 22 June 2016
ABSTRACT
Rangeland plant community and species composition are known to be related to specific soil properties. The current study investigated the ecological influence (soil characteristics) on the selection and distribution of ecological-related genotypes of dominant xerophyte species in WadiSudr of Egypt. AFLP analysis reflected the genetic profile of the samples species from two altitudinal ranges (up and midstream) and was compared statistically with the differences of their inhabiting soil characteristics on two depth levels (20 and 40 cm) using Mantel test. Correlation values (r) ranged from 0.585 - 0.778 when treating the physical and chemical properties of soil samples regardless its altitudinal area. The correlation confirms that the soil chemical and physical properties influence the selection of a certain genotypes of the dominant xerophytes plants collected from Wadi Sudr of Egypt to certain altitude, while depths at 20 and 40 cm play a key role in the early growth and then the colonization of the selected genotypes, respectively. More studies are needed to exactly test the role and the importance of each of the correlated property to the plant growth and colonization.
Keywords:
Xerophytes, Wadi Sudr-Egypt, Soil Characteristics, F-AFLP, Mantel Test

1. Introduction
In arid environments, soils are formed over time as climate and vegetation act on parent rock material. Relatively large rock fragments form due to physical disintegration; while only chemical weathering which can break up these fragments [1] . Vegetation plays an essential role in the process of soil formation through breaking rock particles and enriching soil with organic substance from aerial and subterranean layers [2] . The water-holding capacity of a soil depends on its physical characteristics including, structure, texture and soil depth [3] . The depth of soils in arid regions is often limited by a “hardpan” layer of a consolidated calcite in the Mediterranean region that can be more or less continuous and from 5 to 60 centimeters depth [1] . Arid soils are characterized by significant leaching of nutrients and intensive weathering of minerals; both activities are normally slowed with decreasing rainfall. Thus, arid zone soils are vulnerable to both wind and water erosion, therefore, soil fixation and conservation are important [1] .
Wadi Sudr is one of the largest and most developed valleys of the southern section of the western coast of Sinai. The vegetation of W. Sudr is relatively rich in the variety of communities and species and also in having wide tracts covered by well-developed plant communities [4] . This is attributed to its extensive water resources, the broadness of the channel, the friable nature of the sediments, variation in the thickness the surface deposits and presence of local stony pasts [5] . Three main sectors in W. Sudr were defined; upstream dominated by Tamarix nilotica, Retama raetam and Haloxylon salicornicum, midstream dominated by Retama raetam and downstream dominated by Tamarix aphylla [4] .
The most critical gradients in abiotic factors may be related to water presence, including annual precipitation and soil properties [6] . Correlation of soils and vegetation is important for investigations targeting plant habitats [7] - [11] . In order to test the adaptive signals in a species, association of genetic variation with environmental variables has been frequently reported in the recent literature [12] - [14] . Amplified fragment length polymorphism was successfully applied in several studies to perform genome scan for loci under selection and to associate genetic variability to biotic and abiotic factors [15] - [19] . AFLP-based genome scans have been used successfully to detect outlier loci linked to adaptation to soil type [20] [21] .
The objective of the current work was to study the physical and chemical properties of W. Sudr’s soil at two different altitudinal ranges (upstream and midstream), and to test the soil characteristics influence on the distribution of the xerophytic plant species dominate each range.
2. Material and Methods
2.1. Study Area
Wadi Sudr is located in the southern section of the western coast of Sinai, and lies between latitudes 29˚36'32''N - 29˚57'43''N, and longitudes 32˚41'28"E - 32˚17'27"E. It is bounded by Gebel El-Raha (c. 600 m) in the north and Sinn Bishr (c. 618 m) in the south (Figure 1). Wadi Sudr originates in the hill slope of El-Tih plateau. The main trunk of W. Sudr extends roughly in a NE-SW direction for about 55 km and flows into the Suez Gulf at RasSudr (c. 55 km south of El-Shatt) [4] . Sinai Peninsula desert belongs to the Arabian desert characterized by: 1) Arid to extremely arid climate with Mediterranean influence, 2) Precipitation mostly in winter ranges 250 mm at the northern boundary (Negev Desert) to 10 - 20 mm in the south of Sinai, and 3) Mean temperature of 10˚C - 20˚C in the coldest months and 20˚C - 30˚C in the warmest months [22] [23] . Moisture in the form of rainfall is the most decisive factor controlling productivity, plant distribution and life forms in arid region area [24] . The amount of annual rainfall of W. Sudr was (18.7 mm), while the highest temperature was recorded in July 35.5˚C and the lowest temperature recorded in March 8.3˚C [25] [26] .
2.2. Soil Sampling and Analysis
Soil samples were collected at the surface (0 - 20 cm) and subsurface (20 - 40 cm) depths from sites were plant materials were collected in W. Sudr. Physical and chemical parameters of soil samples were analyzed. Soil particle size (%) was determined by the dry sieving to separate soil fractions according to Wentworth scale (American System) [27] [28] . Soil reaction (pH) was determined in the soil solution 1:1 by using a portable pH-meter (Model Ion lab pH level 1) calibrated by buffer solution; pH 4, 7 and 10 [29] . Electrical conductivity (EC) of the soil extract (5:1) were determined and expressed as dS/m29. The anions and cations (Cl−,  ,
,  , Ca2+, Mg2+, Na+ and K+) of the soil extracts were analyzed following the method previously described [27] [29] and their values expressed as meq/L soil. Calcium carbonates content was determined volumetrically using Collin’s Calcimeter [30] . All chemical and physical properties of all samples were transformed using z-score method

Figure 1. A map showing the location of Wadi Sudr, Egypt.
analyzed using principle component analysis (PCA). Groups & clusters defined for each layer based on PCA were used to construct Euclidean matrices for each group using PCO3 [31] .
2.3. Plant Sampling
Three selected common xerophytic plant species were collected from both upstream and midstream ranges of W. Sudr, where they represent the dominant or the co-dominant species in both ranges. Those species are Reaumuria hirtella Jaub. & Spach(family Tamaricaceae), Retam araetam (Forssk.) Webb & Berthel (family Leguminosae) and Zygophyllum dumosum Boiss. (family Zygophyllaceae). Species names were abbreviated in the following text as Reau maria: Reaumuria hirtella, Retama: Retamaraetam, Zygo: Zygophyllum dumosum.
3. Molecular Analysis Using Fluorescently Labeled AFLP
3.1. DNA Extraction
The DNA extractions were carried out from plant leaves of 3 species (2 samples each) using Wizard® Genomic DNA Purification Kit (PROMEGA, USA) by following the manufacturer’s manual. DNA quality was then tested using agrose gel electrophoresis (1%) contain 1 µl of EthBr (100 mg/ml), and electrophoresed for 1 h (4 V/cm).
3.2. F-AFLP-PCR
The original protocol was followed [32] , while fluorescent primers were used. Six different selective PCR combinations (3: Eco-AGG/ACA/ATA × 2: Mse-CTC/CTA primers) were amplified using the original PCR program. Private services were contracted to visualize the amplified products using ABI3730 DNA analyzer (Applied Biosystems, USA) with a size standard GS500-LIZ (Macrogen, genescan service, Korea).
3.3. Band Scoring and Analysis
Automated AFLP scoring was performed using both programs Peakscanner™ (Applied Biosystems, USA) and Rawgeno V2 for peak calling and automated scoring, according to the software’s manuals. The analysis of the AFLP data was based on the band-binary criterion (i.e. codifying the detected bands to, 1 when presence and 0 when absent) and processed according to [33] . Bands were refined in order to eliminate any bands scored due to, a) being of the same species regardless the altitude (i.e. bands that were monomorphic within one of the studied species), b) unique to a certain species regardless the other species sharing the same altitude (i.e. polymorphic or monomorphic in one of the four studied species). Remained bands were all polymorphic within each of the studied species. Unrefined and refined data were used to generate genetic distance matrices for uplands and midlands separately and both together.
3.4. Correlation Tests
The effect of the altitude and soil layer on the distribution of the studied plant species was tested using Mantel test (to measure the association between two matrices) implemented in GenAlEx V6 [34] . The genetic distance matrices of AFLP refined and AFLP unrefined data sets were tested against the Euclidean distance of the defined groups of physical and chemical properties of the soil. The significance of the correlation value was tested with 999,999 permutations.
4. Results
4.1. Soil Analysis
Most of the soil surrounding the studied plants in W. Sudr was mainly formed of fine sand and ranged from 10.92% to 55.82% (Table 1). Calcium carbonate CaCO3% in the soil profiles of W. Sudr ranged between

Table 1. The physical and chemical properties of soil associated with the studied plants from upstream and midstream of W. Sudr.
12.50 and 76.19. Data indicated that CaCO3% of soil surrounding Retama raetam in the upstream attained the highest values among the soil surrounding the studied species (76.19 at the depth between 20 - 40 cm) and the lowest value in the midstream (12.50 at the depth between 20 - 40 cm).
Xero-halophyte plants are naturally able to inhabit alkaline soils with high EC profile. The current analysis showed that the soil reaction pH was mostly alkaline (pH 6.63 to 8.66). Electrical conductivity (EC) of the soil profiles in midstream-20 cm recorded the highest value (22.33 dS∙m−1) around Reaumuria hirtella that scored the lowest pH value (6.63) (Table 1). Reaumuria plants were widely used for the restoration of degraded ecosystems that is rainfall-dependent due to their extreme tolerance to alkaline and saline conditions [35] [36] .
In the present investigation, the soil chemical properties and very fine soil texture are the most important factors affecting in distribution and vegetation cover of halophytes in the midstream, while the larger soil particles and CaCO3 were the most effective factors on the distribution of xerophytes in the up and midstream of W. Sudr.
4.2. Statistical Clustering
By applying t-test between layers for each of the estimated parameter in each altitudinal area (upstream & midstream), no significant differences between the 20 cm and 40 cm depth were found (values are not shown). Four clusters (sets) and two singletons were successfully defined based on the PCA results for upland & midland (20 cm) and upland & midland (40 cm). Set-1 included “Very fine gravel percentage, very coarse sand percentage, and coarse sand percentage”, that all were soil physical properties. Set-2 included “Medium sand percentage and pH”. While Set-3 included “Fine sand percentage, very fine sand percentage and silt & clay percentage”. The largest set, number 4 included the chemical properties of the soil samples (EC, Na+, K+, Ca2+, M2+, Cl− and ). The two singletons were CO3 and HCO3 (Figure 2).
The physical and chemical properties of the sampled soil were statistically deviated and grouped in 4 sets and 2 singletons, in which data treatment should address each set and/or singleton separately to avoid any misleading correlation values. While no significant differences between both depths were proved by t-test, the four grouped sets and the two singletons consistently appeared the same between both depths. Based on that fact, the Euclidean matrices based on physical and chemical properties of soil samples were estimated for each set separately considering the altitudinal area (upstream & midstream).
4.3. Genetic Analysis
Three selective fluorescently labeled primers (Mse CTC-Eco AGG, Mse CTC-Eco ACA and Mse CTC-Eco ATA) successfully amplified 367 bands (112, 148 and 107, respectively; binary data not shown). Band scoring was successful at fluorescence rate unit of 100 rfu with an average bin size 0.33. Technical homoplasy confirmed the presence of one peak per bin. Average peak rate ranged from 106 - 148 peak/sample, while its molecular size ranged from 50 - 424 bp. After refining only six loci out of the 367 were retained (Table 2). The successful amplification of 367 AFLP loci revealed the genetic diversity among the sampled species on both altitu- dinal areas. Refining the data minimized the band number to 6 bands, by removing bands that would be ampli-
Table 2. Band binary score of six refined loci resulted from F-AFLP of six samples represent three species sampled from upstream and midstream area in W. Sudr.
 Upstream (20 cm)
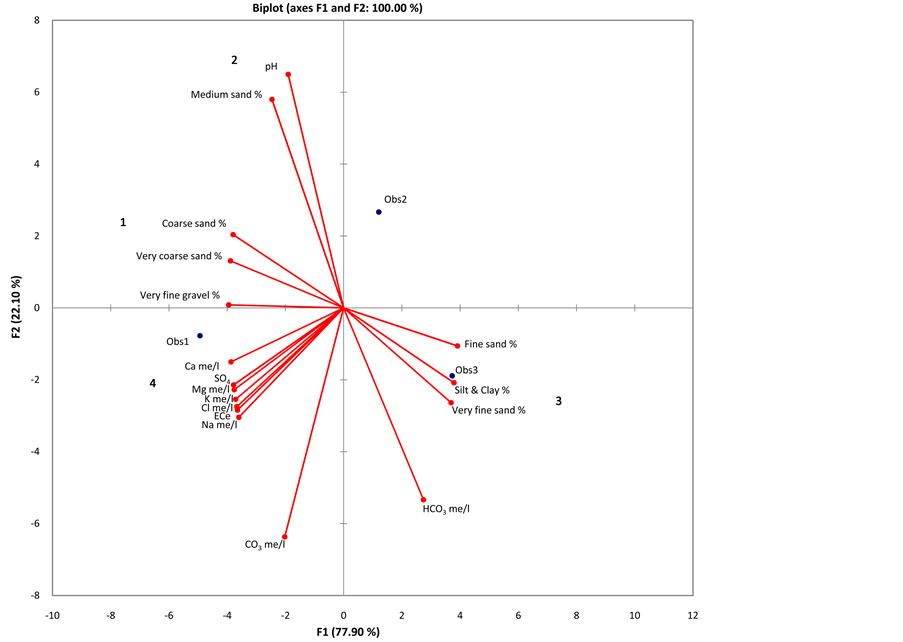 Upstream (40 cm)
 Midstream (20 cm)
 Midstream (40 cm)
Figure 2. Principal component analysis of soil chemical and physical properties for each layer of the two sampled altitudes. Four sets can be determined, while two singletons are deviated in the four figures (CO3 and HCO3).
fied due to the natural genetic relatedness of the genomes within the same species and the genetic differentiation of the genomes among the three studied species. The 6 loci should reflect the variation continuum among the species and within each species. In Funaria hygrometrica 13 out of 1864 AFLP loci were detected to be under selection using computer software among samples from Sierra Nevada Mountains of Spain, the 13 loci proved to be correlated to the maximum temperatures of each sampled location [16] . However, in the current study the refining was performed and revised manually for each locus.
4.4. Correlation Analysis
Refined data is expected to be the candidate loci in which the environmental selection force is applied. To test such hypothesis, correlation tests showed different significant and insignificant correlations between the altitudinal group, physical & chemical properties and the genetic distance based on unrefined and refined data. Euclidean matrices based on the physical and chemical soil properties were estimated for both layers (Table 3). Genetic distance matrix based on Jaccard’s dissimilarity coefficient was constructed for both unrefined and refined AFLP detected loci (Table 4).
Table 3. Euclidean matrices based on physical and chemical properties of soil samples, lower triangle represents the distance estimated for 20 cm depth, while upper triangle represents the distance estimated for 40 cm depth. Values represent only the altitudinal areas are written in bold. U stands for upstream, M stands for midstream.
Table 4. Genetic distance based on both unrefined and refined AFLP data. Lower triangle represents the distance estimated for 367 AFLP loci, while upper triangle represents the distance estimated for 6 AFLP loci.
In Table 5, Correlation analysis was found to be most significant negative correlation between midlands-Set3 at 40 cm and the unrefined AFLP loci dataset (r-value = -0.978, p-value =< 0.0001), while regardless the altitudinal areas, unrefined AFLP loci dataset was significantly positive-correlated with Set1 at 20 cm (r-value = 0.714, p-value = 0.003), and with Set1 (r-value = 0.585, p-value = 0.028), Set3 (r-value = 0.778, p-value = 0.003) and Set4 (r-value = 0.656, p-value = 0.011) at 40 cm. Refined AFLP loci dataset was significantly negative- correlated with Set1 (r-value = −0.82, p-value < 0.0001), and Set3 (r-value = −0.935, p-value < 0.0001) at 20 cm, and with Set1 at 40 cm (r-value = −0.962, p-value < 0.0001).
Without refining (regardless the species type effect), the correlation values were insignificant to all uplands sets, while only negatively correlated to Set3 at 40 cm depth with high significance (p-value < 0.0001). However, correlation values ranged from 0.585 - 0.778 when treating the physical and chemical properties of soil samples regardless its altitudinal area with Set1-20 and 40, Set3-40 and Set4-40. The correlation observed between the genetic variation among the sampled species with the physical properties of the soil Set1 (the percentage of, very fine gravel, very coarse sand, and coarse sand) at both depths (20 and 40 cm), reflects the importance of such soil properties to the inhabiting of the collected species germination, early growth and rooting in both depths.
While the correlation to the physical properties of the soil Set3 (the percentage of, fine sand, very fine sand and silt & clay) and to the chemical properties Set4 (EC, Na me/l, K me/l, Ca me/l, Mg me/l, Cl me/l and SO4) at only 40 cm depth. That would draw our attention to importance of such soil properties to later stages of the plant later growth and colonization in these lands. More studies are needed to exactly test the role and the importance of each of the correlated property to the plant growth and colonization.
The correlation signs (negative or positive) are of no biological relevance, as the genetic variation is not directional and it was generated due to the statistical nature of Mantel test [16] [37] .
Other observation worth mentioning that, after refining the correlation was statistically higher (r-value < 0.80) and stronger (p-value < 0.0001) and the genetic variation is only related to uplands or midlands, but not to both (regardless of the altitudinal area) due to the selection of loci, which subsequently proves the quality of the manual refining.
In arid regions, many taxa occurring exhibit a historically fragmented distribution. Soil type contributes in this fragmentation as proven by the current results, in accordance with previous studies [21] . Rangeland plant community and species composition are known to be related to specific soil properties such as soil climate (moisture and temperature), texture, depth, structure, fertility, pH, salinity and toxic influences. These properties relate to spatial variability of vegetation responses ranging from broad geographic distribution to landscape influences to specific site characteristics [38] .
The AFLP technique treat a certain mutational action (e.g. single nucleotide polymorphism) that impact the absence of a certain band (score 0 in the binary table) vs the presence of the same band (score 1 in the binary table) in the same species but at a different altitudinal area. Thus, the strong statistical correlations between the genetic variation among genotypes and the soil properties reflect the ability of a certain genotype to exist and germinate in a certain soil. In such case, the species is known to have an adaptive genetic variation, and that the environmental factors play an important role in the selection mechanism of such species. The detection of adaptive loci represents only a first step in a comprehensive understanding of how selection shapes genomic divergence between locations. The further step is to identify exactly the genomic regions or genes and ultimately, the
Table 5. Genetic distance based on both unrefined and refined AFLP data. Lower triangle represents the distance estimated for 367 AFLP loci, while upper triangle represents the distance estimated for 6 AFLP loci.
mutations involved in the adaptation. But the lack of sequence information given by anonymous AFLP loci remains a major limitation to undertake this second step. As a solution, recently developed techniques based on Next Generation Sequencing (NGS) like Restriction-Site Associated DNA (RAD) [39] , allow valuable insights toward a clear and precise identification of the locus or region under selection in genome scan methods.
5. Conclusion
As a conclusion, the current results confirm statistically that the soil chemical and physical properties influence the selection of a certain genotypes of the dominant xerophytes plants collected from W. Sudr of Egypt to certain altitude, while depths at 20 and 40 cm play a key role in the early growth and then colonization of selected genotypes, respectively. However, more studies are still needed to complete the background knowledge in order to design an efficient conservation program of such species.
Cite this paper
Esraa Attia El Sherbeny,Amal Ahmed Morsy,Mahmoud Magdy, (2016) Soil Characteristics Influence the Selection of Dominant Plant Genotypes Inhabiting Wadi Sudr, Egypt. American Journal of Plant Sciences,07,1304-1315. doi: 10.4236/ajps.2016.78125
References
- 1. Salem, B.B. (1989) Arid Zone Forestry: A Guide for Field Technicians. Food and Agriculture Organization (FAO), Rome.
- 2. Donahue, R.L., Miller, R.W. and Shickluna, J.C. (1977) Soils: An Introduction to Soils and Plant Growth. Prentice-Hall, Upper Saddle River.
- 3. Brady, N.C. and Weil, R.R. (2009) Elements of the Nature and Properties of Soils. Prentice Hall, Upper Saddle River.
- 4. Girgis, W.A. and Ahmed, A.M. (1985) An Ecological Study of Wadis of Sw Sinai, Egypt. Desert Institute Bulletin, 35, 265-308.
- 5. Sonbol, M., Mtalo, F., El-Bihery, M. and Abdel-Motteleb, M. (2005) Watershed Modelling of Wadi Sudr and Wadi Al-Arbainin Sinai, Egypt. UNESCO Cairo Office, Cairo.
- 6. Parker, K.C. (1991) Topography, Substrate, and Vegetation Patterns in the Northern Sonoran Desert. Journal of Biogeography, 18, 151-163.
http://dx.doi.org/10.2307/2845289 - 7. El-Ghani, M.M.A. (2000) Vegetation Composition of Egyptian Inland Saltmarshes. Botanical Bulletin of Academia Sinica, 41, 305-314.
- 8. El-Ghani, M.M.A. and Amer, W.M. (2003) Soil-Vegetation Relationships in A Coastal Desert Plain of Southern Sinai, Egypt. Journal of Arid Environments, 55, 607-628.
http://dx.doi.org/10.1016/s0140-1963(02)00318-x - 9. Hillel, D. and Tadmor, N. (1962) Water Regime and Vegetation in the Central Negev Highlands of Israel. Ecology, 43, 33-41.
http://dx.doi.org/10.2307/1932037 - 10. Kassas, M. and Girgis, W. (1965) Habitat and Plant Communities in The Egyptian Desert: Vi. The Units of a Desert Ecosystem. Journal of Ecology, 53, 715-728.
http://dx.doi.org/10.2307/2257630 - 11. Naz, N., Hameed, M., Ahmad, M.S.A., Ashraf, M. and Arshad, M. (2010) Is Soil Salinity One of the Major Determinants of Community Structure Under Arid Environments? Community Ecology, 11, 84-90.
http://dx.doi.org/10.1556/ComEc.11.2010.1.12 - 12. Aitken, S.N., Yeaman, S., Holliday, J.A., Wang, T. and Curtis-Mclane, S. (2008) Adaptation, Migration or Extirpation: Climate Change Outcomes for Tree Populations. Evolutionary Applications, 1, 95-111.
http://dx.doi.org/10.1111/j.1752-4571.2007.00013.x - 13. Balkenhol, N., Waits, L.P. and Dezzani, R.J. (2009) Statistical Approaches in Landscape Genetics: An Evaluation of Methods for Linking Landscape And Genetic Data. Ecography, 32, 818-830.
http://dx.doi.org/10.1111/j.1600-0587.2009.05807.x - 14. Hedrick, P.W., Ginevan, M.E. and Ewing, E.P. (1976) Genetic Polymorphism in Heterogeneous Environments. Annual Review of Ecology and Systematics, 7, 1-32.
http://dx.doi.org/10.1146/annurev.es.07.110176.000245 - 15. Campbell, D. and Bernatchez, L. (2004) Generic Scan Using AFLP Markers as a Means to Assess the Role of Directional Selection in the Divergence of Sympatric Whitefish Ecotypes. Molecular Biology and Evolution, 21, 945-956.
http://dx.doi.org/10.1093/molbev/msh101 - 16. Magdy, M., Werner, O., Mcdaniel, S., Goffinet, B. and Ros, R.M. (2015) Genomic Scanning Using AFLPto Detect Loci Under Selection in The Moss FunariaHygrometrica Along a Climate Gradient in The Sierra Nevada Mountains, Spain. Plant Biology, 18, 280-288.
http://dx.doi.org/10.1111/plb.12381 - 17. Poncet, B.N., Herrmann, D., Gugerli, F., Taberlet, P., Holderegger, R., Gielly, L., Rioux, D., Thuiller, W., Aubert, S. and Manel, S. (2010) Tracking Genes of Ecological Relevance Using A Genome Scan in Two independent Regional Population Samples of Arabis alpina. Molecular Ecology, 19, 2896-2907.
http://dx.doi.org/10.1111/j.1365-294X.2010.04696.x - 18. Savolainen, V., Anstett, M.-C., Lexer, C., Hutton, I., Clarkson, J.J., Norup, M.V., Powell, M.P., Springate, D., Salamin, N. and Baker, W.J. (2006) Sympatric Speciation in Palms on an Oceanic Island. Nature, 441, 210-213.
http://dx.doi.org/10.1038/nature04566 - 19. Wilding, C., Butlin, R. and Grahame, J. (2001) Differential Gene Exchange between Parapatric Morphs of Littorina saxatilis Detected Using AFLP Markers. Journal of Evolutionary Biology, 14, 611-619.
http://dx.doi.org/10.1046/j.1420-9101.2001.00304.x - 20. Meyer, C.L., Vitalis, R., Saumitou-Laprade, P. and Castric, V. (2009) Genomic Pattern of Adaptive Divergence in Arabidopsis halleri, a Model Species for Tolerance to Heavy Metal. Molecular Ecology, 18, 2050-2062.
http://dx.doi.org/10.1111/j.1365-294X.2009.04159.x - 21. Quintela-Sabarís, C., Ribeiro, M.M., Poncet, B., Costa, R., Castro-Fernández, D. and Fraga, M.I. (2012) AFLP Analysis of the Pseudometallophyte Cistus ladanifer: Comparison with cpSSRs and Exploratory Genome Scan to Investigate Loci Associated to Soil Variables. Plant and Soil, 359, 397-413.
http://dx.doi.org/10.1007/s11104-012-1221-8 - 22. Danin, A. (1983) Desert Vegetation of Israel and Sinai. Cana Publishing House, Jerusalem.
- 23. Mcginnies, W.G., Goldman, B.J. and Paylore, P. (1968) Deserts of the World, an Appraisal of Research into Their Physical and Biological Environments. University of Arizona Press, Tucson.
- 24. Zohary, M. (1973) Geobotanical Foundations of the Middle East. Gustav Fisher Verlag, Amsterdam.
- 25. Helmy, M.A., Abd-El-Wahab, R.H. and Batanouny, K.H. (1996) Distribution Behaviour of Seven Common Shrubs and Trees Growing in South-Sinai, Egypt. Egyptian Journal of Botany, 36, 53-70.
- 26. Moustafa, A.R. and Abdelwahab, R. (2013) Soil Fertility in South Sinai, Egypt. Lap Lambert Academic Publishing Gmbh Kg, Germany.
- 27. Ryan, J., Garabet, S., Harmsen, K. and Rashid, A. (1996) A Soil and Plant Analysis Manual Adapted for the West Asia and North Africa Region. ICARDA, Aleppo, Syria.
- 28. Udden, J.A. (1914) Mechanical Composition of Clastic Sediments. Geological Society of America Bulletin, 25, 655-744.
http://dx.doi.org/10.1130/GSAB-25-655 - 29. Richards, L.A. (1954) Diagnosis and Improvement of Saline and Alkali Soils. Government Printing Office, Washington DC.
- 30. Piper, C. (1950) Soil and Plant Analysis. International Public Inc., New York.
- 31. Anderson, M.J. (2003) PCO3: A FORTRAN Computer Program for Principal Coordinate Analysis. Department of Statistics, University of Auckland, Auckland.
- 32. Vos, P., Hogers, R., Bleeker, M., Reijans, M., Van De Lee, T., Hornes, M., Friters, A., Pot, J., Paleman, J. and Kuiper, M. (1995) AFLP: A New Technique for DNA Fingerprinting. Nucleic Acids Research, 23, 4407-4414.
http://dx.doi.org/10.1093/nar/23.21.4407 - 33. Bonin, A., Ehrich, D. and Manel, S. (2007) Statistical Analysis of Amplified Fragment Length Polymorphism Data: A Toolbox for Molecular Ecologists and Evolutionists. Molecular Ecology, 16, 3737-3758.
http://dx.doi.org/10.1111/j.1365-294X.2007.03435.x - 34. Peakall, R. and Smouse, P.E. (2006) GENALEX 6: Genetic Analysis in Excel. Population Genetic Software for Teaching and Research. Molecular Ecology Notes, 6, 288-295.
http://dx.doi.org/10.1111/j.1471-8286.2005.01155.x - 35. Bai, J., Xu, D., Kang, H., Chen, K. and Wang, G. (2008) Photoprotective Function of Photorespiration in Reaumuria soongorica during Different Levels of Drought Stress in Natural High Irradiance. Photosynthetica, 46, 232-237.
http://dx.doi.org/10.1007/s11099-008-0037-5 - 36. Zhou, Y., Pei, Z., Su, J., Zhang, J., Zheng, Y., Ni, J., Xiao, C. and Wang, R. (2012) Comparing Soil Organic Carbon Dynamics in Perennial Grasses and Shrubs in A Saline-Alkaline Arid Region, Northwestern China. PLoS ONE, 7, e42927.
http://dx.doi.org/10.1371/journal.pone.0042927 - 37. Bonin, A., Taberlet, P., Miaud, C. and Pompanon, F. (2006) Explorative Genome Scan to Detect Candidate Loci for Adaptation along a Gradient of Altitude in The Common Frog (Rana temporaria). Molecular Biology and Evolution, 23, 773-783.
http://dx.doi.org/10.1093/molbev/msj087 - 38. Leonard, S., Miles, R. and Tueller, P. (1988) Vegetation-Soil Relationships on Arid and Semiarid Rangelands, In: Tueller, P.T., Ed., Vegetation Science Applications for Rangeland Analysis and Management, Springer, Berlin, 225-252.
http://dx.doi.org/10.1007/978-94-009-3085-8_10 - 39. Baird, N.A., Etter, P.D., Atwood, T.S., Currey, M.C., Shiver, A.L., Lewis, Z.A., Selker, E.U., Cresko, W.A. and Johnson, E.A. (2008) Rapid SNP Discovery and Genetic Mapping Using Sequenced Rad Markers. PLoS ONE, 3, e3376.
http://dx.doi.org/10.1371/journal.pone.0003376
NOTES

*Corresponding author.