American Journal of Plant Sciences
Vol. 3 No. 12 (2012) , Article ID: 25802 , 11 pages DOI:10.4236/ajps.2012.312215
Integration of GC-MS Based Non-Targeted Metabolic Profiling with Headspace Solid Phase Microextraction Enhances the Understanding of Volatile Differentiation in Tobacco Leaves from North Carolina, India and Brazil
![]()
1Department of Plant Biology, North Carolina State University, Raleigh, USA; 2ITC R & D Centre, ITC Limited, Peenya, Industrial Area, Bangalore, India.
Email: *dxie@ncsu.edu
Received September 30th, 2012; revised November 13th, 2012; accepted November 25th, 2012
Keywords: Tobacco; Headspace Solid-Phase Microextraction; Gas Chromatography Mass Spectrum; Volatile Compounds
ABSTRACT
In this report, gas chromatography-mass spectrometry (GC-MS) based non-targeted metabolomics is used to develop appropriate headspace solid phase microextractions (HS-SPME) to enhance the understanding of volatile complexity of flue-cured tobacco leaves. Non-targeted metabolic profiling of GC-MS shows that the extraction condition of HSSPME at 100˚C for 30 min provides a better metabolite profile than other extraction conditions tested. GC-MS and principal component analyses (PCA) show that among five types of fibers tested, 100 μm polydimethylsiloxane (PMDS), 65 μm polydimethylsiloxane/divinyl-benzene (PMDS/DVB) and 75 μm carboxen/polydimethylsiloxane (CAR/ PMS) provide a better reproducible metabolite profile. Based on an appropriate PDMS extraction condition optimized, we use GC-MS analysis and PCA to compare metabolite profiles in flue-cured leaves of tobacco plants grown in North Carolina, India and Brazil, respectively. The resulting data of PCA show that the global metabolic profiles in North Carolina samples are separated from those in Brazil and India samples, two groups of which are characterized by a partially overlapped pattern. Several peaks that were differentially accumulated in samples were annotated to known metabolites by deconvolution analysis, such as norsolanadione, solavetivone and rishitin. Norsolanadione is detected only in Brazil samples. Solavetivone is detected in samples of India and Brazil but not in those of North Carolina. Rishitin is detected in samples of North Carolina and India but not in Brazil samples. These data indicate that not only can a non-targeted metabolic profiling approach enhance the understanding of volatile complexity, but also can identify marker volatile metabolites in tobacco leaves produced in different growth regions.
1. Introduction
Tobacco leaves are one of ideal materials to understand aromatic metabolite complexity in plants. This is because tobacco leaves produce numerous volatile aromatic metabolites during curing process and have formed an appropriate model to understand the aroma features of dry leaf products. Numerous previous investigations on aroma of tobacco leaves have greatly enhanced the understanding of formation of a large number of aromatic metabolites that are not accumulated in fresh leaves. b-Damascenone and megastigmatrienones (including 4 isomers) are two main examples of aromatic metabolites formed from the curing process of tobacco leaves [1]. Nicotine is a natural ingredient acting as a botanical insecticide in tobacco leaves. It is the most principal tobacco alkaloid metabolite, accounting for approximately 1.5% (dry weight) of commercial tobacco products and approximately 95% of the total alkaloid content. The levels of nicotine and its related alkaloids are highly associated with quality of tobacco leaf products. In addition, aromatic volatiles and all alkaloid metabolites are highly responsible for the flavor of tobacco products and chemical characteristics [2,3]. It have been noted that the flavor of tobacco leaves from different growth regions such as USA, Brazil and India is distinct from each other. Those different flavors and aromas are hypothesized to result from differentiation of volatile and other metabolite compositions in each specific growth condition. To date, the properties of those metabolites differentially accumulated in samples of different regions still remains unexplored. It is necessary to develop appropriate analytic approaches to understand the chemical complexity being responsible for flavor and aroma differentiation of tobacco leaves from different environmental conditions.
Different methods have been developed to extract metabolites from tobacco leaves. The aromatic volatiles from tobacco leaf products have been normally extracted with several methods, such as steam distillation (SD), simultaneous distillation extraction (SDE), liquid-liquid extraction (LLE) and accelerated solvent extraction (ASE). On the one hand, these methods have been demonstrated to be appropriate to provide certain profiles of volatiles. On the other hand, numerous studies have revealed certain limitations of these methods, including incompleteness of metabolite profiles, labor intensity, apparatus dependence and cost-consumption [2,4-6]. Accordingly, continuous efforts are necessary to understand aromatic and flavoring volatile compositions formed in tobacco leaves.
At the end of 1980s, solid-phase microextraction (SPME) was developed to understand volatiles in organisms. Over the past nearly 20 years, this technique has been shown to have multiple advantages in enhancing the understanding of volatile profiles of plants. In general, SPME facilitates rapid sample preparation, simplifies extraction steps, enriches metabolites and introduces metabolites into an analytical instrument with one solventfree step [7]. Therefore, the application of SPME has widely enhanced the identification of targeted volatiles in numerous crop and medicinal plants, examples of which include apple [8], Vitis vinifera [9], Artemisia argyi [10], Artemisia annua [11] and tobacco.
In this report, we aim to use an integrated approach of GC-MS based non-targeted metabolic profiling and optimization of HS-SPME conditions to understand aromatic and other volatile metabolite compositions in tobacco leaf products. Our experimental data show that GC-MS based metabolic profiling is effective to optimize extraction temperatures and times of SPME and compare extraction capacity of different fibers. Based on an appropriate HS-SPME condition developed in this study, GC-MS based non-targeted metabolic profiling and PCA analyses show global differentiation of volatile compositions in developmentally equivalent tobacco leaves of K326 plants grown in Brazil, India and North Carolina. Our data show that the global feature of volatile complexity of tobacco leaves and certain specific volatiles are closely associated with the growth regions.
2. Materials and Methods
2.1. Instruments and Accessories for Gas Chromatograph-Mass Spectrometry (GC-MS) and Headspace Solid Phase Microextraction (HS-SPME)
A gas chromatograph 5890 series II coupled with a mass selective detector 5792MSD (Agilent Technologies, USA) was used for metabolic profiling. A HP-INNOVAX (30 m × 0.25 mm × 0.25 μm) and a RTX-5 capillary column (30 m × 0.25 mm × 0.25 μm) were used for the gas chromatographic separation of metabolites, respectively.
Five types of HS-SPME fibers featured with different coating materials were used to extract metabolites. These five types of fibers were 100 μm polydimethylsiloxane (PDMS), 85 μm polyacrylate (PA), 65 μm polydimethylsiloxane/divinylbenzene (PDMS/DVB), 75 μm carboxenTM /polymethylsiloxane (CAR/PDMS), and 50/30 μm divinylbenzene/carboxen/polymethylsiloxane (DVB/CAR/ PDMS), which were purchased from Sigma-Aldrich (St. Luis, USA).
Four ml volume of clear glass vial, screw caps with PTFE/silicone septa, inlet liner (a direct SPME type) and SPME fiber holder were also purchased from SigmaAldrich.
2.2. Plant Growth and Leaf Harvest
The variety K326 is one of the most commercialized tobacco varieties grown globally and forms an appropriate model plant to investigate metabolomes due to its large myriads of metabolites. In the growth season of the year 2011, K326 plants were grown at Oxford tobacco research station in North Carolina and at ILTD research department at Rajamundry, Andhra Pradesh, in India respectively. In addition, K326 plants for cigarettes were grown in Brazil.
The experimental procedures of plant growth and sample harvest at Oxford station was as follow. Seeds were sown in the nursery beds and the management of seed germination and the seedling growth management was followed the standard tobacco growth protocol used in the research station
(http://www.ncagr.gov/research/otrs.htm). After 70 days of growth, 1500 seedlings were equally divided into three groups (each with 500) and planted into three plots in the field. After approximately two months of vegetative growth in the field, plants grew up to approximately 24 nodes from the bottom to the top. Plants with 24 nodes, each of which had one healthy leaf prior to blooming and topping, were chosen for experiments. At the time of topping, the first two leaves on the first and second nodes started senescence thus were removed from topped plants. The left leaves from the 3rd node (becoming the bottom one) to the top were numerated with #1-22. The topped plants were continuously grown approximately one month during which the sucker killer reagent was used to inhibit the growth of suckers by following the station’s tobacco growth management protocol. The first harvest of leaves started after three weeks of the topping. The two bottom leaves (from the 3rd and 4th nodes) of topped plants were collected together to form the first harvest. After 3 weeks of the first harvest, the second harvest was carried out to collect 3 - 8 leaves (from lower nodes to higher nodes), the 3 - 5 leaves of which were pooled together as one biological sample and the 6 - 8 leaves of which were collected together as another biological sample. After 3 weeks of the second harvest, the third harvest was carried out to collect 9 - 14 leaves, the 9 - 11 of which were collected together as one biological sample and the 12 - 14 of which were pooled together as another biological samples. After 3 weeks of the third harvest, the fourth harvest was performed to collect 15 - 20 leaves, the 15 - 17 of which were pooled together as one biological sample and the 18 - 20 of which were collected together as another biological sample. Leaves harvested at different time points were immediately flue cured in barns. The cured leaves were then stored in a dry room for extraction of metabolites. Leaves were then grounded into powder using heavy-duty blenders (Waring commercial, USA) and filtered through a 40-mesh sieve to remove big petiole and vein debris and then stored in room temperature in a desiccator until the use.
The growth protocol (sowing, transplanting & topping) of K326 plants in India was similar to the one in North Carolina as described above. The harvest procedure was also the same as described above, except that the first two leaves (on the first two nodes, nodes 1 and 2 from the bottom) were harvested at the time of topping (which is around 2 months after transplanting). The curing and labeling procedures of leaves were the same as described above.
Due to the difference of hemisphere between Brazil and India/North Carolina, in case of Brazil samples, the commercial grade leaves equivalent to the top 18 - 20 nodes of topped plants in North Carolina and India were used for analysis of volatiles.
2.3. Headspace Solid Phase Microextraction
Our goal was to integrate GC-MS based non-targeted profiling with headspace solid phase microextraction (HS-SPME) to enhance the understanding of volatile compositions in cured tobacco leaves. To perform this, we firstly chose flue-cured leaves from the 18 - 20 nodes of tobacco grown in North Carolina to compare the effects of different temperatures and times on extraction capacity of HS-SPME. Then, we used an appropriate condition to compare metabolic profiles of flue-cured leaves from the 18 - 20 nodes of tobacco plants grown in Brazil, India and North Carolina, respectively (described below).
To compare effects of extraction temperature and time on HS-SPME, one PDMS fiber was used to extract volatile metabolites. One HP-INNOVAX capillary column was used to separate metabolites. To optimize extraction temperature, 80˚C, 100˚C and 120˚C were tested and the extraction time was set at 30 min. To optimize the extraction time, 10, 20, 30, 40 and 50 min were tested at 100˚C.
Fifty milligrams of homogenized powder and small stir bar (0.5 cm in length) were placed in a 4-ml glass vial, the opening of which was then sealed with a PTFE/ silicone septa cap. Prior to extraction, one PDMS fiber was first conditioned for 30 min at 80˚C, 100˚C or 120˚C according to the protocol of the PDMS fiber provided by Sigma-Aldrich. The vial containing powder sample was placed on a Thermolyne® NUOVA II stirring/hot plate that was heated up to one of tested corresponding temperatures, 80˚C, 100˚C or 120˚C. The needle including the temperature-conditioned fiber was inserted into the vial by penetrating the septa cap and the headspace of the fiber was extended, suspended and exposed to volatile metabolites in the vial. The SPME holder was then secured. During extraction, the powder sample was agitated by the stir bar at 100 rpm and the stirring/hot plate was retained at the corresponding extraction temperature used. After the completion of the extraction with a selected time, the fiber was then retracted into the needle, followed by the removal of the needle from the vial. The fiber with absorbed metabolites was manually injected into the inlet of GC for 4 min of desorption at 250˚C described below for GC-MS analysis.
To compare the extraction capacity of the five types of fibers described above, we used cured leaf samples from the 18 - 20 nodes of tobacco plants grown in North Carolina. Each of five types of fibers was used to extract volatiles from the same 3 biological replicate samples contained in vials. The extraction time and temperature were set at 30 min and 100˚C, respectively. Extraction procedures were as described above. In addition, HPINNOVAX and RTX-5 capillary columns were compared in this experiment. The capillary column RTX-5 was used to separate metabolites extracted by five types of fibers. GC-MS analysis is described below.
To compare metabolic profiles of volatiles in fluecured leaf samples from Brazil, India and North Carolina, the leaves used were also from the 18th - 20th nodes of tobacco plants, the growth of which is described above. The fiber used for SPME was the type of PDMS. The extraction time and temperature were set at 30 min and 100˚C, respectively. Extraction procedures were as described above. The capillary column RTX-5 was used to separate metabolites. GC-MS analysis is described below.
2.4. GC-MS Analysis
GC-MS analysis described here was used for all experiments. Fibers with absorbed volatile metabolites were inserted into a splitless inlet (250˚C) of GC and analytes were desorbed for 4 min. The temperatures of column oven were initially set at 50˚C for 4 min, then ramped to 250˚C with a constant rate of 4˚C/min, held at 250˚C for 5 min, ramped to 260˚C at a constant rate of 5˚C/min and held at 260˚C for 5 min. Pure helium was used as the carrier gas with a flow rate of 1 ml/min. A positive electron impact ion source (70 EV) was used to ionize compounds and mass fragments were scanned in the range of 40 - 800 (m/z) starting with 4 min of retention time.
The mixture of even-numbered chain n-alkenes (C10 - C40) was purchased from Restek (Florida, USA, cat#31266). These standards were used to estimate retention index (RI) values, which were used to deconvolute metabolite peaks.
All analyses were performed with three biological replicates. Total ion chromatographic profiles of volatile metabolites from three biological replicates were recorded for detailed comparison. Main parameters used included the total numbers of peaks, distribution patterns of peaks in the entire chromatogram, peak shape and peak signal intensity. In addition, deconvolution of peaks described below was performed to identify marker metabolites associated with growth regions.
2.5. MS Data Analysis
Metabolite peaks were deconvoluted by Automated Mass Spectral Deconvolution and Identification System (AMDIS). According to the reported protocol [12] and RI values, the identification of compounds was performed by mass spectrum profile matching analysis (at least 80% matching) to known metabolites documented in the wiley 7th/Nist 05 MS library. The analysis of GC-MS data was performed as described in metaboanalyst 2.0 [13,14]. Mass spectrum data were uploaded into the websitebased software. Multivariate analyses such as principal components analysis were performed by using the metaboanalyst 2.0 software according to the protocol provided by the website (www.metaboanalyst.ca). The software metaboanalyst 2.0 effectively allowed the filtering of noisy background, identification of peaks, peak matching across samples, correction of retention times.
3. Results and Discussions
3.1. Effects of Extraction Temperatures and Times on Metabolite Profiles
Three temperature conditions (80˚C, 100˚C and 120˚C) tested differentially affected metabolite profiles extracted by a PDMS fiber. Based on the profiles of total metabolites and abundance of seven annotated metabolites, the PDMS fiber extracted more metabolites at 100˚C and 120˚C than at 80˚C (Figures 1(a) and (b)). Seven assigned metabolites included nicotine, neophytadine, nicotyrine, 2,3-dipyridyl, 3-hydro-beta-damascone, myosmine and cotinine. The levels of nicotine, myosmine, nicotyrine and 3-hydro-beta-damascone extracted were higher at 100˚C that at 120˚C and 80˚C. 3-Hydroxybeta-damascone was hardly detected from the extraction of the fiber at 80˚C. Myosmine was hardly detected from the extraction of the PDMA fiber at 120˚C. In contrast, the level of cotinine was higher extracted at 120℃ than at 100˚C and 80˚C. The levels of neophytadine and 2, 3-dipyridyl extracted were higher at 100˚C and 120˚C than at 80˚C. Based on these results, the extraction temperature for other SPMEs was set at 100˚C.
Five extraction times (10, 20, 30, 40 and 50 min) dramatically affected metabolite profiles extracted by SPME at 100˚C. Based on peak area values of total non-targeted metabolites and seven featured compounds chosen, there was an obvious trend of extraction efficiency, which was characterized by an increase from 10 - 30 min then a decrease from 30 - 50 min (Figures 2(a) and (b)). These results indicated that the extraction time of 30 min was appropriate for the use of the fiber to extract volatiles from cured tobacco leaves.
3.2. Comparison of Two Types of GC Capillary Columns
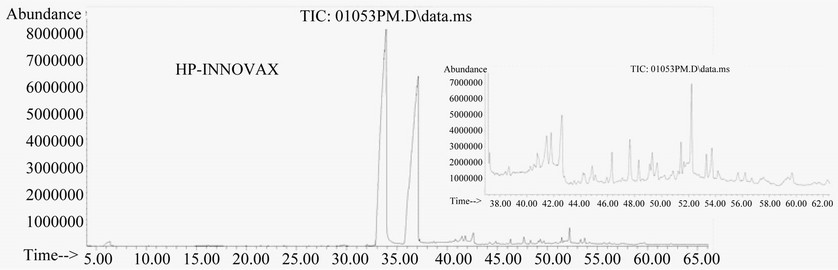
We compared the separation effectiveness of both HPINNOVAX and RTX-5 columns. The HP-INNOVAX type is a relative polar column made from polyethylene glycol (PEG). The RTX-5 type is a typical nonpolar column made from crossbond 5% diphenyl/95% dimethyl polysiloxane and commonly used for separation of metabolites for GC-MS analysis. In the same oven temperature gradient conditions described in method, significant differences of the two capillary columns were observed in separation profile patterns and the number of peaks detected (Figure 3). The profile pattern of metabolite peaks was better in the RTX-5 type than in the HP-INNOVAX type column (Figure 3).
3.3. General Effects of Five Fiber Types on Metabolic Profiling
The selection of an appropriate fiber type is a critical step
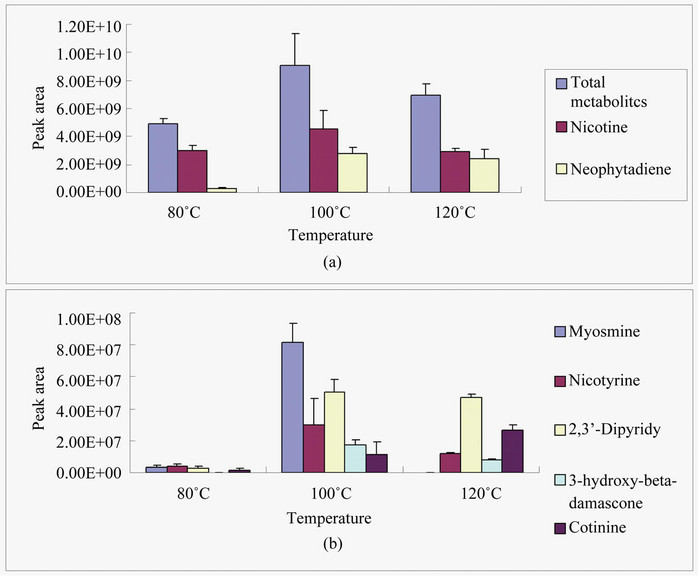
Figure 1. Effects of three temperatures on HS-SPME extraction capacity. Samples were extracted 30 min by a PDMS fiber and metabolites were separated in a HP-INNOVAX capillary column (30 m × 2.5 µm). The area values of seven metabolites were particularly chosen to compare the effects of three temperatures tested on metabolite profiles of HS-SPME. (a) Total area values of all peaks detected and two individual metabolites identified; (b) Area values of five metabolites identified.
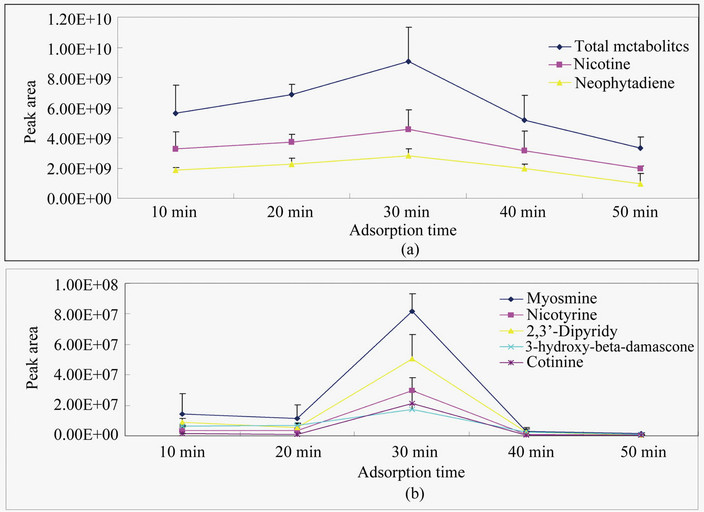
Figure 2. Impacts of five extraction times on extraction capacity of HS-SPME fibers. Samples were extracted with five different times at 100˚C by a PDMS fiber and metabolites were separated in a HP-INNOVAX capillary column (30 m × 2.5 µm). The area values of seven metabolites were particularly chosen to compare the effects of three temperatures tested on extraction capacity. (a) Total area values of all peaks detected and two individual metabolites identified; (b) Area values of five metabolites identified.
 (a)
(a)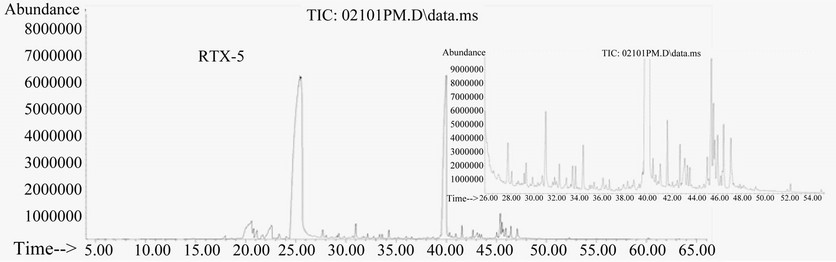 (b)
(b)
Figure 3. Total ion chromatograms of GC-MS showing the impacts of HPINNOVAX and RTX-5 capillary columns on profiles of metabolite separation. Samples were extracted 30 min at 100˚C by a PDMS fiber and metabolites were separated by the same gradient program. Two small windows in (a) and (b) are magnified snapshots showing differences of metabolite separation between two columns.
for SPME. Previous reports have shown that the efficacy of SPME is highly associated with the concentration and structural properties of metabolites in the vapor phase [7, 15]. In our experiments, we tested five types of SPME fibers, which were100 μm polydimethylsiloxane (PDMS), 85 μm polyacrylate (PA), 65 μm polydimethylsiloxane/ divinylbenzene (PDMS/DVB), 75μm carboxenTM/polymethylsiloxane (CAR/PDMS) and 50/30 μm divinylbenzene/carboxen/polymethy-lsiloxane (DVB/CAR/PDMS). In addition to the difference in diameter sizes, the five types of SPME fibers are featured with different coating polarity. The 100 μm polydimethylsiloxane (PDMS) fiber is featured with a single-phase non-polar coating. The 85 μm polyacrylate (PA) is a polar fiber with a singlephase coating. The 65 μm polydimethylsiloxane/divinylbenzene (PDMS/DVB), 75 μm carboxenTM/poly-methyllsiloxane (CAR/PDMS) and 50/30 μm divinylbenzene/carboxen/polymethyl-siloxane (DVB/CAR/PDMS) fibers are three types of mixed-phase ones featured with different levels of polar and non-polar coating characteristics.
To compare the extraction capacity of the five types of fibers, total ion chromatographic profiles of metabolites from three biological replicates were recorded for detailed comparison. Main parameters used to compare extraction capacity of five types of fibers included the total numbers of peaks, distribution patterns of peaks in the entire chromatogram, peak shape and peak signal intensity. Total ion chromatograms recorded showed that the total number of peak profiles and signal abundances of peaks were obviously different in five types of fibers (Figure 4). It was apparent that the number of metabolite peaks extracted by CAR/PDMS fiber was much smaller than those of metabolite peaks extracted by other four fibers (Figure 4). The peak numbers of volatiles extracted by the PDMS and PA fibers appeared to be similar from the retention 4 min to 42 min. In comparison, from 42 min to 60 min, the PDMS fiber provided better profiles of metabolites than the PA fiber did. The entire profiles of metabolite peaks from the extraction of polydimethylsiloxane/divinylbenzene (PDMS/DVB) and divinylbenzene/carboxen/polymethylsiloxane (DVB/CAR/ PDMS) were similar from the retention time 4 min to 60 min (Figure 4). Compared to the PDMS and PA fibers, the PDMS/DVB and DVB/CAR/PDMS fibers extracted more metabolites eluted from 4 min to 20 min.
3.4. Common Principal Metabolites Extracted by Five Types of Fibers
Although a general principle of “like dissolves like” has
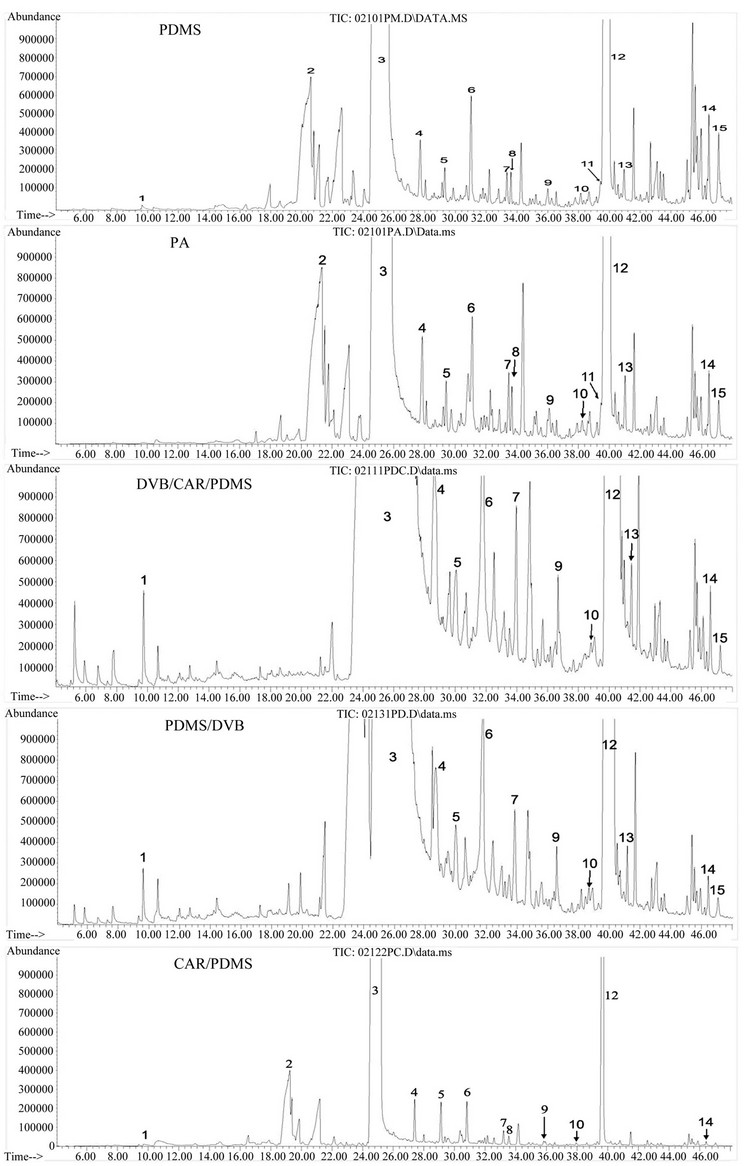
Figure 4. Total ion chromatograms of GC-MS showing different extraction capacity of five headspace solid phase microextraction (HS-SPME) fibers. One tobacco sample was extracted 30 min at 100˚C by five types of different HS-SPME fibers. The five fibers are a 100 μm PDMS, 85 μm PA, 65 μm PDMS/DVB, 75μm CAR/PDMS, a 50/30 μm DVB/CAR/PDMS. Fifteen metabolites were particularly chosen to compare extraction capacity of the five fibers, which are (1) 5-methyl-2-fufural; (2) 2,3-dihyro-3,5-dihydroxy-6-methyl-4H-pyran-4-one; (3) Nicotine; (4) Myosine; (5) Nicotyrine; (6) 2,3-dipyridyl; (7) 3-hydrobeta-damascone; (8) Megastimatrienone; (9) Cotine; (10) N(b)-formylnornicotine; (11) Rishitin; (12) Neophytadiene; (13) 3- hyroxysolavetivone; (14) Phytol; (15) Duvatriendiol.
been observed in SPME due to different properties of fiber types [16], 15 metabolites (Figure 4, labeled as Arabic numerals 1 - 15, regardless of their abundance in extractions) in cured tobacco leaves were characterized in extractions of the PDMS, PA, PDMS/DVB and PDMS/ CAR/DVB fibers. Based on specific MS profiles and RI index values, these 15 metabolites were deconvoluted using the NIST library and then annotated to known metabolites, respectively, which were 1) 5-methyl-2-fufural; 2) 2,3-dihyro-3,5-dihydroxy-6-methyl-4H-pyran-4-one; 3) nicotine; 4) myosine; 5) nicotyrine; 6) 2,3-dipyridyl; 7) 3-hydro-beta-damascone; 8) megastimatrienone; 9) cotine; 10) N(b)-formylnornicotine; 11) rishitin; 12) neophytadiene; 13) 3-hyroxysolavetivone; 14) phytol and 15) duvatriendiol. In addition to 5-methyl-2-fufural and duvatriendiol, other 13 metabolites were obviously detected in the extraction of the fiber PA. Furthermore, the abundances of these metabolites in extracts of SPME were closely associated with the fiber types. These data showed that these five types of fibers provided different coverage of volatile metabolites produced in cured tobacco leaves, indicating that to better understand volatile profiles in cured leaves, the application of more than one SPME is necessary.
3.5. Principal Component Analysis Showing Complementation Features of Different Types of Fibers in Understanding Volatile Profiles
To understand the relevance of extraction capacity of the 5 types of fibers, peaks and peak area values of metabolites were used as matrix for principal component analysis (PCA). PCA results showed that in a score plot of pin 1 and 2 (PC1 and PC2), the metabolite profiles from the extractions of the fibers of PDMS, CAR/PDMS, DVB/ PDMS were very reproducible, respectively, but clearly distant from each other (Figure 5). In contrast, the volatile profiles from the extraction of PA and PDMS/CAR/DVB fibers were relatively variable between biological replicates.
The five types of fibers used in this investigation showed the significant complementation features that enhance the understanding of volatile composition in cured tobacco leaves. As described above in the score plot of PCA results (Figure 5), the metabolite profiles in the extracts are obviously separated among the fibers of PDMS, PDMS/DVB and CAR/PDMS. From the metabolite profiles of total ion chromatography (Figure 4), the use of the PDMS and PDMS/DVB can complementally reveal the global volatile profiles in cured tobacco leaves. The PDMS fiber provided a relatively enriched profile of metabolites eluted after 45 min. Meanwhile, the PDMS/ DVB fiber showed a relatively enriched profile of me-
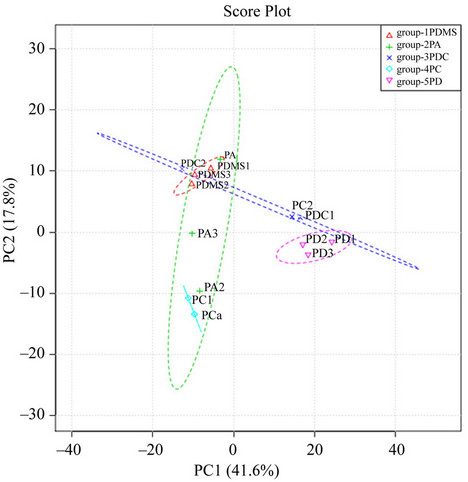
Figure 5. Principal component analysis (PCA) showing the differentiation of extraction capacity of five types of SPME fibers. The score plot of PCA for five fibers were established from three times of analyses with HS-SPME-GC-MS. All detected peaks and their corresponding area values were used as data matrix for PCA. The five types of fibers are a 100 μm PDMS (group-1PDMS), 85 μm PA (group-2PA), 65 μm PDMS/DVB (group-5PD), 75 μm CAR/PDMS (group 4PC) and 50/30 μm DVB/CAR/PDMS (group-3PCD). The sample was extracted 30 min at 100˚C by each fiber.
tabolites eluted from 4 min to 45 min (Figure 4). The DVB/CAR/PDMS fiber is coated with materials of both the PDMS and PDMS/DVB fibers. As expected, this fiber provided metabolite profiles covering the range of both the PDMS and PDMS/DVB fibers (Figures 4 and 5).
Unlike PDMS and PDMS/DVB fibers, the metabolic profiles resulting from the extraction of the DVB/ CAR/PDMS fiber was relatively variable between biological replicates. These results suggest that the use of these three fibers can enhance the understanding of volatile profiles in cured tobacco leaves. In contrast, the PA fiber extraction lacked a good reproducibility and the CAR/PDMS fiber lacked an appropriate enrichment of metabolites. These results suggest that the use of these two types of fibers likely limits the full understanding of volatiles in cured tobacco leaves.
The different extraction capacity of these fibers most likely results from the materials and coating properties as described above and their preferences to different volatile metabolites. The PDMS/DVB and DVB/CAR/PDMS fibers have been reported to preferably extract certain types of low-molecular metabolites, examples of which include 2-methyl-pyrazine; 3-furaldehyde; 2-furanmethanol; 5-methyl-furfural et al. [16,17]. In our case, some low-molecular metabolites were presenting in the extracts of PDMS/DVB and DVB/CAR/PDMS fibers (Figure 4).
3.6. Comparison of Volatile Profiles in Cured Leaves of Tobacco Plants Grown in North Carolina, India and Brazil
The goal of integration of GC-MS based profiling with different HS-SPMEs is to study metabolic complexity in leaves of tobacco plants grown in different places, such as North Carolina, India and Brazil reported here. In this study, we report the use of integration of GC-MS and the PDMS fiber. Total ion chromatography (Figure 6) was recorded to compare metabolite profiles in flue-cured leaves of K326 tobacco plants grown in Brazil, India and North Carolina, respectively. After detailed comparison of peaks detected, several main volatile metabolites were identified to be differentially produced in samples from the three regions (Figure 6 and Table 1). On the one hand,
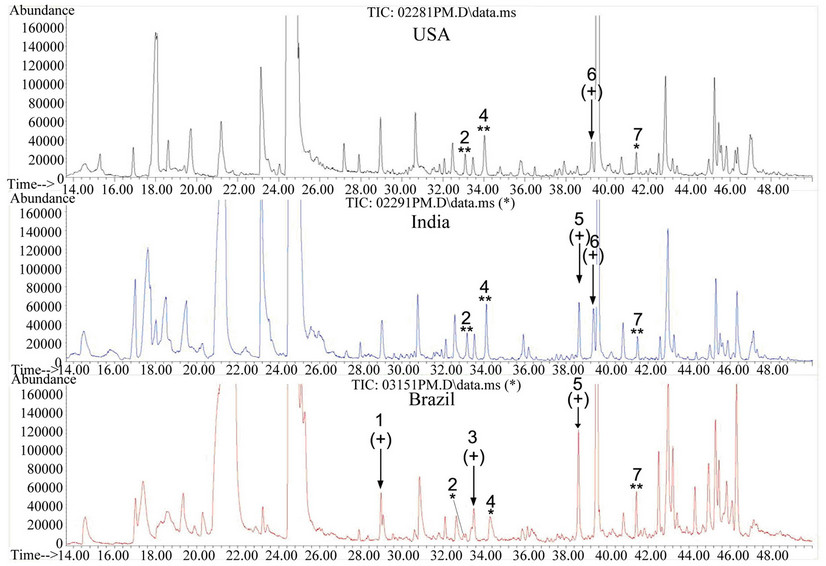
Figure 6. Comparison of total ion chromatograms of metabolites extracted from flue-cured tobacco leaves grown in North Carolina, Brazil and India. Flue-cured leaf samples from the 18th-20th nodes of K326 tobacco plants were extracted 30 min at 100˚C by PDMS fiber and metabolites were separated in a RTX-5 capillary column (30 m × 2.5 µm) using the same gradient program. The arrows indicate feature peaks detected in different growth regions. The labeling “**” indicates that the peak detected from tobacco samples of two growth regions have the same MS fragments. The labeling “*” indicates that although the retention time is the same, the peak detected in leaf samples of this growth region has different MS fragments from that of the peak labeled with “**”.
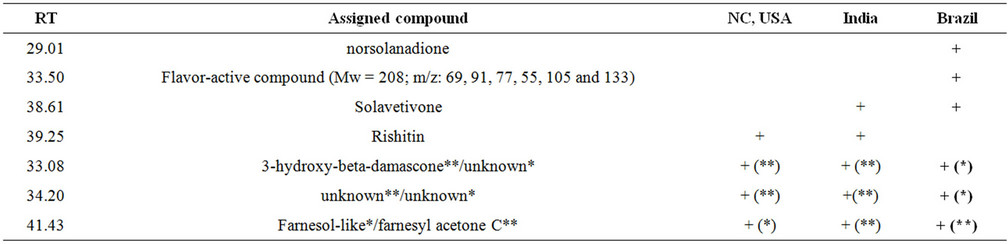
Table 1. Examples of metabolites differentially formed in flue-cured leaves of tobacco plants grown in Brazil, India and North Carolina, respectively. The annotation of metabolites was completed via deconvolution with the NIST-MS database and their RI values. “+” means the presence of the metabolite. RT: retention time.
a peak (labeled with peak #1) was detected in Brazil samples but not in ones of India and North Carolina. This peak #1 was annotated to be norsolanadione by deconvolution analysis. N orsolanadione is a product derived from the autooxidation of solanone, which is an unsaturated ketone and commonly used as a fragran t additive [18]. On the other hand, a peak (labeled with peak #5) was detected in samples of India and Brazil but not in ones of North Carolina. This peak #5 was annotated to be solavetivone by deconvolution analysis. In addition, rishitin was detected in samples of North Carolina and India but not in Brazil samples (Figure 6 and Table 1). Furthermore, other differences were observed among the three region samples. A peak (labeled with peak #7) was detected at 41.43 min in samples of all three regions (Figure 6). This peak #7 in samples of North Carolina was deconvoluted to be a farnesol-like metabolite, while this peak #7 in samples of India and Brazil was deconvoluted to be a farnesyl acetone C-like metabolite (Figure 6 and Table 1). Another peak (labeled with peak #2) was detected at 33.08 min in samples of all three regions (Figure 6). MS profile and deconvolution analyses showed that this peak #2 in samples of North Carolina and India was 3-hydroxy-beta-damascone, an aromatic metabolite, while this peak #2 in samples of Brazil was featured with a different MS profile from the one of 3-hydroxy-betadamascone (Figure 6, Table 1). At the retention time of 34.20 min, a peak (labeled with peak #4) was detected in all samples of North Carolina, India and Brazil. Although this peak #4 could not be annotated to any known metabolites, it could be featured by MS profile. This peak #4 in samples of both North Carolina and India was shown the same MS profile, which, however, was different from the MS profile of the peak #4 in samples of Brazil. These data show the differentiation of volatile compositions in developmentally equivalent leaf samples of K326 plants grown in Brazil, India and North Carolina.
3.7. Principal Component Analysis of Metabolic Profiles in Samples of Brazil, India and North Carolina
An unsupervised multivariate analysis method of PCA was performed to obtain a global view of metabolite profile differentiation in samples from the three regions. GC-MS data were analyzed with the metaboanalyst 2.0 software that provided functions of peak picking, nomalisation, alignment and feature extraction. All detectable metabolite peaks were used as a main matrix. The result of PCAs provided a plot of the principal component (PC) scores for the most important PCs (PC1 vs PC2) (Figure 7(a)). The first two PCs account for 67.6% of the total variation (PC1: 40.3% and PC2: 27.3%). From this PCA
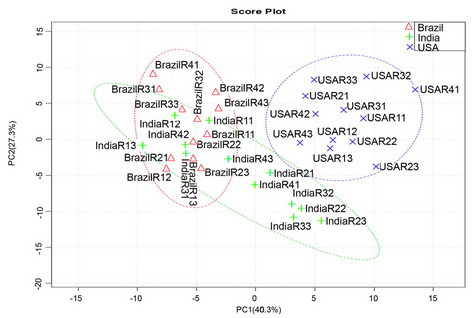 (a)
(a)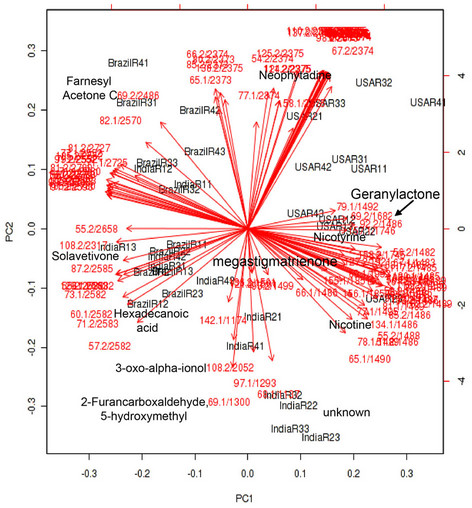 (b)
(b)
Figure 7. Principal component analysis (PCA) for samples collected from three growth regions. Thirty-six samples from different growth region were used as contributes for PCA. These samples were extracted 30 min at 100˚C by PDMS fiber and metabolites were separated in a RTX-5 capillary column (30 m × 2.5 µm) using the same gradient program. (a) A score plot of samples on the first and second principal component; (b) A loading plot of samples.
plot, the global volatile metabolite profiles of samples of North Carolina are clearly separated from those of samples of India and Brazil. The metabolite profiles in samples of India and Brazil are partially overlapped in the PCA score (Figure 7(a)). In addition, a loading plot of PCA (Figure 7(b)) was established to show abundant metabolites (variables) contributing to the PCA result. These metabolites include differentially accumulated metabolites listed in Table 1. These results indicate that the volatile metabolite profiles are altered in the developmentally equivalent leaves of the K326 tobacco plants grown in the three regions. In addition, our data suggest that these metabolites are likely biogeography-associated marker metabolites to differentiate tobacco plants grown in three regions and these marker metabolites probably contribute to the different flavor among tobaccos from three planting place.
4. Conclusion
Our experiments show that an integration of a non-targeted metabolic profiling approach with an appropriate HS-SPME is effective to enhance the understanding of volatile complexity in cured tobacco leaves. Using this approach, marker metabolites can be identified to distinguish tobacco leaves produced in USA, India and Brazil.
5. Acknowledgements
This research is financially supported by ITC Limited, India.We are grateful to Dr. Christophe La Hovary, Ms. Fatima Alejos, Dr. Ming-Zhu Shi, Dr. Zhong Liu and Dr. Li-Li Zhou for helping sample collection from the field.
REFERENCES
- J. C. Leffingwell, “CAROTENOIDS AS FLAVOR AND fragrance precursors,” Leffingwell Reports, Vol. 2, No. 6, 2002, pp. 1-5.
- J. Cai, B. Liu, P. Ling and Q. Su, “ Analysis of Free and Bound Volatiles by Gas Chromatography and Gas Chromatography-Mass Spectrometry in Uncased and Cased Tobacco,” Journal of Chromatography A, Vol. 947, No. 2, 2002, pp. 267-275. doi:10.1016/S0021-9673(02)00015-8
- B. Rodu, “The Scientific Foundation for Tobacco Harm Reduction, 2006-2011,” Harm Reduction Journal, Vol. 8, No. 1, 2011, p. 19. doi:10.1186/1477-7517-8-19
- L. F. Huang, K. J. Zhong, X. J. Sun, M. J. Wu, K. L. Huang, Y. Z. Liang, F. Q. Guo and Y. W. Li, “Comparative Analysis of the Volatile Components in Cut Tobacco from Different Locations with Gas ChromatographyMass Spectrometry (GC-MS) and Combined Chemometric Methods,” Analytica Chimica Acta, Vol. 575, No. 2, 2006, pp. 236-245. doi:10.1016/j.aca.2006.05.079
- Y. Li, T. Pang, Z. Guo, X. Wang, J. Deng, K. Zhong, X. Lu and G. Xu, “Accelerated Solvent Extraction for GC-Based Tobacco Fingerprinting and Its Comparison with Simultaneous Distillation and Extraction,” Talanta, Vol. 81, No. 1-2, 2010, pp. 650-656. doi:10.1016/j.talanta.2009.12.054
- X. Zhu, Y. Gao, Z. Chen and Q. Su, “Development of a Chromatographic Fingerprint of Tobacco Flavor by Use of GC and GC-MS,” Chromatographia, Vol. 69, No. 7-8, 2009, pp. 735-742. doi:10.1365/s10337-009-0968-4
- S. Risticevic, H. Lord, T. Gorecki, C. L. Arthur and J. Pawliszyn, “Protocol for Solid-Phase Microextraction Method Development,” Nature Protocols, Vol. 5, No. 1, 2010, pp. 122-139. doi:10.1038/nprot.2009.179
- E. Aprea, H. Gika, S. Carlin, G. Theodoridis, U. Vrhovsek and F. Mattivi, “Metabolite Profiling on Apple Volatile Content Based on Solid Phase Microextraction and Gas-Chromatography Time of Flight Mass Spectrometry,” Journal of Chromatography A, Vol. 1218, No. 28, 2011, pp. 4517-4524. doi:10.1016/j.chroma.2011.05.019
- G. Weingart, B. Kluger, A. Forneck, R. Krska and R. Schuhmacher, “Establishment and Application of a Metabolomics Workflow for Identification and Profiling of Volatiles from Leaves of Vitis vinifera by HS-SPMEGC-MS,” Phytochemical Analysis, Vol. 23, No. 4, 2011, pp. 345-358. doi:10.1002/pca.1364
- N. Li, Y. Mao, C. Deng and X. Zhang, “Separation and Identification of Volatile Constituents in Artemisia Argyi Flowers by GC-MS with SPME and Steam Distillation,” Journal of Chromatographic Science, Vol. 46, No. 5, 2008, pp. 401-405.
- S. Reale, P. Fasciani, L. Pace, F. De Angelis and G. Marcozzi, “Volatile Fingerprints of Artemisinin-Rich Artemisia annua Cultivars by Headspace Solid-Phase Microextraction Gas Chromatography/Mass Spectrometry,” Rapid Communications in Mass Spectrometry, Vol. 25, No. 17, 2011, pp. 511-2516. doi:10.1002/rcm.5155
- S. Bijlsma, I. Bobeldijk, E. R. Verheij, R. Ramaker, S. Kochhar, I. A. Macdonald, B. van Ommen and A. K. Smilde, “Large-Scale Human Metabolomics Studies: A Strategy for Data (Pre-) Processing and Validation,” Analytical Chemistry, Vol. 78, No. 2, 2006, pp. 567-574. doi:10.1021/ac051495j
- J. Xia, N. Psychogios, N. Young and D. S. Wishart, “MetaboAnalyst: A Web Server for Metabolomic Data Analysis and Interpretation,” Nucleic Acids Research, Vol. 37, 2009, pp. W652-W660. doi:10.1093/nar/gkp356
- J. Xia and D. S Wishart, “Web-Based Inference of Biological Patterns, Functions and Pathways from Metabolomic Data Using Metabo Analyst,” Nature Protocols, Vol. 6, No. 6, 2011, pp. 743-760. doi:10.1038/nprot.2011.319
- S. S. Yang, C. B. Huang and I. Smetena, “Optimization of Headspace Sampling Using Solid-Phase Microextraction for Volatile Components in Tobacco,” Journal of Chromatography A, Vol. 942, No. 1-2, 2002, pp. 33-39. doi:10.1016/S0021-9673(01)01376-0
- H. Kataoka, H. L. Lord and J. Pawliszyn, “Applications of Solid-Phase Microextraction in Food Analysis,” Journal of Chromatography A, Vol. 880, No. 1-2, 2000, pp. 35-62. doi:10.1016/S0021-9673(00)00309-5
- E. Baltussen and C. A. Cramers, “Sorptive Sample Preparation—A Review,” Analytical and Bioanalytical Chemistry, Vol. 373, No. 1-2, 2002, pp. 3-22. doi:10.1007/s00216-002-1266-2