Open Journal of Fluid Dynamics
Vol.2 No.4A(2012), Article ID:26355,7 pages DOI:10.4236/ojfd.2012.24A032
Simulation and Experimental Study on the Atomization Character of the Pressure-Swirl Nozzle
School of Astronautics, Beihang University, Beijing, China
Email: zjbo@sa.buaa.edu.cn
Received September 17, 2012; revised October 29, 2012; accepted November 8, 2012
Keywords: Atomization; Simulation; PDPA
ABSTRACT
In this paper the atomization character of the pressure-swirl injector was measured by using the Phase Doppler Particle Analyzer (PDPA) in the section of 150 mm below the outlet of the orifice. The orifice diameter of the pressure-swirl injector is 0.62 mm. The atomization character includes the spray angle, the water flow rate, the Sauter mean diameter (SMD), the velocity of the particles and their distribution in the radial and the axial directions under the pressure from 1 MPa to 4.5 MPa. After that the atomization character of the pressure-swirl injector was simulated in the DPM panel. The same atomization character of the injector was calculated and compared with the experimental data. The simulation was corrected by using the experimental data which can make it accurately and the model can be used to predict and calculate the atomization character of different injectors.
1. Introduction
The nozzle is an important part in the thrust chamber and in the gas generator. Its character has a direct influence on the injection and the combustion process. Study on the atomization character and get the droplet size, velocity and their distribution in the axial and radial directions, the atomization character and the combustion character can be predicted. So it can help to optimize the design of the nozzle and improve the reliability and the stability of the combustion in rocket. So it is significant to study the atomization character of the nozzle.
There are three methods to study the atomization. The first one is the theory analysis, the second one is the measurement, and the third one is the simulation.
As early as 19th century, the atomization mechanism has been studied and nowadays, there have been many conclusions [1]. The atomization can be completed by different kinds of atomizers, but the atomization processes are the same. First, the liquid should be spread into film or jet flow, then it breaks up into droplets due to the interaction of the turbulence and the air. So the jet flow break-up and the film break-up are the two basic methods in the process of atomization.
In the atomization experiments, not only the droplet size and its distribution, but also the velocity and its distribution and the water flux need to be measured. So the methods that can’t interfere with the flow and the atomization fields should be applied. In which the optical method is used most widely. As the laser, microelectronic and the computer developing, some non-contact new optical measurement technologies were developed [2,3], such as the laser hologram, the laser light scattering and the laser phase Doppler measurement technologies and so on, all these technologies have the adventure of not interfering with the flow field and good resolution in space and time which provides a good measurement method for studying the atomization. The combination of laser and the computer has become a feature of the modern optics.
The simulation is a result of the developing and the combination of the computer, mathematic and the CFD. The development of the simulation makes it possible to solve the complex problems in the scientific research and the engineering design. It can get a correct result of the complex problems, and it can be used commonly.
As a deep research on the break-up and atomization and the application of simulation, several atomization models were developed [4-6]. In which the break-up and the collision are the most important two models. In which the break-up model includes the TAB and the WAVE models. The TAB model is developed by Taylor and it is got from the basic of the analogy between the droplets oscillation and the elasticity quality system. The WAVE model considers the break-up is a result of the increasing of instability in the droplets surface.
In this paper, the measurement method and the simulation method are applied to study the atomization character of the pressure-swirl nozzle in the section of 150 mm below the outlet of the orifice. And the simulation results are compared with the measurement results to evaluate these two methods.
2. Experiments
The schematic diagram of the pressure-swirl nozzle that applied in the measurement is shown in Figure 1. The depth and width of the swirl slot is 1 mm × 1 mm and the swirl angle is 30˚. The parameters of the pressure-swirl nozzle are shown in Table 1. The system pressures vary from 1 MPa - 4 MPa. The flow rates of the nozzle under different pressures are shown in Figure 2.
The medium is water. The measurement of droplet velocity, diameter and their distribution uses the PDPA. The measurement of flow rate uses the LWGY-4 flow meter and the XSJ flow integrating meter.
The Sauter mean diameter and its distribution, droplet velocity and its distribution in the radial direction were measured using the PDPA under 1 MPa, 2 MPa, 3 MPa, 3.5 MPa and 4 MPa separately in the section of 150 mm below the outlet of the orifice. The measurement photo is shown in Figure 3. The spray process was taken photos and the spray angle was measured using the graphic software. In Figures 4 and 5, the droplet velocity and its distribution, the droplet diameter and its distribution in radial direction are listed.
3. Simulation
The pressure-swirl nozzle is used in the simulation of the atomization. The simulation uses the discrete phase model and the discrete phase interacts with the continuous phase.
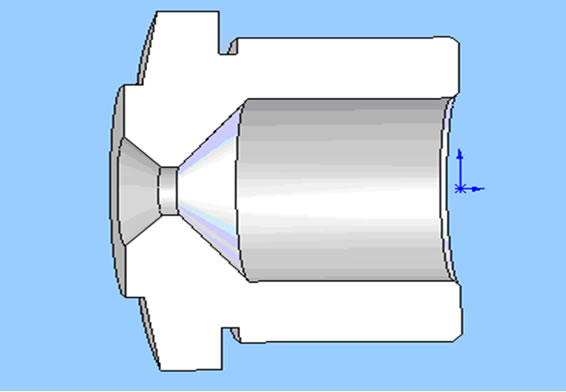
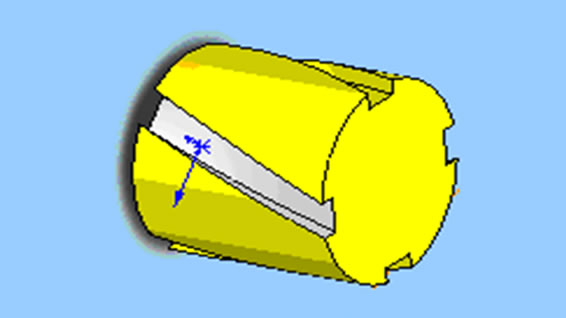
Figure 1. Schematic of the swirl nozzle.
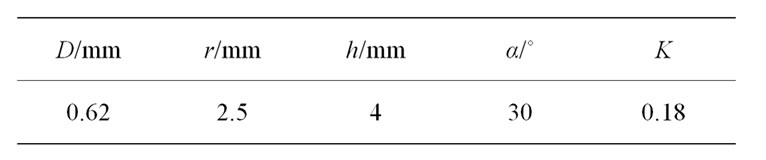
Table 1. Character of the swirl nozzle.
Figure 2. Correlation between pressure and flow rate.

Figure 3. PDPA measurement photo.
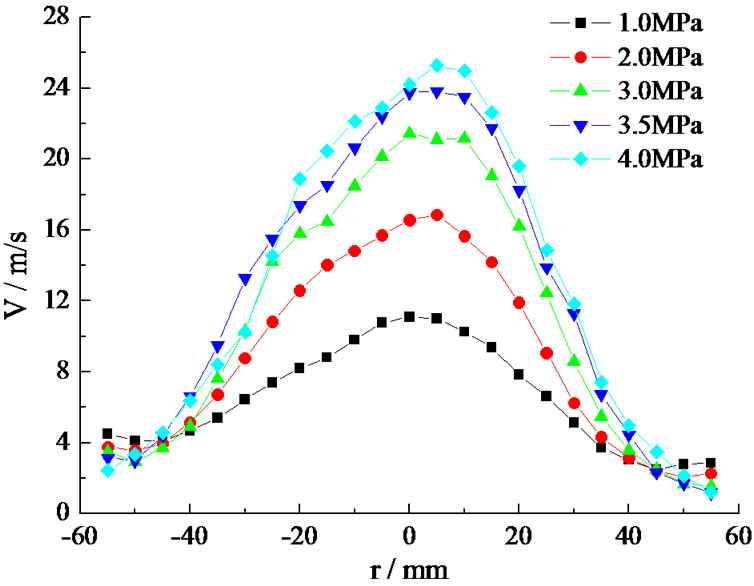
Figure 4. Droplet velocity measurement result.
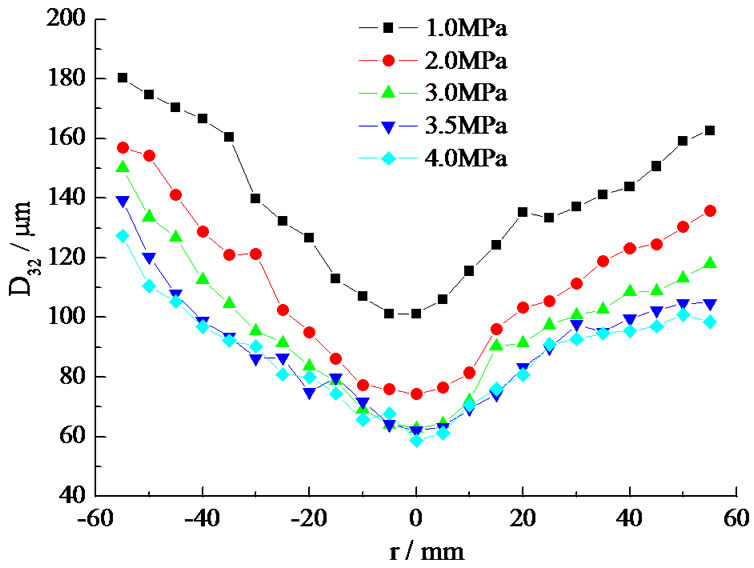
Figure 5. Droplet diameter measurement result.
The height of the calculation zone is 250 mm and the radius is 50 mm. The reason that measuring the atomization character in the section of 150 mm below the outlet of the orifice lies in that it is reported the droplet diameter is smallest in this section.
In the injection panel, the particle type selects the droplets. The nozzle diameter is 0.62 mm, the same with the nozzle used in the experiments. In the simulation, the system pressure and the flow rate are input parameters, and according to the experiments the pressures use 1 MPa, 2 MPa, 3 MPa, 3.5 MPa, 4 MPa and 5 MPa. The flow rate is measured using the flow integrating meter.
Figure 6 is the simulation result. It is a steady atomization process. In the simulation the data in the section of 150 mm from the nozzle orifice is recorded. When it is steady the data is read and compared with the experimental data.
4. Results and Discussion
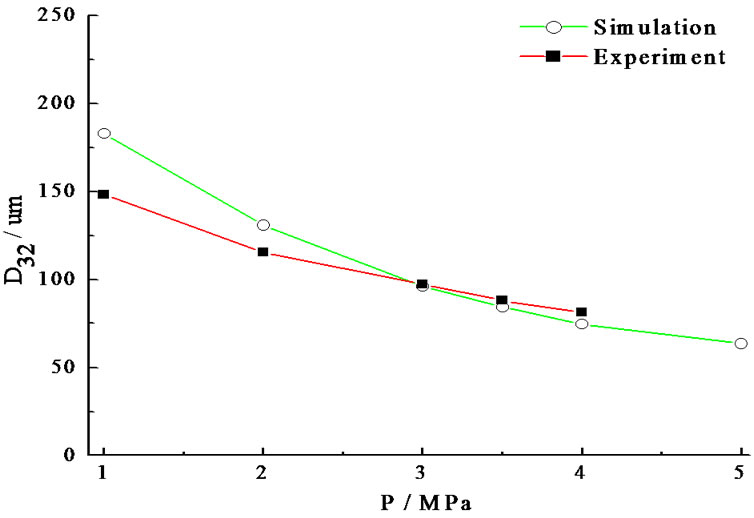
The comparison of the experimental result and the simulation result is shown in Figure 7 and the system error is listed in Table 2.
From Figure 7 and Table 2 it can be seen that the higher the pressure is, the smaller the Sauter mean diameter is and the larger the droplet velocity is. When the pressure is small, the Sauter mean diameter in the simulation is larger than that in the experiments. When the system pressure is larger than 3 MPa, the Sauter mean diameter in the simulation is smaller than that in the experiments. That illustrates that in the simulation, the Sauter mean diameter is sensitive with the pressure. The higher the system pressure is, the faster the max growth rate of the thread film is. The linear stability of the surface wave of the thread film gets worse, so the interaction between the gas phase and the liquid phase becomes stronger and the film can break up more easily, the droplet diameter gets smaller. The droplet velocity in the
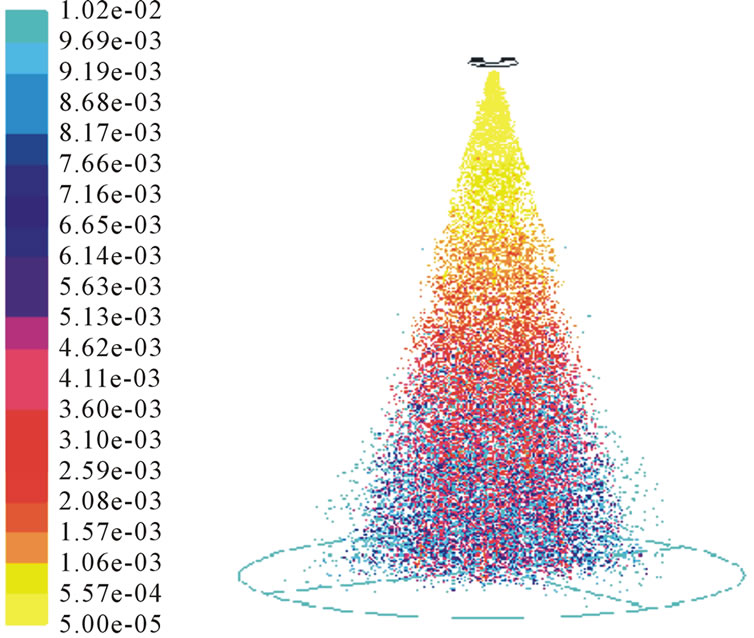
Figure 6. Simulation result.
 (a)
(a)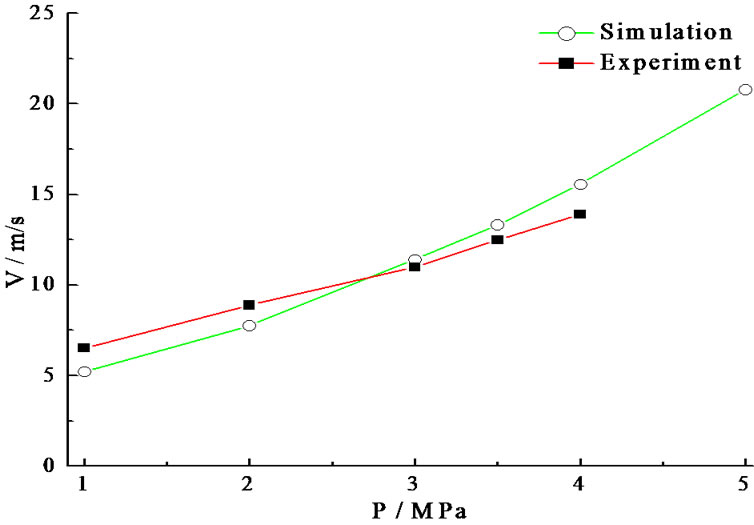 (b)
(b)
Figure 7. Comparison of simulation and experiment. (a) Droplet diameter; (b) Droplet velocity.
simulation agrees with that in the experiments well. When the pressure is small than 3 MPa, the droplet velocity in the simulation is a little smaller than that in the experiments, while the pressure is larger than 3 MPa, it is
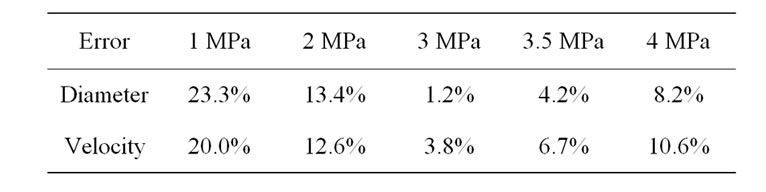
Table 2. Error of the simulation and experiment.
a little larger than that in the experiments. The reason is the same with that of the diameter. Meanwhile, in the simulation, the surface roughness of the nozzle and the frictional force are neglected so the variation range of the parameter is wider.
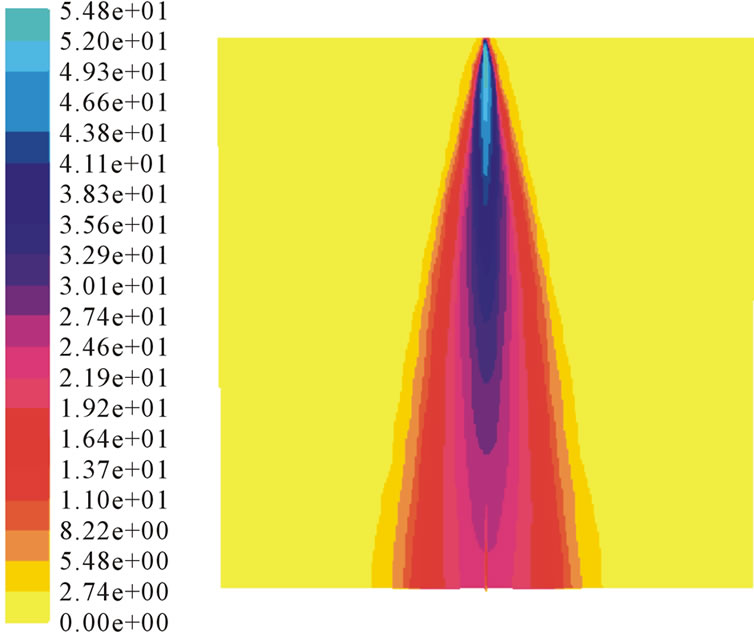
The distributions of the droplet diameter and the diameter velocity in the axial and radial direction also obey a certain rule. Figure 8 is the velocity distribution in the calculation zone under 3 MPa. It can be seen that when the droplet is injected from the nozzle, as the motion distance increasing, its velocity decreases rapidly. This is because the diameter of the droplet is about 100 µm, so the air resistance can’t be neglected. The air resistance has a great influence on the droplet velocity and it decreases from about 40 m/s at the orifice to 10 m/s at the section of 150 mm.
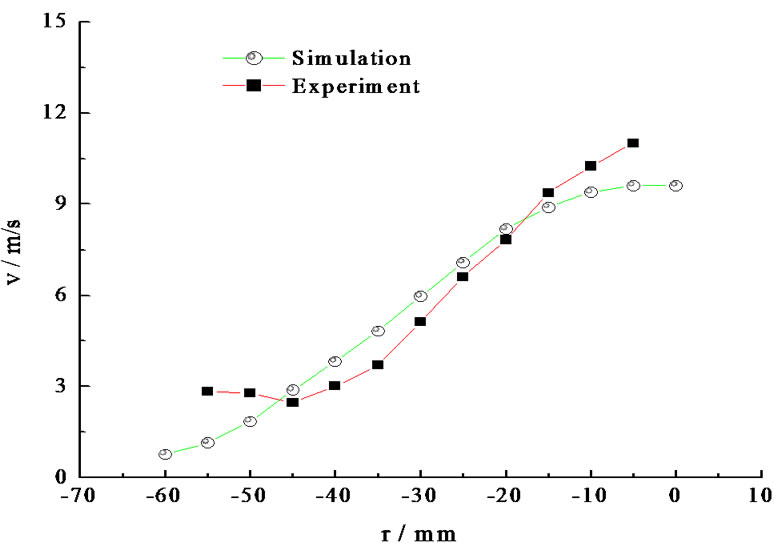
The comparisons of the simulation and experiment of the velocity distribution in radial under different pressures are shown in Figure 9.
From Figure 9 it can be seen that the simulation results agree with the experimental results well. Especially when the system pressure is larger than 2.0 MPa, two curves coincide.
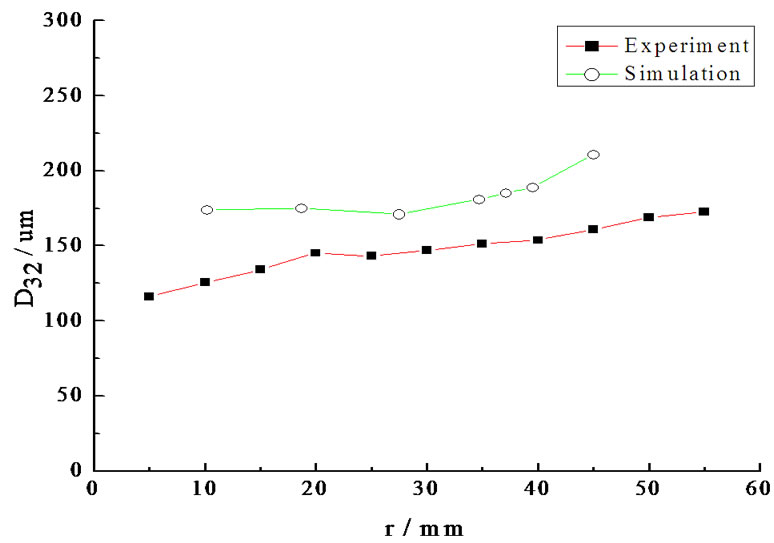
The comparison of the simulation and the experiments of the Sauter mean diameter and its distribution are shown in Figure 10.
The droplet diameter is distributed according to the Rosin-Rammler/log-normal distribution. The Rosin-Rammler distribution function is based on the assumption that an exponential relationship exists between the droplet diameter, d, and the mass fraction of droplets with diameter great than d, Yd:
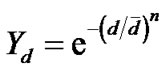 (1)
(1)
The droplet diameter probability density function (PDF) is determined by the following equation:
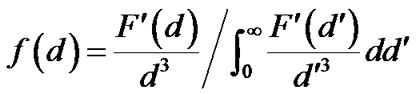 (2)
(2)
From Figure 10 it can be seen that, under different pressures, the distributions of the Sauter mean diameter in the radial direction are not smooth. But the simulation result agrees with the experimental result in the overall trends, only the magnitude makes different. When the pressure is low, the simulation result of the Sauter mean diameter is larger than the experimental value, as the pressure increasing, it is opposite. The longer the dis-
 (a)
(a)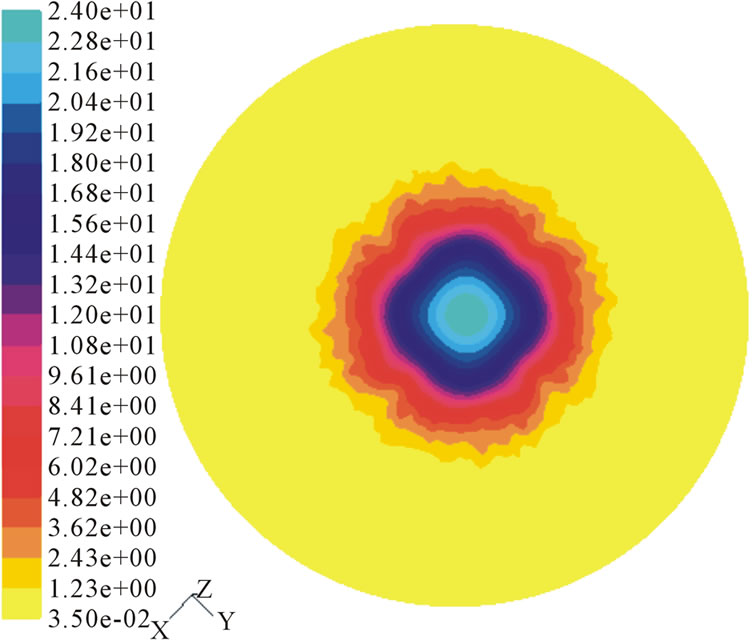 (b)
(b)
Figure 8. Velocity distribution. (a) Axial; (b) Radial.
tance from the axis is, the larger the Sauter mean diameter is. This is because in the simulation, the frictional force of the nozzle is neglected. The higher the system pressure is, the greater the influence of the frictional force on the break up. So if the pressure higher than 3.5 MPa, the diameter in the simulation would be larger than that in experiments.
Figure 10 agrees with the Figure 9. In the section of 150 mm below the nozzle orifice, when the radial distance further from the axis, the droplet velocity gets smaller and the droplet diameter gets larger. It also can be seen from Figure 10 that as the radial distance increasing, the droplet decreases sharply to a low level, and the correlation is cosine approximately. This is because in the center of the calculation zone, the growth rate of the liquid film is largest, so the droplet diameter is smallest and the droplet velocity is largest.
 (a)
(a)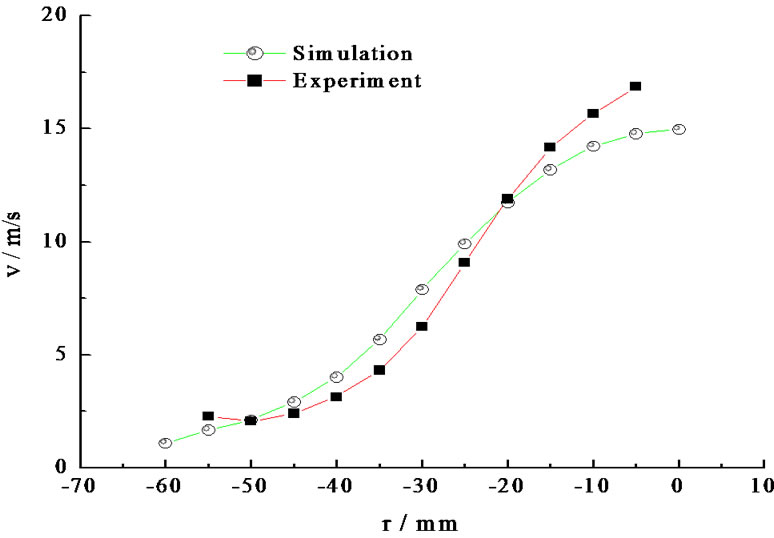 (b)
(b)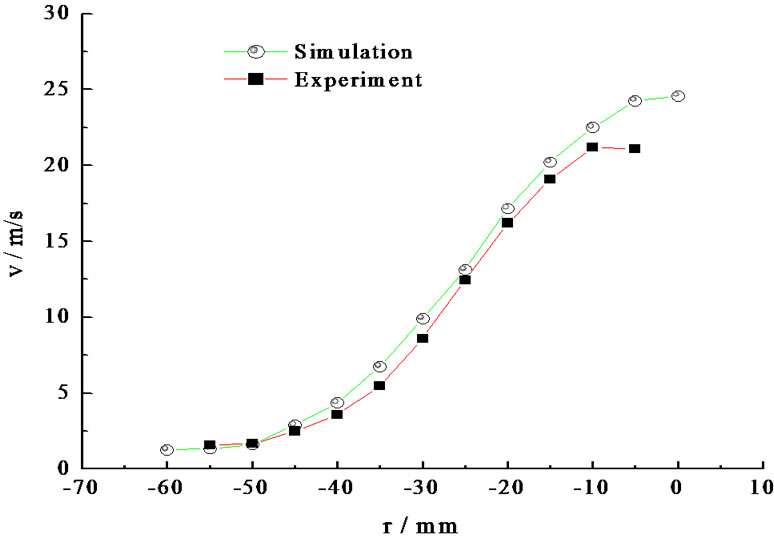 (c)
(c)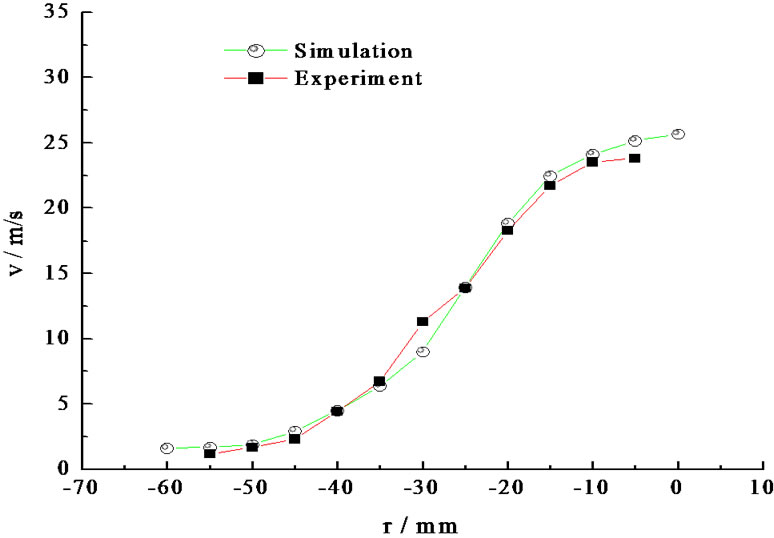 (d)
(d)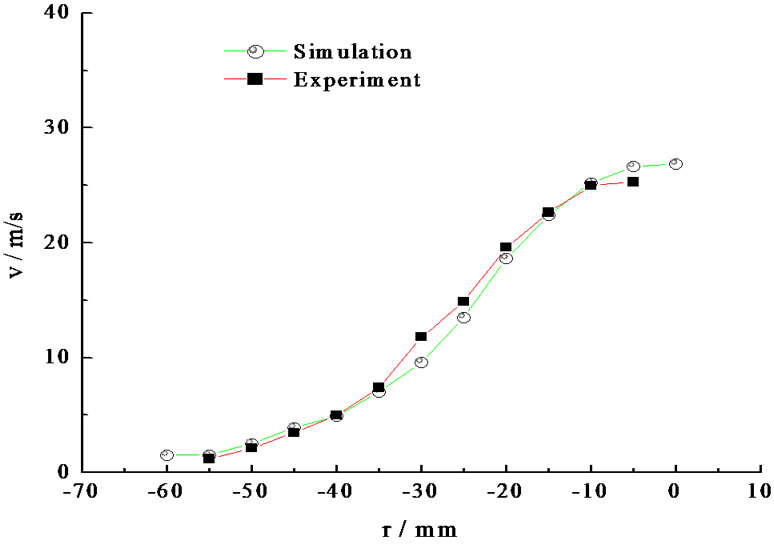 (e)
(e)
Figure 9. Droplet velocity and its distribution in radial direction under different pressures. (a) 1.0 MPa; (b) 2.0 MPa; (c) 3.0 MPa; (d) 3.5 MPa; (e) 4.0 Mpa.
5. Conclusions
In this paper, the atomization character of the swirlpressure nozzle was measured using PDPA in the section of 150 mm below the orifice of the nozzle under different pressures. The atomization character includes the droplet diameter and its distribution, the droplet velocity and its distribution and the spray angle. Meanwhile, the atomization process was simulated using the discrete phase model. Then the simulation data was compared with the experimental data.
The result showed that in the simulation, when the
 (a)
(a)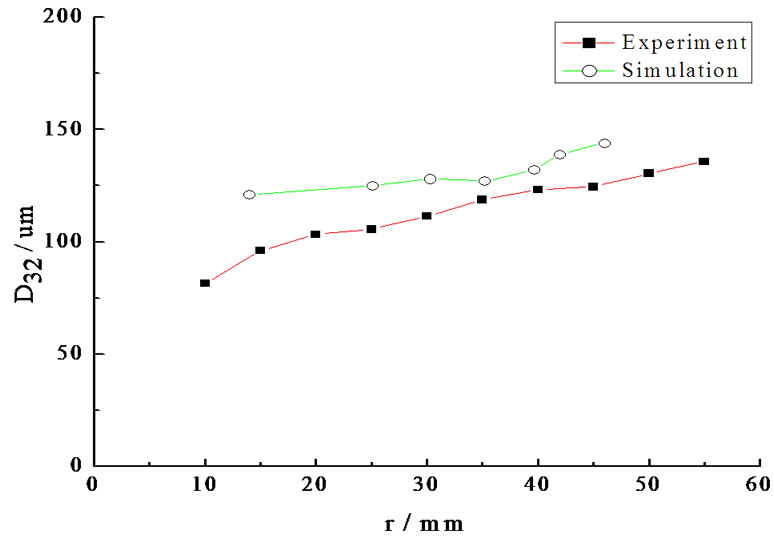 (b)
(b)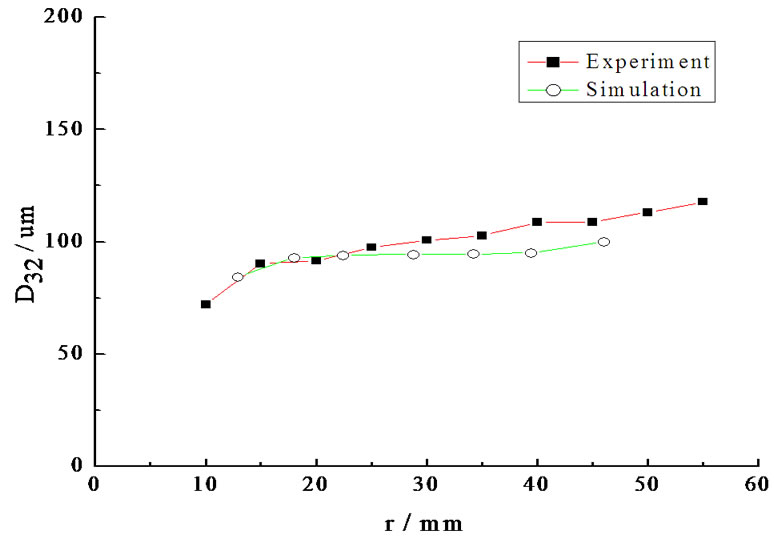 (c)
(c)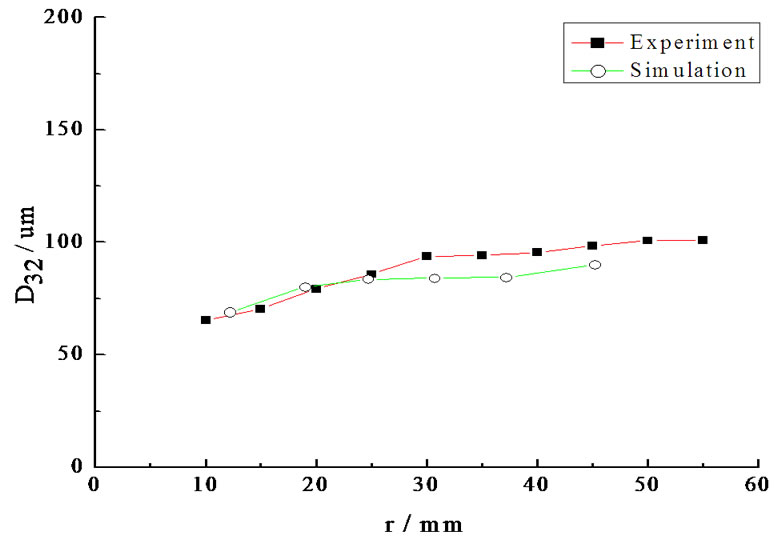 (d)
(d)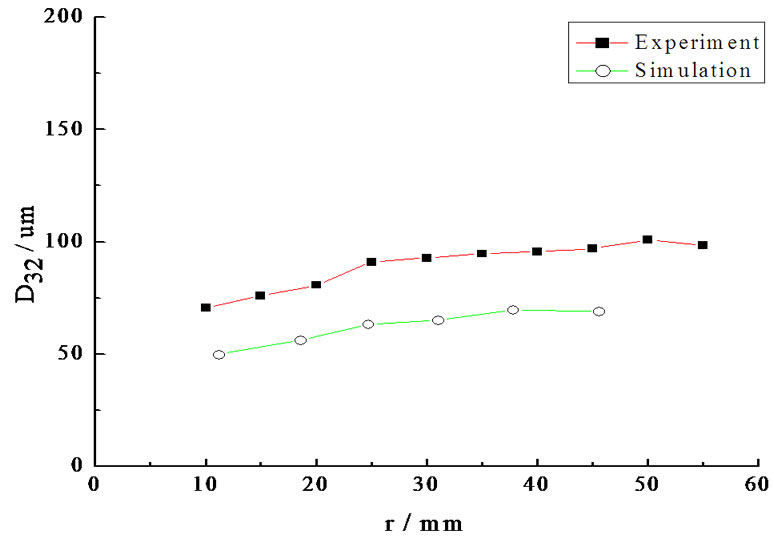 (e)
(e)
Figure 10. Simulation and experimental result of the radial distribution of the droplet diameter. (a) 1.0 MPa; (b) 2.0 MPa; (c) 3.0 MPa; (d) 3.5 MPa; (e) 4.0 Mpa.
pressure is low, there exists an error between the simulation and the experiments which is no more than 24%. When the system pressure is larger than 1 MPa, this error becomes smaller. In the range of 1 MPa to 4 MPa, the atomization can be predicted in the simulation.
As the axial distance increases, the droplet velocity decreases sharply. As the radial distance increases, the droplet diameter becomes bigger and its velocity becomes smaller.
The distribution of droplet diameter in the radial direction satisfies the Rosin-Rammler correlation while the distribution of droplet velocity in the radial direction satisfies the cosine approximately.
REFERENCES
- P. K. Senecal, D. P. Schmidt, I. Nouar, et al., “Modeling High-Speed Viscous Liquid Sheet Atomization,” International Journal of Multiphase Flow, Vol. 25, No. 6-7, 1999, pp. 1073-1097. doi:10.1016/S0301-9322(99)00057-9
- X. D. Wang, L. J. Yang and Q. F. Fu, “New Liquid Electrical Conductance Measurement Method Based on Pulsed Excitation Voltage,” Chinese Journal of Scientific Instrument, Vol. 29, No. 5, 2008, pp. 1088-1091. (in Chinese)
- B. P. Husted, P. Petersson, I. Lund, et al., “Comparison of PIV and PDA Droplet Velocity Measurement Techniques on Two High-Pressure Water Mist Nozzles,” Fire Safety Journal, Vol. 44, No. 8, 2009, pp. 1030-1045. doi:10.1016/j.firesaf.2009.07.003
- B. F. Zuo, D. Black and D. Crocker, “Fuel Atomization and Drop Breakup Models for Advanced Combustion CFD Codes,” 38th AIAA/ASME/SAE/ASEE Joint Propulsion Conference & Exhibit, Indianapolis, 7-10 July 2002, AIAA No. 4175.
- B. Emmanuel, G. Iskender, Z. Stephan and S. Didier, “Modeling of the Break-Up of Liquid Oxygen Droplets for Application in a Cryogenic Rocket Engine Simulation Code,” 38th AIAA/ASME/SAE/ASEE Joint Propulsion Conference & Exhibit, Indianapolis, 7-10 July 2002, AIAA No. 4031.
- A. H. Lefebvre, X. F. Wang and C. A. Martin, “Spray Characteristics of Aerated-Liquid Pressure Atomizers,” Journal of Propulsion and Power, Vol. 4, No. 4, 1988, pp. 293-331.