World Journal of Engineering and Technology
Vol.06 No.02(2018), Article ID:84937,21 pages
10.4236/wjet.2018.62026
Engineering Intelligent Racing Concepts Using Design Research Methods
Trevor Hyman*, Wayne Li
Human-Machine Interaction Lab, School of Industrial Design, College of Design, Georgia Institute of Technology, Atlanta, USA

Copyright © 2018 by authors and Scientific Research Publishing Inc.
This work is licensed under the Creative Commons Attribution International License (CC BY 4.0).
http://creativecommons.org/licenses/by/4.0/


Received: April 5, 2018; Accepted: May 27, 2018; Published: May 30, 2018
ABSTRACT
The automotive seat market is positioned to significantly grow over the next five years. Research into how sensor implementation in every day driver cars can enhance driver wellness is becoming increasingly popular and visible in the automotive seat industry. However, in the competitive race car industry, drivers prioritize driving ability over wellness. To further examine this phenomenon, the Human-Machine Interaction Lab at the Georgia Institute of Technology took a unique approach to developing strong use cases for implementing sensor technology to improve driving ability for race car drivers by combining qualitative and quantitative research data obtained through modern design research and planning methodology. Following a process relying heavily on user-centered design methods, the authors developed a business case concept for a sensor-based seat accessory that acts as a competitive racer’s driving coach that is able to identify the mechanics of braking, turning, and accelerating through pressure sensors in the driver’s seat pan surface. This technology allows drivers to precisely understand when and how hard to brake, turn, or accelerate out of turns, thus reducing heat times and financial burden for drivers.
Keywords:
Design Research, Design Planning, Automotive, Engineering Design, Racing Accessories, Seat Design, Georgia Tech, Industrial Design, HMI Lab

1. Introduction
Between 2017 and 2022, the automotive seat market will experience an on-average Compound Annual Growth rate of 10% [1] . The landscape of users in this market include, but are not limited to, drivers that use vehicles to complete everyday tasks, drivers that use vehicles as their workplace, and drivers that use vehicles to compete in controlled, racing environments. Current research in the automotive seat industry is headlined by ergonomic and wellness planning as the development of autonomous vehicle technology dominates the future of transportation design. With this in mind, the Human-Machine Interaction Lab at the Georgia Institute of Technology decided to study competitive race car drivers in order to understand both their implicit and explicit needs to ultimately assist OEMs and aftermarket manufacturers in designing a novel product that would enhance the racer’s user experience while competing in their vehicle(s). The discovery of needs is a crucial step in the design research and planning process that the HMI uses to reveal gaps in existing solutions and characterize user behavior. Traditional research methods work well in quantifying user’s preferences among existing solution options, but they do little to reveal needs that most people have trouble readily articulating [2] . In order to understand this particular user group’s needs, HMI Lab researchers collaborated with the Sports Car Club of America to attend racing events and observe and interview drivers in a competitive racing environment.
2. Design Research and Planning Methodology
2.1. Investigation of SCCA Solo Autocross Rules
Investigation of SCCA Solo Autocross rules was a critical first step in understanding users. Rules of Autocross dictate vehicle alterations and, consequently, change the driving experience for competitors. Of the six main classes―Street; Street Touring; Street Prepared; Street Modified; Prepared; Modified―over half of the 70,000+ Autocross drivers across the United States compete in the Street and Street Touring classes [3] . Drivers choose to compete in these two classes due to the lowest barrier to entry―Street category rules prohibit virtually all vehicle and seat modifications, affording any interested competitor the ability to compete in the car they drive on a daily basis. Street Touring allows for minor changes, with the most significant being that drivers are allowed to switch their OEM seat out for a racing-specific seat so long as the seat weighs at least 25 pounds.
2.2. Stakeholder Analysis and Characterization
The HMI Lab research team used demographic data collected by the SCCA, qualitative data obtained through interviews with subject matter experts, and SCCA Solo Autocross rules to characterize important stakeholders based on their car design and behavior. These four stakeholders embody the different types of driver that participate in SCCA Solo Autocross competitions. Figure 1 breaks down the demographics for spending and participation behavior for the four stakeholders.
1) Primary Stakeholder: The Stock Seat Driver
The stock seat driver uses his or her own car as both a daily driving and competition vehicle. Street rules prevent this type of driver from making any
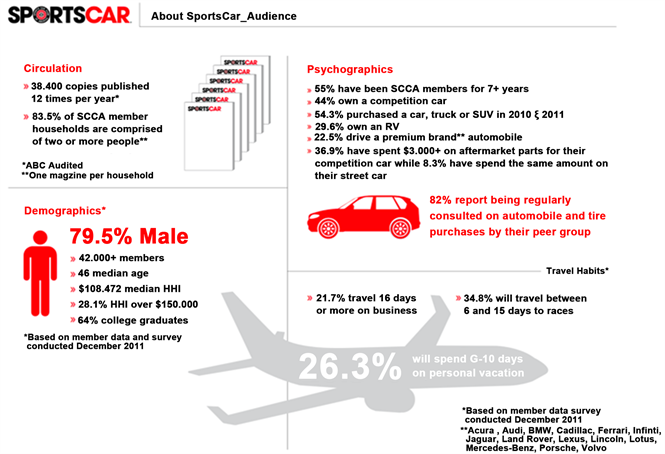
Figure 1. SCCA member survey data [4] .
modifications to his or her vehicle, though multiple drivers may use the same car. This type of driver may bring an extra set of competition tires to swap in and out, however, they are attracted to the low financial commitment necessary to be a competitive driver in this class. Despite there being a low barrier to entry, many Solo competitors have expressed that there are plenty of Street drivers that are overall better drivers than those that compete in the Modified class, for example.
2) Secondary Stakeholder: The Racing Seat Driver
The racing seat driver uses his or her own car as both a daily driving and competition vehicle, he or she minimal changes to the interior of the car, and he or she has permanently switched out the OEM seat in exchange for an aftermarket racing seat. The racing seat driver typically competes in the Street Touring, though he or she is allowed to compete in all racing classes except for Street. Street Touring is the ideal racing class for this persona due to the higher financial commitment required by the higher classes.
3) Tertiary Stakeholder: The Different Seats Driver
The different seat driver is a unique stakeholder, as he or she switches the OEM seat prior to or upon arrival to the Solo competition. This stakeholder has chosen to switch out their seats due to complaints surrounding daily driver comfort and durability regarding racing-specific seats. This stakeholder competes in all racing classes except for Street, and most commonly competes in Street Touring and Street Prepared classes.
4) Quaternary Stakeholder: The Different Cars Driver
The different cars driver tows his or her competition vehicle to the Solo competition via trailer. Modified and Prepared class rules allow for the large number of changes that these stakeholders to their vehicles. The different cars driver spends the most capital on changes vehicle changes―most of these vehicles have very few OEM parts. As a result, this stakeholder not only requires the most financial commitment, but also the most background knowledge of vehicular engineering and design.
2.3. Problem Scenarios and Existing Use Cases
Observational research revealed three potential design directions for the project: 1) Daily driving durability in competitive racing seats; 2) Multiple-Driver interchangeability in racing seats; 3) Visibility and clarity of driving information and advice to improve driving ability.
Design Direction (1) was uncovered through informational interviews with drivers at Solo events. Examining video evidence taken of drivers revealed ergonomic issues surrounding ingress and egress of permanent racing seat installation. These issues resulted in visible wear and tear over the driver’s side bolstering, for those that have had their racing seat for longer than six months. Researchers also took note of severe UV damage along the back bolstering on the side closest to the driver’s door. This bolstering is critical in preventing sliding during rigorous slaloming and turning while driving. A simple design change eliminating or lowering bolstering height would save upholstery damages, however, as mentioned previously, this bolstering is critical in preventing sliding during rigorous slaloming and turning during races. Without this bolstering, many drivers explained that they are forced to brace themselves against their doors and center console to minimize lateral movement. This oftentimes causes intense bruising along legs, leading many to wear kneepads while driving.
Design Direction (2) was uncovered through informational interviews and observations with drivers at Solo events. Solo drivers explained that the gregariousness of SCCA competitions is a main attraction for many interested drivers. SCCA events are run completely by volunteers, and winning races based off of skill as opposed to vehicle performance is highly valued. As a result, many drivers will share their vehicles with drivers they know and trust. This presents a problem for three of the four stakeholders, as racing seats are usually fitted for a specific body height and waist width. For those who are too small to fit in another driver’s racing seat, pillows and blankets are added as supplementary upholstery to prevent the sliding that occurs in most OEM seats.
Design Direction (3) was uncovered through informational interviews and observations with drivers at Solo events. HMI Lab researchers possess little background in competitive racing, and as a result, tried to understand how one improves driving ability. Solo drivers explained that to be skilled, one must beable to drive by “the seat of the pants feel”. The “seat of the pants feel” is driver jargon for one’s driving intuition and ability to naturally respond to feedback from one’s own vehicle, communicated through the driver’s seat pan surface [5] . These natural reactions are the most effective way to navigate unfamiliar Solo tracks; the ability to process information quickly and properly respond instantaneously is a skill that many drivers have expressed can only be developed through “seat time”―driver jargon for the amount of time spent in the driver’s seat competing in Solo events. Very few drivers possess OBD (on-board diagnostic) systems to relate brake and throttle position to specific instances on a course as well as gravitational forces on car suspensions. Additionally, OBD systems are thousands of dollars and are unaffordable for most users that compete in Autocross. For those that do make the financial commitment and purchase this software, many have to take classes or workshops, another large financial commitment, to understand the data that the software is presenting.
These design directions allowed researchers to test which scenario has the largest share of stakeholders through consented survey data presented in Appendix A. Drivers of all skill levels and all Solo classes have the need to improve racing ability, and existing solutions to improving ability are extremely costly for drivers. The typical SCCA member will spend $1971 dollars per year on car improvements and upkeep [4] . Evaluating these stakeholders using quantitative data to verify qualitative research insights confirms that research should continue in Design Direction (3), allowing us to develop stakeholder needs, imperatives and design principles to be outlined in Section 2.4.
2.4. Needs, Imperatives, and Design Principles
Figure 2 illustrates the needs hierarchy that HMI Lab researchers developed to better define imperatives and design principles moving forward. Design imperatives encapsulate user needs while simultaneously guiding feasibility testing and solution ideation that meet all levels of user needs, from high level needs like the need to compete and socialize, to specific, qualifier needs like the need to purchase lots of tires and racing equipment. There is a crucial relationship between money and developing the “seat of the pants feel”; the more money one has, the more events one can attend; the more events one can attend, the more time one spends in the car under race conditions, thus, improving driving ability. Using these important insights, researchers developed three design imperatives to guide testing and ideation. A successful solution incorporates the following:
1) Informs drivers with important driving data.
2) Teaches users to drive with “the seat of the pants feel”.
3) Clarifies driving data into actionable advice.
These design principles suggest that sensor technology within the vehicle could be leveraged to instruct drivers in how to improve race times, similar to how a driving coach would if he or she was sitting in the passenger seat.
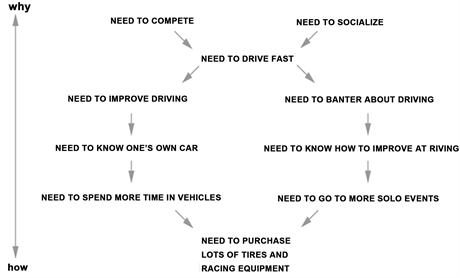
Figure 2. Solo driver needs hierarchy.
3. Testing Methodology and Development
3.1. Low-Fidelity Sensor Development
Researchers built upon code and Tekscan A401 force sensitive resistors developed and purchased, respectively, by mechanical engineering and industrial design students in an undergraduate capstone design course at the Georgia Institute of Technology to understand the forces that act on a driver’s seat pan surface during racing competition. [6] . Building off of existing Arduino code, researchers were able to read in arrays of data values into Excel. Once in Excel, data was transposed from an m × n matrix into an n × m matrix so that each sensor has its own column of data points per time. This facilitates reading in and displaying values as a function of time in Matlab. Code for Arduino and Matlab can be found in Appendices B and C, respectively; the circuit diagram for the Arduino is illustrated in Figure 3.
3.2. Low-Fidelity Sensor Feasibility Testing
The research team hypothesized that pressure sensors could correlate specific driving behavior with leg position and pressure. By applying the sensor array to different places of interest, seat pan surface, seat back, and seat belt, researchers looked to test the following question:
1) Feasibility Question: Can the forces that seat sensors read from our legs while accelerating, braking, and turning be correlated with a simultaneous action being completed by the driver?
Research Scientist, Mr. Trevor Hyman, tested FSR array and Arduino code through multiple “ride along” trials with drivers in multiple classes at the SCCA Southeast Region Test and Tune, February 2018. Figure 4 illustrates the setup Mr. Hyman developed for testing. Protocol for experiment were as follow:
1) Position four sensors in square formation on seat pan surface with one sensor positioned on lower back of driver’s seat.

Figure 3. Arduino and FSR circuit diagram.

Figure 4. Mazda Miata testing setup.
2) Secure laptop and circuit and check for functionality.
3) Buckle seat belt, put on helmet.
4) Begin recording data when car stops at starting line.
5) Stop recording data the moment the car stops moving after completing a run.
6) Save console output data in Excel spreadsheet by copy and pasting.
Figure 5 illustrates the data that was obtained in the first round of testing, using the sensor array shown in Figure 6. The first round data were difficult to develop strong insights from possibly due to the fact that each force sensor is small relative to the area the driver’s leg covers during driving. However, an important data trend suggested that our hypothesis could be correct, as peaks in one sensor were coupled with valleys in another, suggesting that those sensors

Figure 5. Round Two testing data.

Figure 6. Round 2 FSR array setup.
were on opposite legs, signifying a shift in body weight during a turn. In subsequent testing rounds, data was also gathered in a controlled driving environment similar to that of an SCCA event. The primary goal of these testing rounds was to confirm that additional sensor configurations would not yield clearer results. These testing rounds confirmed researchers’ hypothesis that the seat pan surface was the best setup for gathering data that would characterize driving behavior.
3.3. Higher-Fidelity Sensor Testing
The second design iteration utilized a Tekscan Body Pressure Measurement System Pressure mat to characterize driver seat movement across the seat pan surface. Authors expected to see certain areas of the pressure sensor mat activate based off of specific driving behavior or actions. Using these sensors combined with synchronized video data of the course, researchers could confirm that sensors were in-fact reading these movements properly. Figures 7-9, demonstrate different driving actions and the corresponding activation of sensors due to leg movement and pressure.
4. Development of Product Use Case Scenarios
The data confirm the possibility of three use case scenarios for users. Characterizing what a driver is doing based on the activation of different areas on the pressure mat, combined with GPS and video data could potentially be an incredibly valuable tool for drivers. Though our research has not developed into a market-ready product or solution, the HMI Lab’s existing research demonstrate that the needs, market, and technology exist for a racing product that leverages force-sensor based seat technology. The HMI Lab will continue to iterate and test designs that correspond with the following three use case scenarios described in Sections 4.1, 4.2 and 4.3.
4.1. Use Case Scenario 1
By crowd sourcing turning, acceleration, and braking patterns by drivers across the country, or through repetitive characterization of these driving actions, a database of turns can be developed to be referenced by an artificial intelligence platform. Driving advice could potentially be haptic or visual depending on the medium through which information is presented back to the driver.
4.2. Use Case Scenario 2
A database of turns, acceleration and braking patterns are referenced by an AI platform when a driver is performing an action. It compares and contrasts input
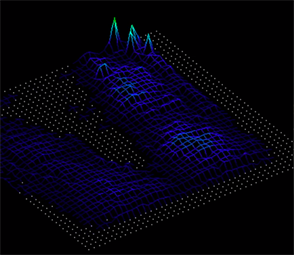
Figure 7. Acceleration.

Figure 8. Right turn, no acceleration.
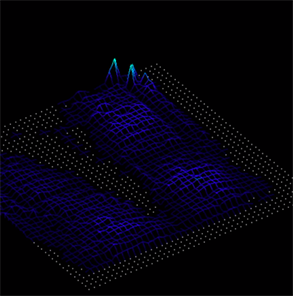
Figure 9. Left turn while accelerating.
data from the previous drive in real time, updating itself based on individual driving habits to determine whether the driver is performing the correct driving action and the precise moment. In this case, some type of digital driving coach or avatar could be created from the AI platform.
4.3. Use Case Scenario 3
Leveraging GPS technology, the driver walks the course they will race on to map out specific turns and obstacles. This GPS data syncs with an accompanying smart phone application and mathematically calculates optimal driving line, ideal braking time(s), ideal accelerating time(s) and instructs the user as to when and with how much pressure he or she should initiate the affiliate action.
5. Conclusion
Though the directions to this project are open ended, there are specific qualities in each use case scenario that align and meet the criteria specified by the aforementioned design principles and imperatives. Drivers need to know how to improve their driving, and a low-cost, technologically-advanced, sensor-based technology that allows them to do so. This technology can additionally be developed to meet the needs of similar user groups, such as those in the Go-kart industry, a primary segue for garnering interest in racing for young adults and children. By informing, teaching, and clarifying driving data, this product aims to give racers a competitive edge.
Acknowledgements
The authors would like to thank the members of the Sports Car Club of America for their generous support of the project, specifically, Tom Gorman, Randall Prince, and Dave Hardy―the SCCA Southeast Region Leadership. Also deserving recognition is Dr. Stephen Sprigle of the REAR Lab at the Georgia Institute of Technology for letting the HMI lab borrow their Tekscan sensors. Finally, the authors would like to thank General Motors and Autodesk through which this research project was partially funded.
Cite this paper
Hyman, T. and Li, W. (2018) Engineering Intelligent Racing Concepts Using Design Research Methods. World Journal of Engineering and Technology, 6, 420-440. https://doi.org/10.4236/wjet.2018.62026
References
- 1. Hiemstra-van Mastrigt, S., Kamp, I., van Veen, S.A.T., Vink, P. and Bosch, T. (2015) The Influence of Active Seating on Passengers’ Perceived Comfort and Activity Levels. Applied Ergonomics, 47, 211-219.
- 2. Patnaik, D. (2017) Create Space Independent Publishing Platform. 4th Edition.
- 3. SCCA. What Is Autocross? Sports Car Club of America. http://www.scca.com/pages/what-is-autocross
- 4. SPORTSCAR Magazine (2014) RACER. SPORTSCAR Magazine Media Kit 2014 Issue. https://advertise.racer.com/sportscar/
- 5. Fuller, R. (2005) Behavioral Research in Road Safety 2005: Fifteenth Seminar. University of Dublin, Department for Transport, London. http://www.bv.transports.gouv.qc.ca/mono/0996518.pdf
- 6. Learnard, D., Nguyen, G., Strauss, A., Zhang, I. and Eberle, M. (2017) Interactive Sensor Based Driver’s Seating Design: General Motors Final Report. School of Industrial Design, Capstone Studio Final Project Report, Georgia Institute of Technology.
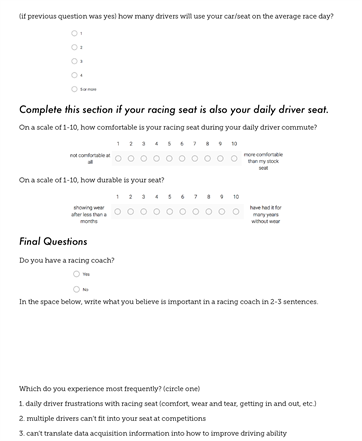
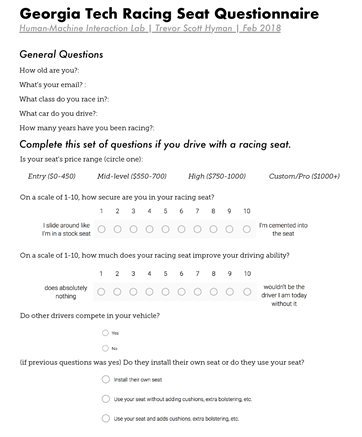
Appendix A: Racing Seat Questionnaire
Appendix B: Arduino Code
/*
* Demo sketch for new "PLX DAQ v2"
* including most all common commands to be used
*
* Working Pressure Sensor
*/
int i = 0;
const int FSR_PIN = A0;
const int FSR_PIN1 = A1;
const int FSR_PIN2 = A2;
const int FSR_PIN3 = A3;
const int FSR_PIN4 = A4;
const float VCC = 4.98;
const float R_DIV = 1000000;
const int sampleSize = 500;
const int IRPin = A5;
void setup() {
// int fsrADC;
// open serial connection
Serial.begin(9600);
pinMode(FSR_PIN, INPUT);
pinMode(FSR_PIN1, INPUT);
pinMode(FSR_PIN2, INPUT);
pinMode(FSR_PIN3, INPUT);
pinMode(FSR_PIN4, INPUT);
pinMode(IRPin, INPUT);
//Serial.println("CLEARDATA"); // clears sheet starting at row 2
Serial.println("CLEARSHEET"); // clears sheet starting at row 1
// define 5 columns named "Date", "Time", "SensorValue"
// Serial.println("LABEL,Date,Time,SensorValue");
Serial.println("LABEL,Value Number,Timer(s),PS0(lbf),PS1(lbf),PS2(lbf),PS3(lbf),PS4(lbf),Proximity(in)");
// set the names for the 3 checkboxes
Serial.println("CUSTOMBOX1,LABEL,Stop logging at 100?");
// Serial.println("CUSTOMBOX2,LABEL,Resume log at 350?");
// Serial.println("CUSTOMBOX3,LABEL,Quit at 450?");
// check 2 of the 3 checkboxes (first two to true, third to false)
Serial.println("CUSTOMBOX1,SET,1");
// Serial.println("CUSTOMBOX2,SET,0");
// Serial.println("CUSTOMBOX3,SET,0");
}
void loop() {
// simple print out of number and millis. Output e.g.,: "DATA,DATE,TIME,TIMER,4711,13374,AUTOSCROLL_20"
// Serial.println( (String) "DATA,DATE,TIME,TIMER," + i++ + "," + millis() + ",AUTOSCROLL_20" );// alternative writing method:
/* Serial.print("DATA,DATE,TIME,TIMER,");
Serial.print(i++); Serial.print(",");
Serial.println(millis());
Serial.print(","); Serial.println("SCROLLDATA_20"); */
float dataArray[5]; //create an array of all 5 data points for each second
int fsrADC = analogRead(FSR_PIN);
float force;
int fsrADC1 = analogRead(FSR_PIN1);
float force1;
int fsrADC2 = analogRead(FSR_PIN2);
float force2;
int fsrADC3 = analogRead(FSR_PIN3);
float force3;
int fsrADC4 = analogRead(FSR_PIN4);
float force4;
int Proximity;
// If the FSR has no pressure, the resistance will be
// near infinite. So the voltage should be near 0.
float IRvolts = analogRead(IRPin)*.0048828125;
Proximity = 10*pow(IRvolts,-1);
//distance = analogRead(IRPin)*5;
delay(1000); //displays data every 1/10 of a second
Serial.println();
//////PS0
if (fsrADC != 0) // If the analog reading is non-zero
{
// Use ADC reading to calculate voltage:
float fsrV = fsrADC * VCC / 1023.0;
// Use voltage and static resistor value to
// calculate FSR resistance:
float fsrR = R_DIV * (VCC / fsrV - 1.0);
// Serial.println("Resistance: " + String(fsrR) + " ohms");
// Guesstimate force based on slopes in figure 3 of
// FSR datasheet:
float fsrG = 1.0 / fsrR; // Calculate conductance
// Break parabolic curve down into two linear slopes:
if (fsrR <= 600)
force = (fsrG - 0.00075) / 0.0000000168;
//force = (fsrG - 0.00075) / 0.00000032639;
else
force = fsrG / 0.0000000328;
//force = fsrG / 0.000000642857;
// Serial.println("Force: " + String(force) + " g");
// Serial.println();
/////////////////
//delay(500);
}
else
{
// No pressure detected
}
//////PS1
if (fsrADC1 != 0) // If the analog reading is non-zero
{
float fsrV1 = fsrADC1 * VCC / 1023.0;
// Use voltage and static resistor value to
// calculate FSR resistance:
float fsrR1 = R_DIV * (VCC / fsrV1 - 1.0);
// Serial.println("Resistance: " + String(fsrR) + " ohms");
// Guesstimate force based on slopes in figure 3 of
// FSR datasheet:
float fsrG1 = 1.0 / fsrR1; // Calculate conductance
// Break parabolic curve down into two linear slopes:
if (fsrR1 <= 600)
force1 = (fsrG1 - 0.00075) / 0.0000000168;
//force1 = (fsrG1 - 0.00075) / 0.00000032639;
//force1 = (fsrG1 - 0.00075) / 0.00000032639;
else
force1 = fsrG1 / 0.0000000328;
//force1 = fsrG1 / 0.000000642857;
// Serial.println("Force: " + String(force) + " g");
// Serial.println();
//delay(500);
}
else
{
// No pressure detected
}
//////PS2
if (fsrADC2 != 0) // If the analog reading is non-zero
{
float fsrV2 = fsrADC2 * VCC / 1023.0;
// Use voltage and static resistor value to
// calculate FSR resistance:
float fsrR2 = R_DIV * (VCC / fsrV2 - 1.0);
// Serial.println("Resistance: " + String(fsrR) + " ohms");
// Guesstimate force based on slopes in figure 3 of
// FSR datasheet:
float fsrG2 = 1.0 / fsrR2; // Calculate conductance
// Break parabolic curve down into two linear slopes:
if (fsrR2 <= 600)
force2 = (fsrG2 - 0.00075) / 0.0000000168;
//force2 = (fsrG2 - 0.00075) / 0.00000032639;
//force2 = (fsrG2 - 0.00075) / 0.00000032639;
else
force2 = fsrG2 / 0.0000000328;
//force2 = fsrG2 / 0.00000075;
//force2 = fsrG2 / 0.000000642857;
// Serial.println("Force: " + String(force) + " g");
// Serial.println();
//delay(500);
}
else
{
// No pressure detected
}
//////PS3
if (fsrADC3 != 0) // If the analog reading is non-zero
{
float fsrV3 = fsrADC3 * VCC / 1023.0;
// Use voltage and static resistor value to
// calculate FSR resistance:
float fsrR3 = R_DIV * (VCC / fsrV3 - 1.0);
// Serial.println("Resistance: " + String(fsrR) + " ohms");
// Guesstimate force based on slopes in figure 3 of
// FSR datasheet:
float fsrG3 = 1.0 / fsrR3; // Calculate conductance
// Break parabolic curve down into two linear slopes:
if (fsrR3 <= 600)
force3 = (fsrG3 - 0.00075) / 0.0000000168;
//force3 = (fsrG3 - 0.00075) / 0.00000032639;
//force3 = (fsrG3 - 0.00075) / 0.00000032639;
else
force3 = fsrG3 / 0.0000000328;
//force3 = fsrG3 / 0.00000075;
//force3 = fsrG3 / 0.000000642857;
// Serial.println("Force: " + String(force) + " g");
// Serial.println();
//delay(500);
}
else
{
// No pressure detected
}
//////PS4
if (fsrADC4 != 0) // If the analog reading is non-zero
{
float fsrV4 = fsrADC4 * VCC / 1023.0;
// Use voltage and static resistor value to
// calculate FSR resistance:
float fsrR4 = R_DIV * (VCC / fsrV4 - 1.0);
// Serial.println("Resistance: " + String(fsrR) + " ohms");
// Guesstimate force based on slopes in figure 3 of
// FSR datasheet:
float fsrG4 = 1.0 / fsrR4; // Calculate conductance
// Break parabolic curve down into two linear slopes:
if (fsrR4 <= 600)
force4 = (fsrG4 - 0.00075) / 0.0000000168;
//force3 = (fsrG3 - 0.00075) / 0.00000032639;
//force3 = (fsrG3 - 0.00075) / 0.00000032639;
else
force4 = fsrG4 / 0.0000000328;
//force3 = fsrG3 / 0.00000075;
//force3 = fsrG3 / 0.000000642857;
// Serial.println("Force: " + String(force) + " g");
// Serial.println();
//delay(500);
}
else
{
// No pressure detected
}
dataArray[0] = force;
dataArray[1] = force1;
dataArray[2] = force2;
dataArray[3] = force3;
dataArray[4] = force4;
for (int j = 0; j < 5; j = j + 1) {
Serial.println(dataArray[j]);
}
// Serial.println( (String) "DATA," + i++ + "," + millis()/1000 + ", " + force + ", " + force1 + ", " + force2 + ", " + force3 + ", " + force4 + "," + Proximity + ", AUTOSCROLL_20" );
// Serial.println( (String) "DATA," + i++ + "," + millis()/1000 + ", " + force + ", " + force1 + ", " + force2 + ", " + force3 + ", " + force4 + ", AUTOSCROLL_20");
//Serial.println( (String) force + " " + force1 + " " + force2 + " " + force3 + " " + force4);
// Serial.print("SENSORVALUE,");
//// Serial.print(i++);
//// Serial.print(",");
//// Serial.print(millis());
//// Serial.print(",");
// Serial.print(force);
// Serial.print(",");
// Serial.println("SCROLLDATA_20");
// clear some cells in Excel (rectangle range from B10 to D20)
// if(i==100)
// Serial.println("ClearRange,B,10,D,20");
//
// // do a simple beep in Excel on PC
// if(i==150)
// Serial.println("BEEP");
// read a value (in this case integer) from Excel (from a sheet by name)
// if(i==200)
// {
// Serial.println("CELL,GET,FROMSHEET,Simple Data,E,4"); // ==> request value from sheet
// // Serial.println("CELL,GET,E4"); ==> short version to read from active sheet in Excel
// int readvalue = Serial.readStringUntil(10).toInt(); // get response. Note: the '10' is important! Always use but never change ;-)
// Serial.println( (String) "Value of cell E4 is: " + readvalue); // result displayed in Excel DirectDebugWindow to double check
// }
// check value of custombox1 on PLX DAQ in Excel and if
// checkbox is checked then send the command to pause logging
/* if(i==sampleSize)
{
Serial.println("CUSTOMBOX1,GET");
int stoplogging = Serial.readStringUntil(10).toInt();
// this information can be seen in the direct debug window on PLX DAQ in Excel
Serial.println( (String) "Value of stoplogging/checkbox is: " + stoplogging);
if(stoplogging)
Serial.println("PAUSELOGGING");
}
*/
// get a true random number from the computer
// if(i==300)
// {
// Serial.println("GETRANDOM,-4321,12345"); // between -4321 to 12345
// int rndseed = Serial.readStringUntil(10).toInt();
// Serial.println( (String) "Got random value '" + rndseed + "' from Excel" );
// // Note: this information is not posted to the Excel sheet because "DATA" is missing
// // instead this information can be seen in the direct debug window
// }
// and now resume logging
// if(i==350)
// {
// Serial.println("CUSTOMBOX2,GET");
// int resumelogging = Serial.readStringUntil(10).toInt();
// if(resumelogging)
// Serial.println("RESUMELOGGING");
// }
// post to specific cells on default sheet as well as named sheet
// if(i==400)
// {
// Serial.println("CELL,SET,G10,400 test 1 string"); // default sheet active in PLX DAQ Excel
// Serial.println("CELL,SET,ONSHEET,Simple Data,G,11,400 test 2 string"); // named sheet available in PLX DAQ Excel
// }
// and for forced quit of Excel with saving the file first
// if(i==450)
// {
// Serial.println("CUSTOMBOX3,GET");
// if(Serial.readStringUntil(10).toInt()) {
// Serial.println("SAVEWORKBOOKAS,450-Lines-File");
// Serial.println("FORCEEXCELQUIT");
// }
// else
// Serial.println("No forced Excel quit requested!");
// }
}
Appendix C: Matlab Code
clc
clear all
%this code reads in values from a specified excel data sheet containing
%code for A401 Pressure Sensors and displays the pressure data for each
%sensor as a function of time (1/5 of a second―there are five data points
%for each second).
%define variables for reading in values
datafilename = 'example_data.xlsx';
sensor0data = 'B1:B37';
sensor1data = 'C1:C37';
sensor2data = 'D1:D37';
sensor3data = 'E1:E37';
sensor4data = 'F1:F37';
seconds = 'J1:J37';
sheet1 = 1;
%/ read in the values from xls files
readseatsensor0 = xlsread(datafilename, sheet1, sensor0data);
readseatsensor1 = xlsread(datafilename, sheet1, sensor1data);
readseatsensor2 = xlsread(datafilename, sheet1, sensor2data);
readseatsensor3 = xlsread(datafilename, sheet1, sensor3data);
readseatsensor4 = xlsread(datafilename, sheet1, sensor4data);
readtime = xlsread(datafilename, sheet1, seconds);
%plot seat sensor data as a function of time. 'hold on' command allows
%multiple plots to be shown on the same figure.
figure
plot(readtime, readseatsensor0);
hold on
plot(readtime, readseatsensor1);
hold on
plot(readtime, readseatsensor2);
hold on
plot(readtime, readseatsensor3);
hold on
plot(readtime, readseatsensor4);
legend('Right Rear Sensor', 'Left Rear Sensor', 'Right Front Sensor', 'Left Front Sensor', 'Back Sensor')
xlabel('seconds');
ylabel('force in gs');
hold off