Open Journal of Psychiatry
Vol.2 No.4A(2012), Article ID:25112,9 pages DOI:10.4236/ojpsych.2012.224058
Changes in weight and metabolic parameters following long-term iloperidone use: A meta-analysis of data from 9 Phase II and III trials of iloperidone*
![]()
Novartis Pharmaceuticals Corporation, East Hanover, USA
Email: marla.hochfeld@novartis.com
Received 10 September 2012; revised 9 October 2012; accepted 18 October 2012
Keywords: Dyslipidemia; Glucose; Iloperidone; Long-Term; Metabolic; Weight
ABSTRACT
Objective: To determine the impact of iloperidone treatment on metabolic parameters. Methods: Data were analyzed from 3210 patients who received iloperidone and 587 patients who received placebo for up to 2 years during 9 Phase II and Phase III studies (integrated safety database). Patients were pooled by most frequent iloperidone dose into 3 groups: 4 - 8 mg/d, 10 - 16 mg/d, and 20 - 24 mg/d. Laboratory data from 8 studies were random (fasting and nonfasting) while patients from 1 study (n = 447) were all sampled at fasting. Results: Mean (standard deviation [SD]) weight gain from baseline to endpoint was 2.1 (6.8) kg for all patients on iloperidone. Fasting mean (SD) total cholesterol changes from baseline to end of study were 8.2 (31.6) for iloperidone and −2.2 (35.2) mg/dL for placebo. Fasting mean (SD) triglyceride changes during this period were iloperidone: −0.83 (82.3); placebo: 16.5 (113.1) mg/dL. Fasting mean (SD) glucose changes were iloperidone: 6.6 (24.0); placebo: −0.05 (17.0) mg/dL from baseline to end of study. Glycosylated hemoglobin levels were unchanged following iloperidone treatment. Conclusion: These data suggest a metabolic profile for iloperidone of modest weight gain accompanied by small changes in lipids and glucose that are unlikely to be of clinical concern.
1. INTRODUCTION
Patients with schizophrenia have a higher rate of obesity and cardiovascular disease compared with the general population [1,2], and these co-morbidities may contribute to these patients’ greater overall risk of sudden death [3,4]. In addition to the genetic and lifestyle factors that can predispose patients with schizophrenia to disease, some antipsychotic medications are associated with weight gain and changes in glucose and lipids [5-7]. Each antipsychotic drug has a different metabolic profile, in part because of their unique receptor-binding patterns [8]. Monitoring patients’ metabolic profile during antipsychotic drug use is therefore an important part of patient risk-management for the clinician, and the weight, glucose, and lipid profiles associated with specific antipsychotic agents should, among other factors, be taken into account when choosing agents [9].
Iloperidone is a mixed D2/5-HT2A antagonist atypical antipsychotic for the treatment of schizophrenia in adults. In this report, we describe changes in weight and other metabolic parameters associated with iloperidone treatment using data from the integrated safety database of over 3200 patients who received iloperidone.
2. METHODS
The full integrated safety database includes all adult patients enrolled in 9 clinical studies who received at least 1 dose of study drug––3210 patients were exposed to iloperidone during any phase of the studies (Tables 1 and 2) and the detailed methods and enrollment criteria for each study have been previously published in a series of articles [10-13]. A total of 1344 patients were exposed to iloperidone during the double-blind phase of 4 randomized, placebo-controlled studies (Studies 3000, 3004, 3005, and 3101); 281 patients were exposed to iloperidone during a long-term, active-control phase and/or an open-label extension phase of these studies; and 1585 patients were exposed to iloperidone during 5 active-controlled studies (Studies 2001, 2328, 3001, 3002, and 3003). Patients with a Diagnostic and Statistical Manual, 4th Edition (DSM-IV) [14] diagnosis of schizophrenia or schizoaffective disorder were exposed to iloperidone for up to 2 years. Patients were pooled according to their modal (most frequent) dose into 3 groups for analysis: iloperidone 4 - 8 mg/d, 10 - 16 mg/d, and 20 -

Table 1. Clinical studies included in the integrated summary of safety.

Table 2. Patients exposed to iloperidone.
24 mg/d. Patients were weighed and blood samples were obtained at baseline and periodically at study visits; standard laboratory chemistry was performed at prespecified intervals. In one of the 9 studies (Study 3101), blood samples were obtained at fasting, whereas other study protocols did not require that blood samples be obtained under fasting conditions. In all studies, changes in weight and laboratory parameters from baseline to various time points were summarized by iloperidone dose. In addition, in Study 3101, the number and percentage of patients transitioning from normal to high or low mean fasting lipid and glucose levels was determined.
3. RESULTS
Baseline characteristics for patients in the 9 studies are shown in Table 3.
3.1. Weight Change
Across all studies from baseline to endpoint, the overall mean (standard deviation [SD]) weight change was 2.1 (6.8) kg (n = 3075). In the 4 short-term, placebo-controlled studies, mean (SD) weight changes from baseline were 1.4 (3.8) kg, 2.0 (3.8) kg, and 2.7 (3.6) kg for patients receiving iloperidone 4 - 8 mg/d (n = 455), iloperidone 10 - 16 mg/d (n = 481), and iloperidone 20 - 24 mg/d (n = 391), respectively, and −0.1 (2.9) kg (n = 576) for those receiving placebo. A gain of ≥7% of body weight during the placebo-controlled studies was reported in 11% of patients on iloperidone 4 - 8 mg/d, 12%
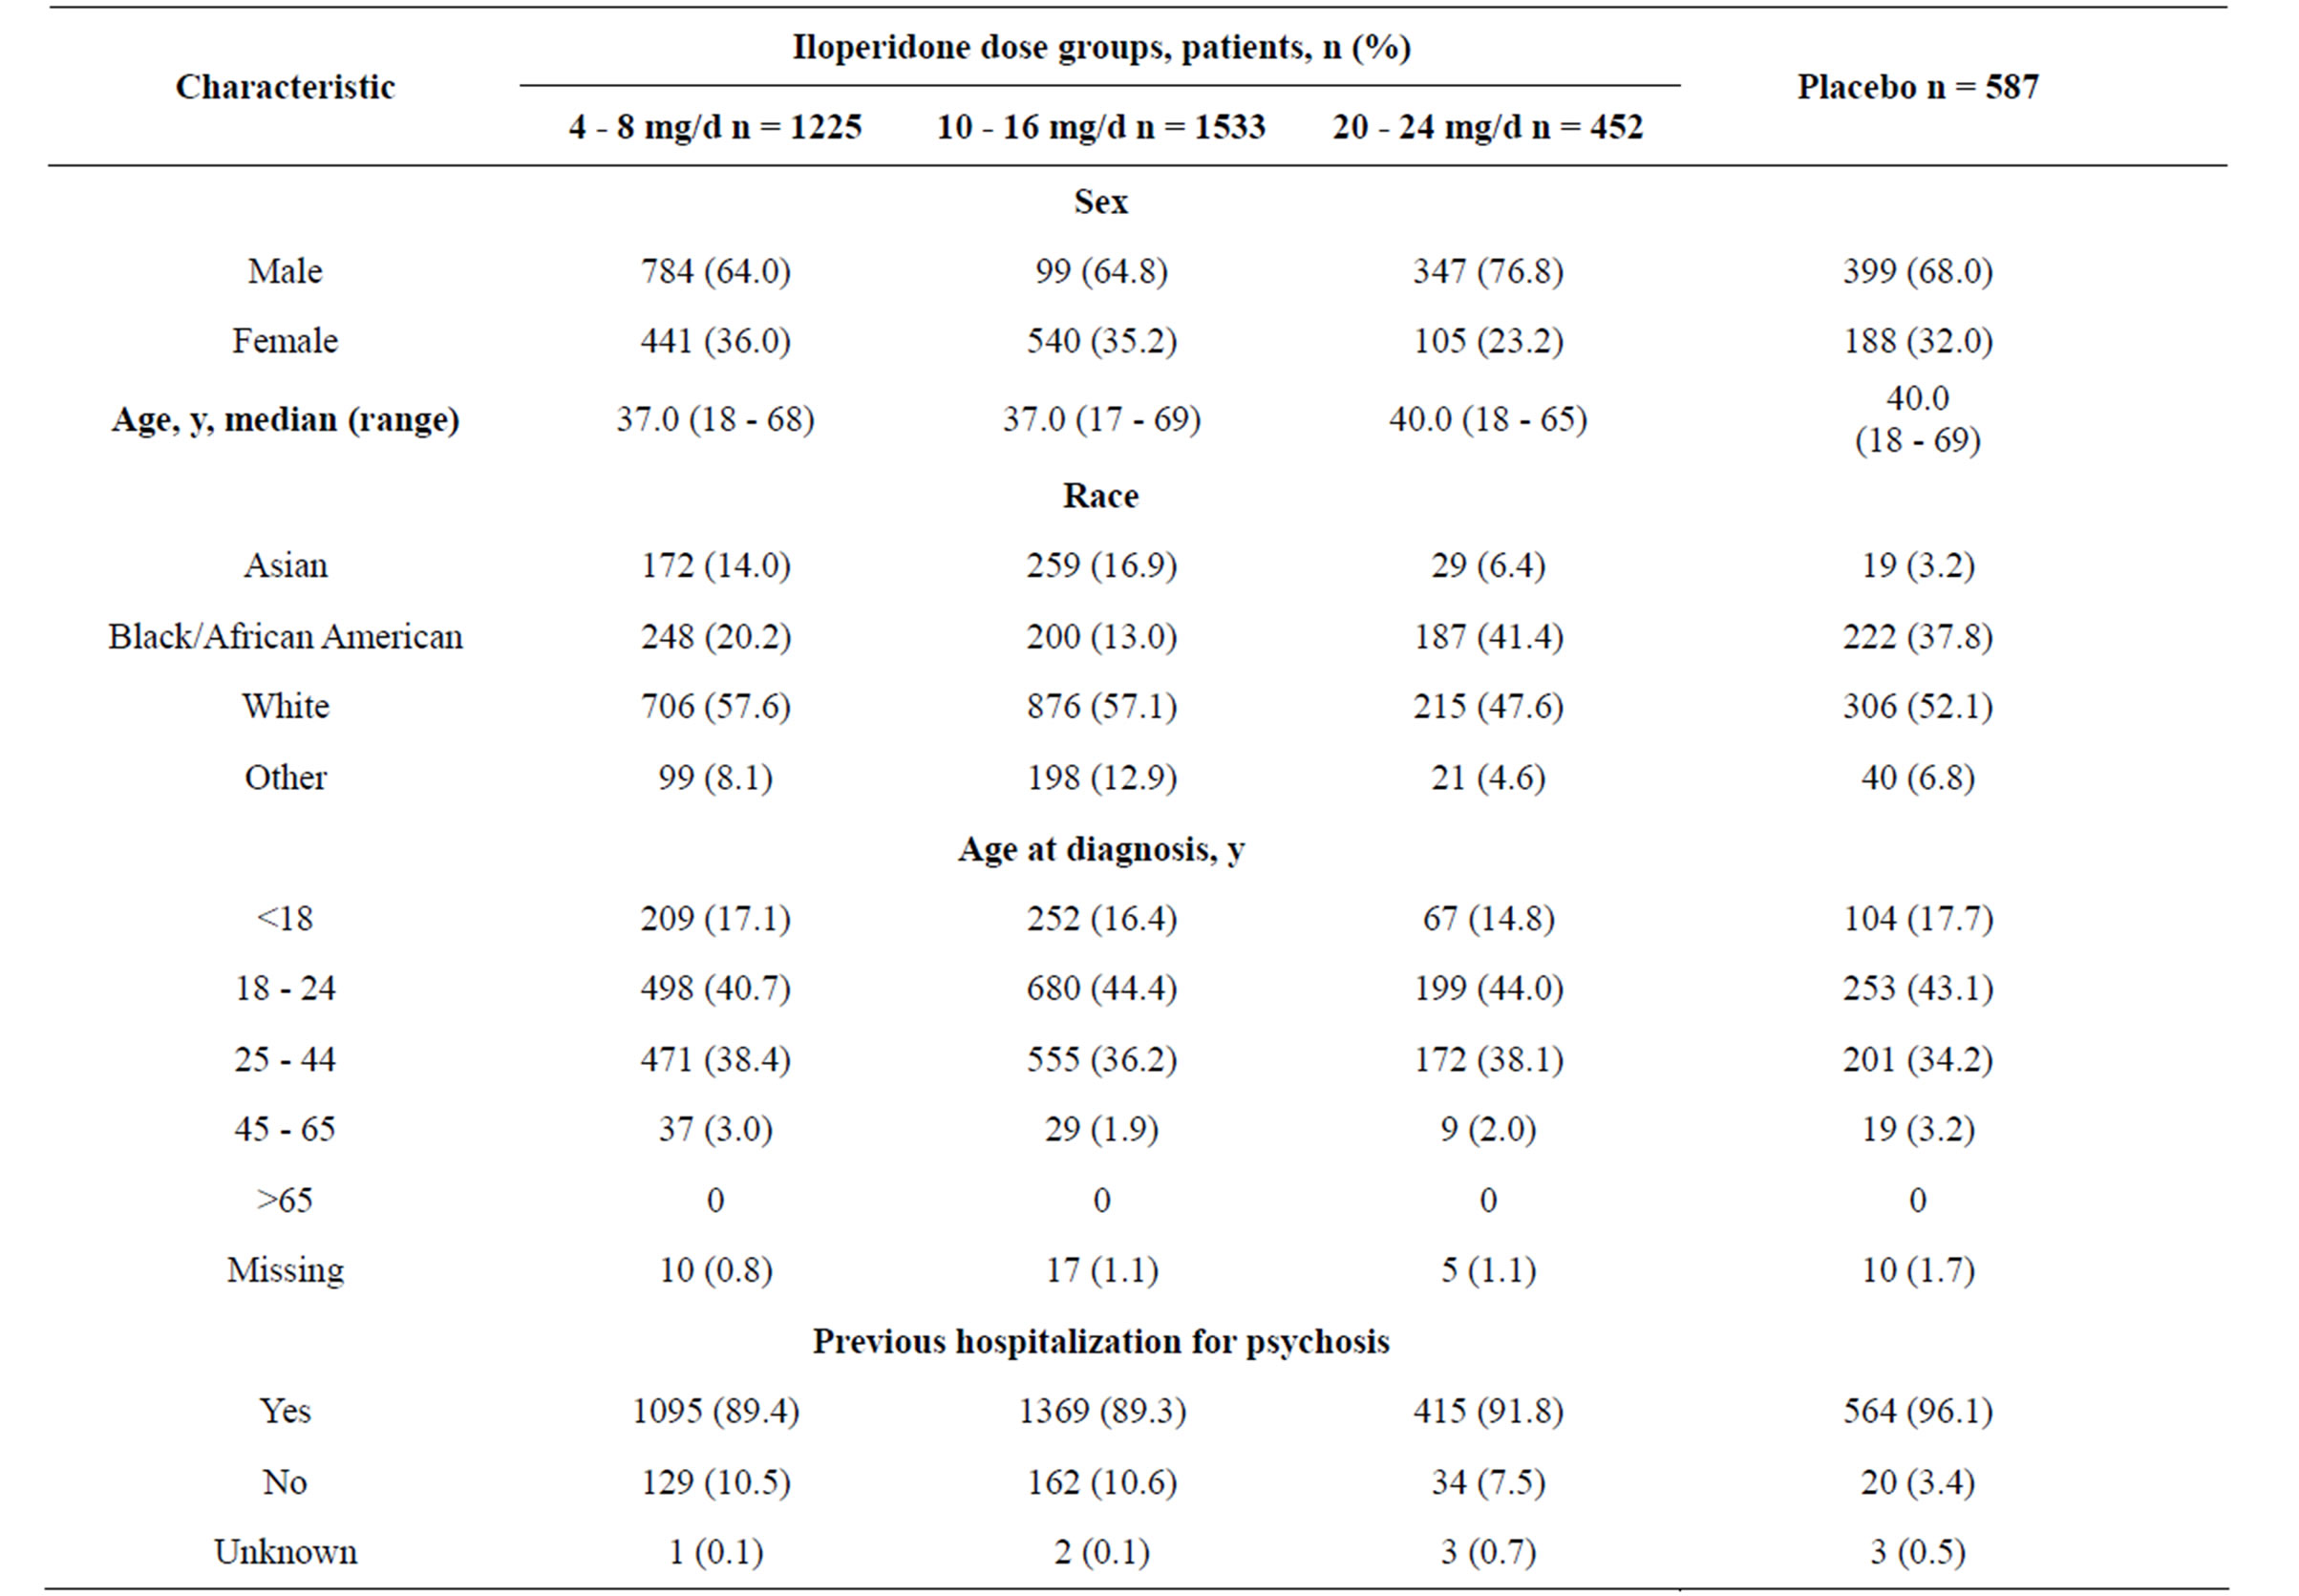
Table 3. Demographics and baseline characteristics of patients included in the integrated summary of safety.
on 10 - 16 mg/d, and 18% on 20 - 24 mg/d (an overall mean of 14% of patients in the combined iloperidone dose groups) versus 4% of patients on placebo.
After 3 - 6 months of treatment, iloperidone in all studies was associated with a mean (SD) weight change from baseline of 2.8 (6.4) kg for the 4 - 8 mg/d dose group (n = 495), 3.0 (6.2) kg with 10 - 16 mg/d (n = 850), and 2.8 (7.2) kg with 20 - 24 mg/d (n = 33). From baseline to 6 - 12 months, weight changes were 3.1 (8.9) kg (n = 394), 3.4 (8.4) kg (n = 725), and 1.8 (9.6) kg (n = 31) for the 3 respective dose groups. From baseline to greater than 1 year of treatment, weight changes were 3.2 (10.4) kg (n = 231), 3.0 (9.3) kg (n = 425), and 1.5 (10.0) kg (n = 20) for these 3 respective dose groups.
3.2. Lipid Level Changes
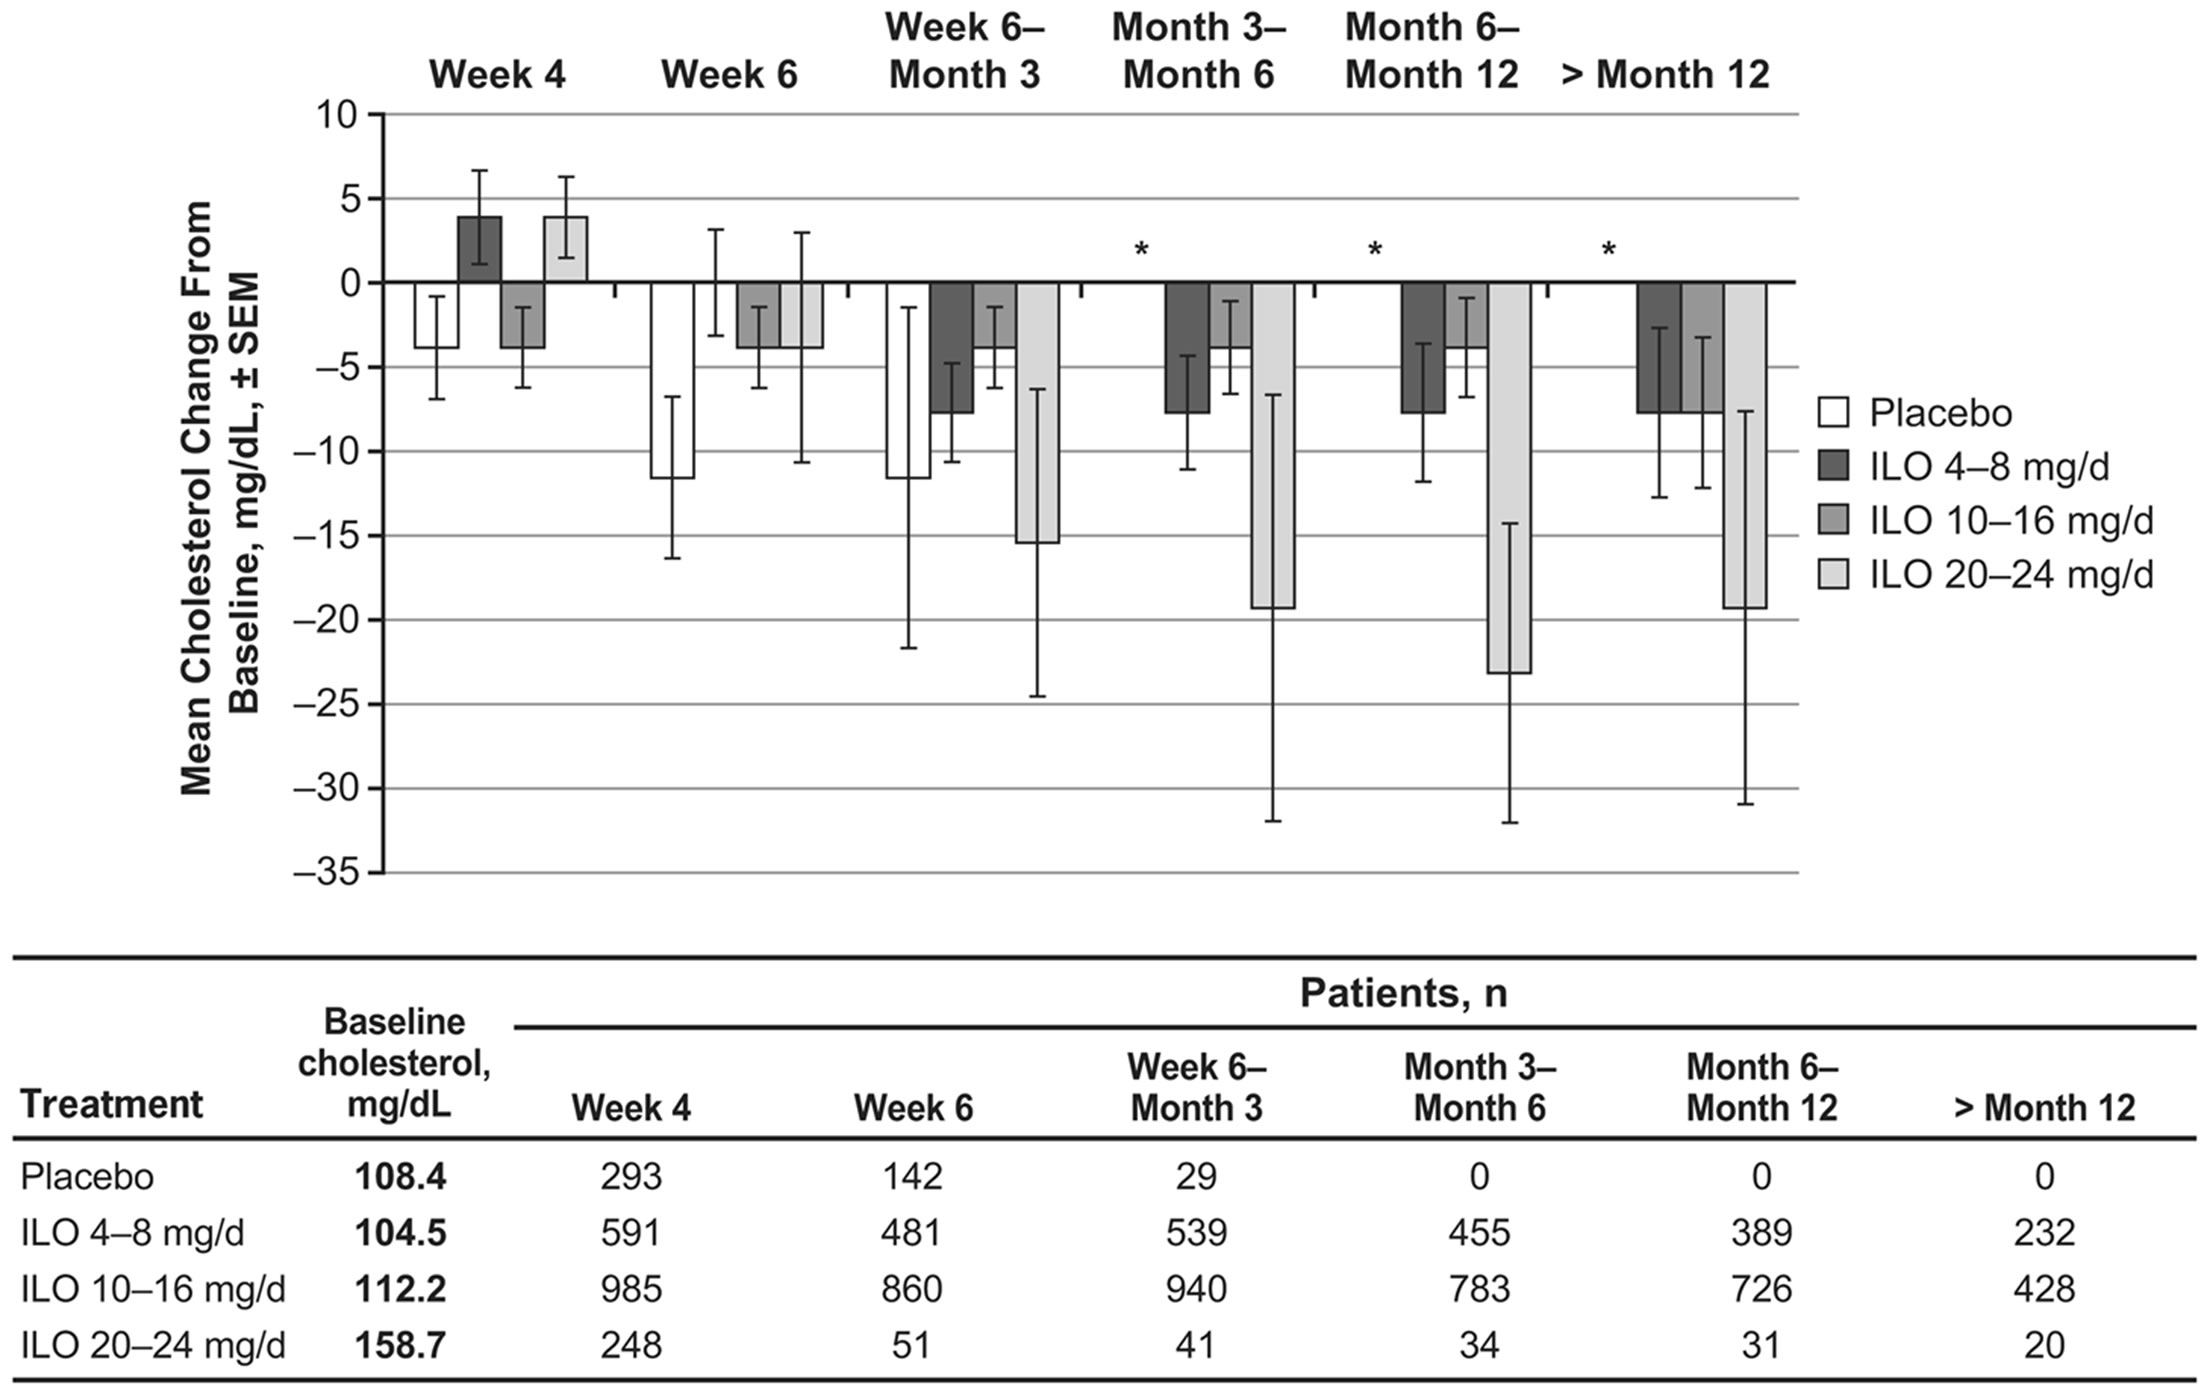
During the first 4 weeks of the studies, mean cholesterol levels increased slightly from baseline (by less than 5 mg/dL) in the iloperidone 4 - 8 mg/d and 20 - 24 mg/d dose groups; however, at time points after Week 4, cholesterol levels were unchanged or decreased from baseline levels for all iloperidone dose groups (Figure 1(a)).
During the first 3 months of the studies (for which period placebo measurements were available), mean cholesterol changes from baseline were generally similar between iloperidone and placebo (−7.7 to 0.0 mg/dL for the combined iloperidone groups and −11.6 to −3.9 mg/dL for placebo). Mean triglycerides in the placebo group decreased from baseline between 17.7 and 70.9 mg/dL (Figure 1(b)). Mean triglyceride levels also decreased from baseline to all time points following iloperidone administration (−8.9 to −17.7 mg/dL for the combined iloperidone groups), and these changes were not dose dependent (Figure 1(b)).
In addition, fasting lipid levels were examined separately: these were available only for patients in the 4-week double-blind Study 3101 who received iloperidone 24 mg/d. Low-density lipoprotein (LDL) and high-density lipoprotein (HDL) cholesterol levels were also measured in this study. Among patients receiving placebo in Study 3101, mean fasting total, LDL and HDL cholesterol levels were slightly decreased from baseline to end of study (2.2, 1.4 and 3.4 mg/dL, respectively), while mean triglyceride levels increased 16.5 mg/dL
 (a)
(a)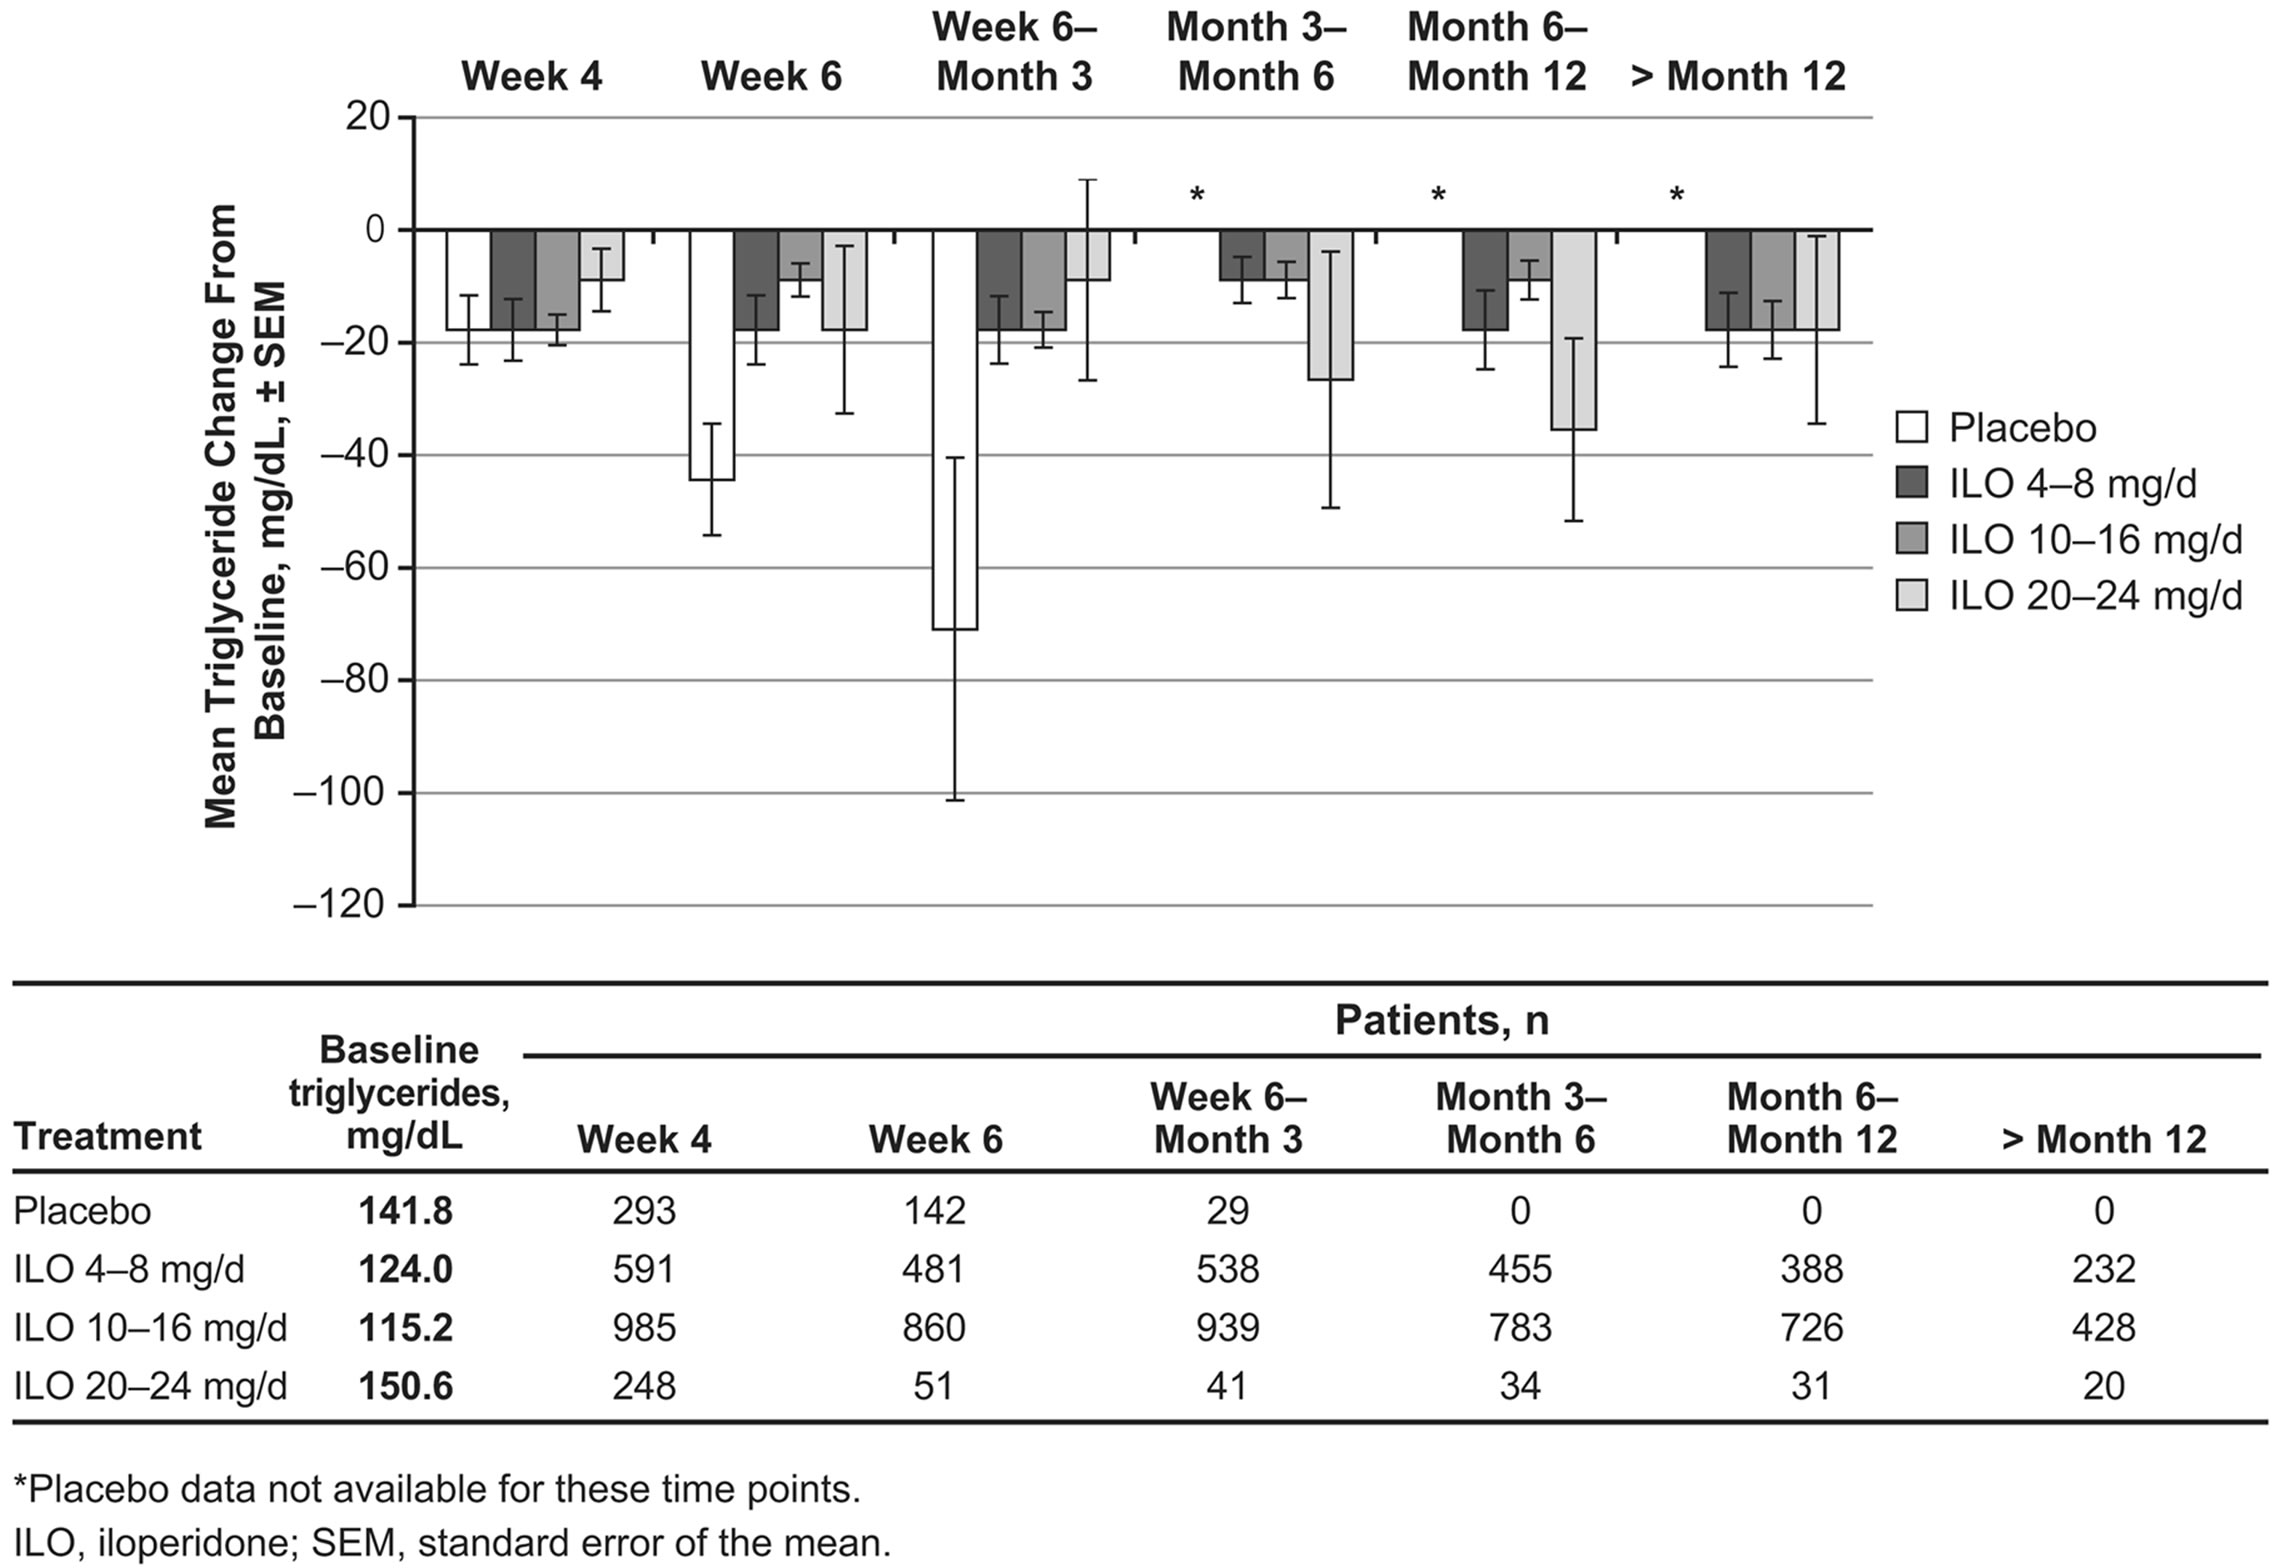 (b)
(b)
Figure 1. Mean changes following iloperidone treatment in (a) cholesterol and (b) triglyceride levels from 9 pooled clinical trials.
(Figure 2). Among iloperidone recipients, fasting mean cholesterol and triglyceride level changes from baseline to end of study (8.2 mg/dL and −0.83 mg/dL, respectively) showed trends similar to those reported from baseline to Week 4 in fasting and nonfasting patients who received iloperidone 20 - 24 mg/d in all 9 studies (3.9 mg/dL and −8.9 mg/dL, respectively; Figures 1(a) and (b)). Mean LDL cholesterol levels increased from baseline to endpoint by 9.0 mg/dL, while mean HDL cholesterol levels increased by 0.55 mg/dL (Figure 2). An analysis of patients who shifted during the study from normal to high total cholesterol, LDL cholesterol, or triglyceride levels, or from normal to low HDL cholesterol levels, was also performed (Table 4). The percentage of patients with a shift in total cholesterol levels was greater with iloperidone than with placebo but remained below 4%. About half as many patients experienced shifts in mean LDL and HDL cholesterol levels with iloperidone treatment compared with placebo treatment, while similar percentages of patients given iloperidone and placebo had an increase in triglyceride levels (Table 4).

Figure 2. Endpoint changes in fasting mean glucose and lipid levels in Study 3101.
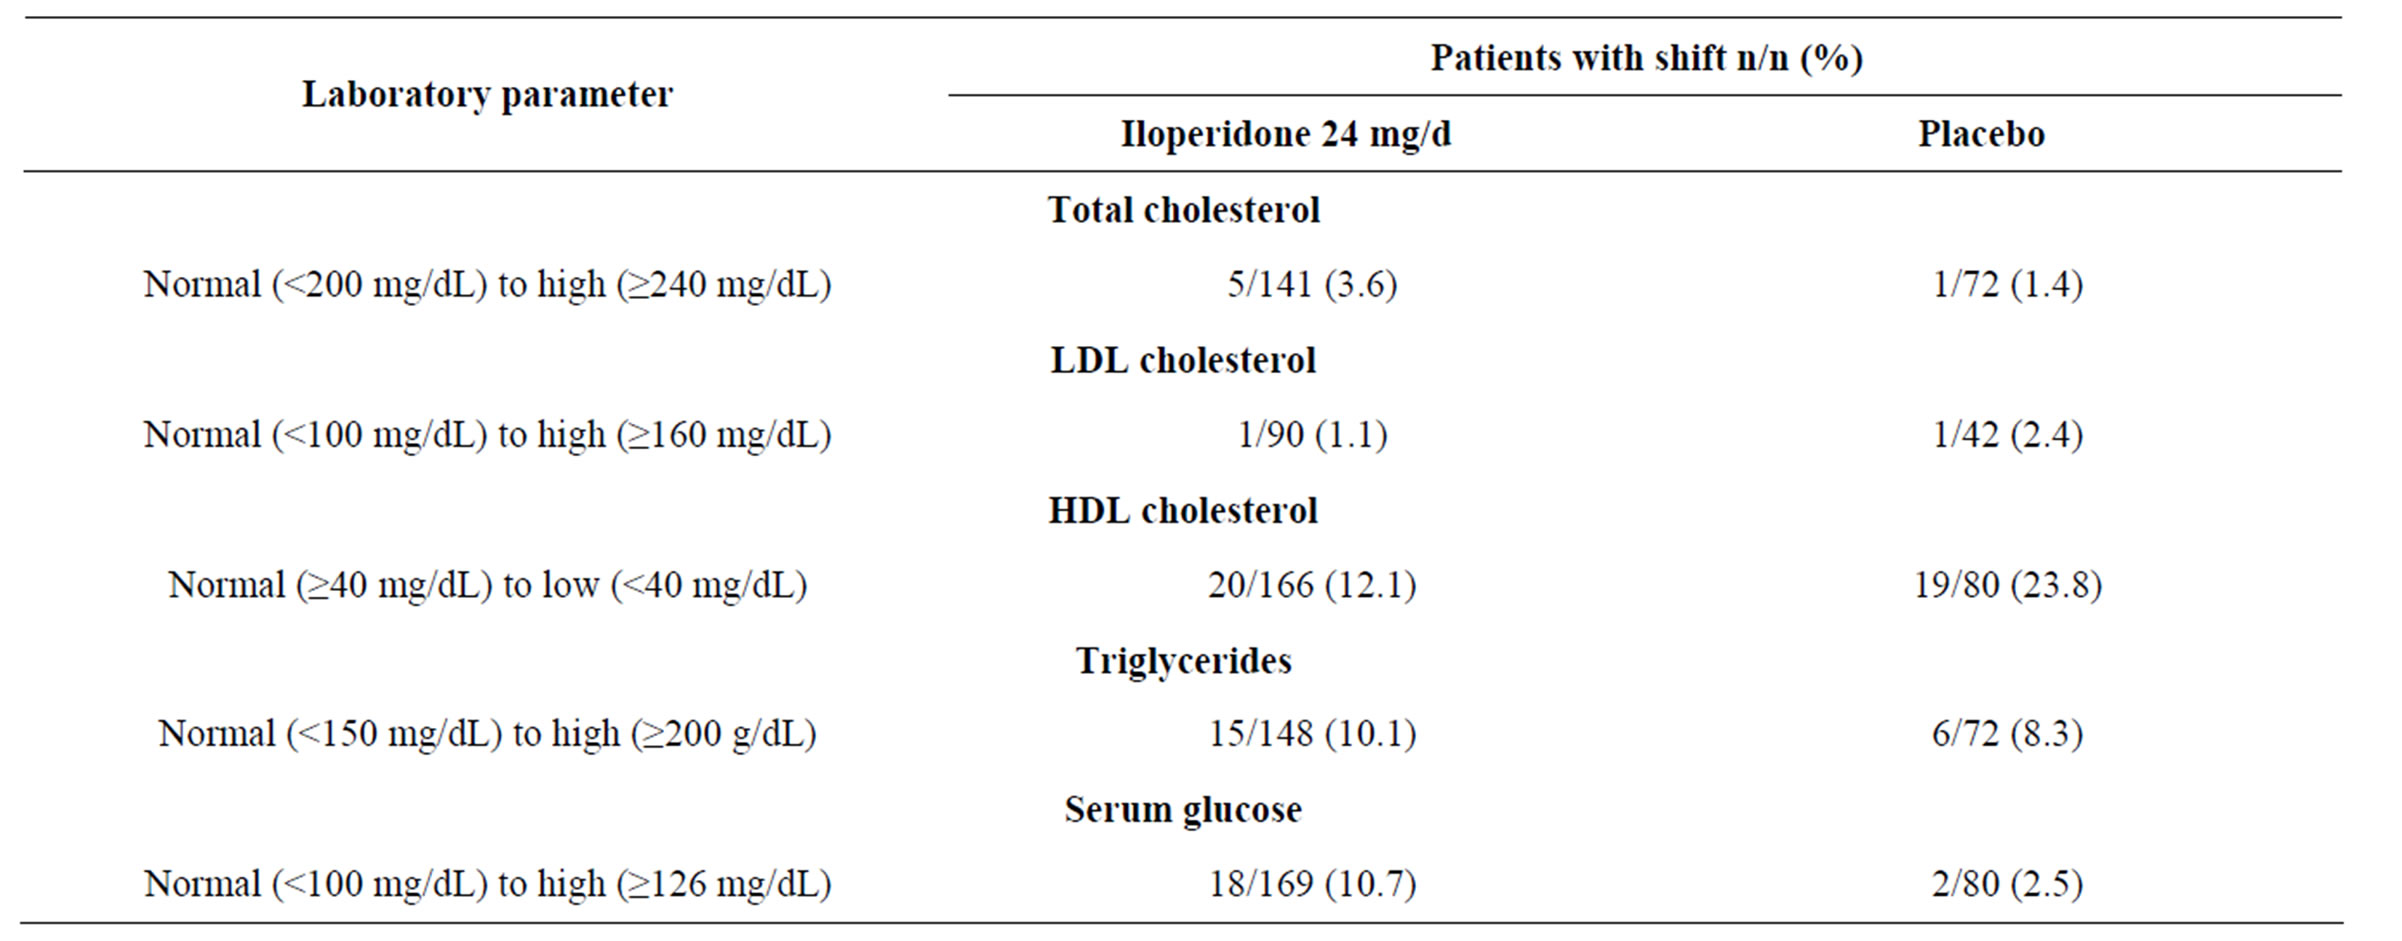
Table 4. Proportion of patients shifting from normal to high/low mean fasting laboratory values in Study 3101.
3.3. Glucose Level Changes
Patients receiving placebo experienced a decrease in fasting and nonfasting mean glucose of 3.6 mg/dL from baseline to Week 4 and no change from baseline at Week 6 and at 3 - 6 months (Figure 3). Among iloperidonetreated patients, mean glucose levels increased 5.4 mg/dL from baseline to Week 4 and between 1.8 and 5.4 mg/dL from baseline to time points after Week 6. Mean glucose levels for the iloperidone 20 - 24 mg/d group were increased 9.0 mg/dL from baseline to Week 4 then decreased between 3.6 and 18.0 mg/dL from baseline to time points after Week 6 (Figure 3).
Mean fasting glucose levels did not change from baseline to end of study (−0.05 mg/dL) in patients who received placebo. Patients who received iloperidone 24 mg/d experienced mean changes for fasting glucose from baseline to end of study similar to those changes experienced by patients who received iloperidone 20 - 24 mg/d across all 9 studies (6.6 and 9.0 mg/dL, respectively) (Figures 2 and 3). Mean glycosylated hemoglobin (hemoglobin A1C) levels (measured only in Study 3101) did not change from baseline to end of study (Figure 2). Shifts in mean fasting glucose levels from normal to high were experienced by 10.7% of patients on iloperidone 24 mg/d and by 2.5% of patients on placebo (Table 4).
4. DISCUSSION
Among more than 3200 patients participating in 9 Phase II and Phase III trials, iloperidone led to an average weight gain of about 2 kg following treatment for greater than 1 year, and most weight gain occurred within the first 6 weeks of the studies. Clinical study experience with iloperidone places it in the mid-range category for weight gain among atypical antipsychotic agents [5,7,9]. Weight gain in the placebo-controlled studies was lower than in long-term, comparator-controlled studies (2.0 kg versus 3.8 kg) (Data on file, Novartis) [10,11]. The mechanistic basis of weight gain with iloperidone is unknown, however iloperidone binds to serotonin 5-HT2A, 5-HT2C, and histamine H1 receptors [15-18], which have been implicated in antipsychotic-associated weight gain [19].
Weight gain is often linked to changes in lipids and glucose, however, in this analysis the mid-range weight gain seen with iloperidone was accompanied by less substantial lipid and glucose changes. The uncoupling of changes in body weight or body mass index to changes in lipid levels has been observed in other studies [20-22]. A retrospective study of 94 patients on risperidone or olanzapine found that despite statistically significant increases in weight in both treatment groups, only pa-

Figure 3. Changes in fasting and nonfasting mean glucose levels in 9 pooled clinical trials of iloperidone.
tients on olanzapine showed significant increases in glucose and total cholesterol levels [22]. Weight gain was not correlated with change in glucose or lipids for either treatment group, on monotherapy with antipsychotics including olanzapine, clozapine, and sulpiride [20,22]. Data from the Study of Second-generation Antipsychotic Treatment Indications, Effectiveness, and Tolerability in Youth (SATIETY) also showed a contrast for patients, a finding shared by a study of Taiwanese inpatients on aripiprazole between worsening of body composition measurements and stability of metabolic parameters [21]. The physiologic basis for this disconnect remains unknown.
A limitation of the studies used in this analysis is that not all blood samples were taken at a fasting stage, thus the most abundant data are a mix of fasting and nonfasting values. Some clinicians have questioned the necessity of obtaining blood parameters at fasting, especially given that most people consume food throughout the day and are thus postprandial the majority of the time [23]. A study of lipid profiles over time in over 33,000 patients in the Copenhagen General Population Study indicated that maximum mean postprandial lipid changes were −0.2 mmol/L (−7.7 mg/dL) for total and LDL cholesterol, −0.1 mmol/L (−3.9 mg/dL) for HDL cholesterol, and 0.3 mmol/L (26.7 mg/dL) for triglycerides. Nonfasting lipids were predictive of later risk for cardiovascular disease [24].
Nonfasting total cholesterol and HDL cholesterol levels are considered acceptable for determination of risk for cardiovascular complications by the National Cholesterol Education Program Adult Treatment Panel (ATP) III, which recommends keeping fasting total cholesterol levels to below 200 mg/dL [25]. Although mean changes in fasting cholesterol of 8 mg/dL were observed during the 4-week study, nonfasting cholesterol measurements showed decreases from baseline to time points after Week 4, and neither short-term nor long-term treatment with iloperidone lead to development of high or borderline high cholesterol for the overall study population. Baseline fasting LDL and HDL cholesterol levels in Study 3101 were within normal limits and mean levels changed by 5 - 10 mg/dL following 4 weeks of treatment. With longer-term treatment (fasting or nonfasting) these levels continued to improve or remain the same. The magnitude of cholesterol change from baseline to Week 4 for nonfasted patients was similar to that for fasted patients. Although about 3.6% of patients on iloperidone experienced an increase from normal to high levels of fasting total cholesterol compared with 1.4% of patients on placebo, a lower frequency of patients on iloperidone versus placebo experienced low HDL cholesterol levels. In addition, 1.1% of patients on iloperidone shifted from normal to high levels of LDL cholesterol, a lower percentage than the 2.4% of patients whose LDL levels increased on placebo. High LDL cholesterol levels are considered the most reliable indicator of lifetime cardiovascular disease risk [25].
Fasting triglyceride levels <150 mg/dL are considered normal [25]. Mean fasting triglyceride levels were above normal at baseline (159 mg/dL) for the iloperidone group (though this group had a large amount of variation, with a standard deviation of 109 mg/dL) but not for the placebo group (140 mg/dL). Mean fasting triglyceride levels in the double-blind portion of Study 3101 and random fasting and nonfasting triglyceride levels in the 9 pooled trials decreased from baseline to all time points, indicating no impact in these populations. In addition, the percentage of patients who experienced an increase from normal to high triglyceride levels while taking iloperidone was similar to that observed among patients given placebo.
Development of type 2 diabetes remains a concern with second generation antipsychotics [26,27]. Approximately 11% of patients treated with iloperidone 24 mg/d in Study 3101 experienced an increase in fasting serum glucose levels from normal to high, compared with 3% of patients receiving placebo. Baseline random mean glucose levels (99 - 112 mg/dL) and baseline fasting mean glucose levels (94 mg/dL) were normal for all iloperidone-treatment groups, and mean increases from baseline of about 5 mg/dL in both the fasting and random glucose groups did not indicate an overall shift to diabetic levels. Similarly, mean levels of glycosylated hemoglobin were unchanged over the 4-week Study 3101.
5. CONCLUSION
These data indicate a metabolic profile for iloperidone of modest weight gain that was not associated with substantial changes in lipids and glucose.
6. ACKNOWLEDGEMENTS
The authors acknowledge Oxford PharmaGenesis, Inc., for editorial assistance with this manuscript, the funding for which was supported by Novartis Pharmaceuticals Corporation.
REFERENCES
- Goff, D.C., Sullivan, L.M., McEvoy, J.P., Meyer, J.M., Nasrallah, H.A., Daumit, G.L., Lamberti, S., D’Agostino, R.B., Stroup, T.S., Davis, S. and Lieberman, J.A. (2005) A comparison of ten-year cardiac risk estimates in schizophrenia patients from the CATIE study and matched controls. Schizophrenia Research, 80, 45-53. doi:10.1016/j.schres.2005.08.010
- Oud, M.J.T. and Meyboom-de Jong, B. (2009) Somatic diseases in patients with schizophrenia in general practice: Their prevalence and health care. BMC Family Practice, 10, 32-40. doi:10.1186/1471-2296-10-32
- Brown, S., Barraclough, B. and Inskip, H. (2000) Causes of the excess mortality of schizophrenia. British Journal of Psychiatry, 177, 212-217. doi:10.1192/bjp.177.3.212
- Bushe, C.J., Taylor, M. and Haukka, J. (2010) Mortality in schizophrenia: a measurable clinical endpoint. Journal of Psychopharmacology, 24, 17-25. doi:10.1177/1359786810382468
- Allison, D.B., Mentore, J.L., Heo, M., Chandler, L.P., Cappelleri, J.C., Infante, M.C. and Weiden, P.J. (1999) Antipsychotic-induced weight gain: A comprehensive research synthesis. America Journal of Psychiatry, 156, 1686-1696.
- Newcomer, J.W. (2007) Metabolic syndrome and mental illness. America Journal of Managed Care, 13, S170- S177.
- Parsons, B., Allison, D.B., Loebel, A., Williams, K., Giller, E., Romano, S. and Siu, C. (2009) Weight effects associated with antipsychotics: A comprehensive database analysis. Schizophrenia Research, 110, 103-110. doi:10.1016/j.schres.2008.09.025
- Kroeze, W.K., Hufeisen, S.J., Popadak, B.A., Renock, S.M., Steinberg, S. and Ernsberge, P. (2003) H1-Histamine receptor affinity predicts short-term weight gain for typical and atypical antipsychotic drugs. Neuropsychopharmacology, 28, 519-526. doi:10.1038/sj.npp.1300027
- American Diabetes Association, American Psychiatric Association, American Association of Clinical Endocrinologists, North American Association for the Study of Obesity (2004) Consensus development conference on antipsychotic drugs and obesity and diabetes. Journal of Clinical Psychiatry, 65, 267-272. doi:10.4088/JCP.v65n0219
- Weiden, P.J., Cutler, A.J., Polymeropoulos, M.H. and Wolfgang, C.D. (2008) Safety profile of iloperidone: A pooled analysis of 6-week acute-phase pivotal trials. Journal of Clinical Psychopharmacology, 28, S12-S19. doi:10.1097/JCP.0b013e3181694f5a
- Kane, J.M., Lauriello, J., Laska, E., Di Marino, M. and Wolfgang, C.D. (2008) Long-term efficacy and safety of iloperidone: Results from 3 clinical trials for the treatment of schizophrenia. Journal of Clinical Psychopharmacology, 28, S29-S35. doi:10.1097/JCP.0b013e318169cca7
- Potkin, S.G., Litman, R.E., Torres, R. and Wolfgang, C.D. (2008) Efficacy of iloperidone in the treatment of schizophrenia: initial phase 3 studies. Journal of Clinical Psychopharmacology, 28, S4-S11. doi:10.1097/JCP.0b013e3181692787
- Cutler, A.J., Kalali, A.H., Weiden, P.J., Hamilton, J. and Wolfgang, C.D. (2008) Four-week, double-blind, placeboand ziprasidone-controlled trial of iloperidone in patients with acute exacerbations of schizophrenia. Journal of Clinical Psychopharmacology, 28, S20-S28. doi:10.1097/JCP.0b013e318169d4ce
- American Psychiatric Association (2000) Diagnostic and statistical manual of mental disorders. 4th Edition (Text Revision), American Psychiatric Association, Washington DC.
- Novartis Pharmaceuticals Corporation (2012) Fanapt (iloperidone) tablets. http://www.pharma.us.novartis.com/product/pi/pdf/fanapt.pdf
- Kongsamut, S., Roehr, J.E., Cai, J., Hartman, H.B., Weissensee, P., Kerman, L.L., Tang, L. and Sandrasagra, A. (1996) Iloperidone binding to human and rat dopamine and 5-HT receptors. European Journal of Pharmacology, 317, 417-423. doi:10.1016/S0014-2999(96)00840-0
- Kalkman, H.O., Subramanian, N. and Hoyer, D. (2001) Extended radioligand binding profile of iloperidone: A broad spectrum dopamine serotonin/norepinephrine receptor antagonist for the management of psychotic disorders. Neuropsychopharmacology, 25, 904-914. doi:10.1016/S0893-133X(01)00285-8
- Ichikawa, J., Li, Z., Dai, J. and Meltzer, H.Y. (2002) Atypical antipsychotic drugs, quetiapine, iloperidone, and melperone, preferentially increase dopamine and acetylcholine release in rat medial prefrontal cortex: Role of 5-HT receptor agonism. Brain Research, 956, 349-357. doi:10.1016/S0006-8993(02)03570-9
- Roerig, J.L., Steffen, K.J. and Mitchell, J.E. (2011) Atypical antipsychotic-induced weight gain: Insights into mechanisms of action. CNS Drugs, 25, 1035-1059. doi:10.2165/11596300-000000000-00000
- Huang, T.-L. and Lu, C.-Y. (2007) Correlations between weight changes and lipid profile changes in schizophrenic patients after antipsychotics therapy. Chang Gung Medical Journal, 30, 26-32.
- Correll, C.U., Manu, P., Olshanskiy, V., Napolitano, B., Kane, J.M. and Malhotra, A.K. (2009) Cardiometabolic risk of second-generation antipsychotics during first-time use in children and adolescents. The Journal of the American Medical Association, 302, 1765-1773. doi:10.1001/jama.2009.1549
- Meyer, J.M. (2002) A retrospective comparison of weight, lipid, and glucose changes between risperidoneand olanzapine-treated inpatients: Metabolic outcomes after 1 year. Journal of Clinical Psychiatry, 63, 425-433. doi:10.4088/JCP.v63n0509
- Kannel, W.B. and Vasan, R.S. (2009) Triglycerides as vascular risk factors: new epidemiologic insights for current opinion in cardiology. Current Opinion in Cardiology, 24, 345-350. doi:10.1097/HCO.0b013e32832c1284
- Langsted, A., Freiberg, J.J. and Nordestgaard, B.G. (2008) Fasting and nonfasting lipid levels: Influence of normal food intake on lipids, lipoproteins, apolipoproteins, and cardiovascular risk. Circulation, 118, 2047-2056. doi:10.1161/CIRCULATIONAHA.108.804146
- National Institutes of Health, National Heart, Lung, and Blood Institute (2002) Third report of the National Cholesterol Education Program (NCEP) expert panel on detection, evaluation, and treatment of high blood cholesterol in adults (Adult Treatment Panel III) final report. http://www.nhlbi.nih.gov/guidelines/cholesterol/atp3full.pdf
- Taylor, D., Young, C., Mohamed, R., Paton, C. and Walwyn, R. (2005) Undiagnosed impaired fasting glucose and diabetes mellitus amongst inpatients receiving antipsychotic drugs. Journal of Psychopharmacology, 19, 63-74. doi:10.1177/0269881105049039
- Nielsen, J., Skadhede, S. and Correll, C.U. (2010) Antipsychotics associated with the development of Type 2 diabetes in antipsychotic-naive schizophrenia patients. Neuropsychopharmacology, 35, 1997-2004. doi:10.1038/npp.2010.78
NOTES
*Competing interests: All authors are employees of Novartis Pharmaceuticals Corporation.